Article Text

Abstract
Objective To develop a clinical prediction model to diagnose neonatal sepsis in low-resource settings.
Design Secondary analysis of data collected by the Neotree digital health system from 1 February 2019 to 31 March 2020. We used multivariable logistic regression with candidate predictors identified from expert opinion and literature review. Missing data were imputed using multivariate imputation and model performance was evaluated in the derivation cohort.
Setting A tertiary neonatal unit at Sally Mugabe Central Hospital, Zimbabwe.
Patients We included 2628 neonates aged <72 hours, gestation ≥32+0 weeks and birth weight ≥1500 g.
Interventions Participants received standard care as no specific interventions were dictated by the study protocol.
Main outcome measures Clinical early-onset neonatal sepsis (within the first 72 hours of life), defined by the treating consultant neonatologist.
Results Clinical early-onset sepsis was diagnosed in 297 neonates (11%). The optimal model included eight predictors: maternal fever, offensive liquor, prolonged rupture of membranes, neonatal temperature, respiratory rate, activity, chest retractions and grunting. Receiver operating characteristic analysis gave an area under the curve of 0.74 (95% CI 0.70–0.77). For a sensitivity of 95% (92%–97%), corresponding specificity was 11% (10%–13%), positive predictive value 12% (11%–13%), negative predictive value 95% (92%–97%), positive likelihood ratio 1.1 (95% CI 1.0–1.1) and negative likelihood ratio 0.4 (95% CI 0.3–0.6).
Conclusions Our clinical prediction model achieved high sensitivity with low specificity, suggesting it may be suited to excluding early-onset sepsis. Future work will validate and update this model before considering implementation within the Neotree.
- Global Health
- Infectious Disease Medicine
- Intensive Care Units, Neonatal
- Neonatology
- Sepsis
Data availability statement
Data are available upon reasonable request. An open-source, anonymised research database is planned as part of the wider Neotree project. Currently, sharing of deidentified individual participant data will be considered on a case-by-case basis.
This is an open access article distributed in accordance with the Creative Commons Attribution 4.0 Unported (CC BY 4.0) license, which permits others to copy, redistribute, remix, transform and build upon this work for any purpose, provided the original work is properly cited, a link to the licence is given, and indication of whether changes were made. See: https://creativecommons.org/licenses/by/4.0/.
Statistics from Altmetric.com
WHAT IS ALREADY KNOWN ON THIS TOPIC
Neonatal sepsis is difficult to diagnose as the clinical features are non-specific.
In low-resource settings, early neonatal care may be led by less experienced healthcare professionals without immediate local senior support.
Clinical prediction models exist to diagnose neonatal sepsis but there is a need for models suitable to implement in low-resource settings.
WHAT THIS STUDY ADDS
Our model has been specifically developed in a cohort of neonates from a lower middle-income, low-resource neonatal unit in sub-Saharan Africa.
It is easy to implement in low-resource settings as it does not require laboratory tests.
HOW THIS STUDY MIGHT AFFECT RESEARCH, PRACTICE OR POLICY
Our model predicts a diagnosis of early-onset sepsis made by an experienced neonatologist to support less experienced healthcare professionals admitting neonates to the neonatal unit.
Introduction
Neonatal sepsis caused 15% of the 2.5 million neonatal deaths worldwide in 2018 and has a mortality rate of 110–190 per 1000 live births.1 2 It can be difficult to diagnose as the clinical features overlap with non-infectious diseases.3 Failing to treat sepsis with timely antimicrobials increases the risk of death or disability, but empirical antimicrobial therapy in non-infected neonates contributes to antimicrobial resistance and adverse outcomes.4 5
Isolating a pathogenic organism from a normally sterile site is the gold standard diagnostic method,6 but has limitations. In low-resource settings (LRS), cultures and blood counts are often unavailable,7 or turnaround times are too long to usefully inform management.8 9 Blood cultures have high sensitivity provided sufficient inoculate volume is obtained, but sampling can be difficult in unwell neonates.10 Therefore, clinicians may diagnose sepsis and initiate empirical therapy despite negative cultures, based on clinical presentation, risk factors and/or raised inflammatory markers. This is often called ‘culture-negative’ sepsis and up to 16 times more neonates receive antibiotics for culture-negative sepsis than for sepsis with a positive culture.11 Diagnostic challenges are increased in LRS where early neonatal care may be led by less experienced healthcare professionals (HCPs) without immediate local senior support.8
Clinical prediction models combine patient or disease characteristics to estimate the probability of a diagnosis or outcome.12 Models to diagnose neonatal sepsis may improve diagnostic accuracy and rationalise antibiotic use. In LRS, they could provide clinical decision support for less experienced HCPs, especially if models do not require laboratory tests. Several existing models estimate the probability of neonatal sepsis, but few are developed for LRS.13 14
Our objective was to develop a clinical prediction model to diagnose neonatal sepsis in an LRS neonatal unit, to support less experienced HCPs make this diagnosis.
Methods
We report methods according to the Transparent Reporting of a Multivariable Prediction Model for Individual Prognosis or Diagnosis statement (online supplemental file 1).15 Further methods are found in online supplemental file 2 and accompanying R code at https://zenodo.org/record/7817247.
Supplemental material
Source of data
We performed secondary analysis of data from the Neotree at the neonatal unit of Sally Mugabe Central Hospital (SMCH), Zimbabwe. Data were collected over 14 months from 1 February 2019 to 31 March 2020.
The Neotree is an open-source digital health system for newborn care in LRS,16 embedded in routine practice at three neonatal units in sub-Saharan Africa (Kamuzu Central Hospital, Malawi; SMCH, Zimbabwe; and Chinhoyi Provincial Hospital, Zimbabwe).17 On admission, HCPs complete an admission form using the Neotree application on an Android tablet. The application guides assessment of the neonate and collects predefined data. At discharge or after neonatal death, HCPs complete an outcome form, which includes the final diagnoses or cause(s) of death after review by a consultant neonatologist (online supplemental file 2, section 1).
Participants
SMCH has the largest of three tertiary neonatal units in Zimbabwe, with 100 cots. Most admissions come directly from the labour ward or obstetric theatre, but SMCH is also a national referral centre for specialist surgical care.
We included neonates with chronological age <72 hours, ≥32+0 weeks’ gestation at birth and birth weight ≥1500 g. We excluded non-first-born multiples and those with a diagnosis of major congenital anomaly, no outcome form completed or anomalous admission durations (eg, date of discharge before date of admission).
Outcome
The primary outcome was clinical early-onset neonatal sepsis (EOS), defined as sepsis with onset within the first 72 hours of life, as diagnosed by the treating consultant neonatologist and recorded on the outcome form as one or more of: (1) primary discharge diagnosis, (2) additional problem during admission, (3) primary cause of death or (4) contributory cause of death. No specific actions were performed to blind outcome assessment.
Predictors
We identified candidate predictors through a modified Delphi method study18 and literature review.13 We mapped these predictors to available Neotree data, yielding 22 candidate predictors (online supplemental file 2, section 2). No specific actions were performed to blind predictor assessment.
Statistical analysis
Analyses were performed in RStudio V.2022.02.0+443 (R V.4.1.3).19 20 No specific sample size calculations were performed but post hoc calculations are shown in online supplemental file 2, section 9.
Data preparation
We linked admission and outcome forms using the Fellegi-Sunter method of probabilistic record linkage (online supplemental file 2, section 4).21 22 We imputed missing values using multivariate imputation by chained equations assuming missing at random with 40 imputed data sets (online supplemental file 2, section 6).23
Model development and specification
We used multivariable logistic regression to predict diagnosis of clinical EOS. For convenience, model selection was performed in one data set randomly selected from all imputed data sets. First, we fitted a ‘full’ main effects model containing all candidate predictors assuming linearity of continuous predictors and additivity at the predictor scale. We excluded categorical variables with skewed distributions (<5% category prevalence in either outcome group) if Fisher’s exact test was non-significant (p≥0.05) for the  contingency table. Otherwise, skewed categorical predictors were retained, and smaller categories combined into an ‘other’ category. Next, we compared plausible variations to the full model, selecting the ‘optimal’ model which minimised both the Akaike and Bayesian information criteria (online supplemental file 2, section 8). We explored non-linear effects of continuous predictors with natural cubic spline functions (2–10 df) and polynomial transformations (second-degree to fifth-degree polynomials), and tested for interaction between birth weight and gestational age. Finally, we fitted the optimal model across all imputed data sets and obtained pooled regression coefficients and their SEs using Rubin’s rules.24
Model performance
We evaluated the performance of the optimal model in the derivation cohort. Discrimination was quantified by plotting a receiver operating characteristic curve in each imputed data set. We pooled the area under the curve (AUC) and variance across imputed data sets using Rubin’s rules.24 Calibration was assessed by plotting a flexible calibration curve with a loess smoother in the single data set used for model selection.25 Sensitivity, specificity, predictive values and likelihood ratios of the optimal model were estimated in the single data set used for model selection. These metrics are presented for the ‘optimal’ probability threshold according to Youden’s J statistic,26 and for thresholds corresponding to sensitivities of 80, 85, 90 and 95%. CIs for likelihood ratios were obtained using bootstrap with 10 000 resamples.27
Results
Participants
Of 3577 neonates with matched admission and outcome records, 2628 (73%) were included (figure 1). Mean gestational age was 38.0 (SD=2.5) weeks, mean birth weight 2890 (SD=700) g, 1141 (43%) received ≥1 antibiotic and 221 (8%) died (table 1). Clinical EOS was diagnosed in 297 neonates (11%, incidence 113 per 1000 admissions).
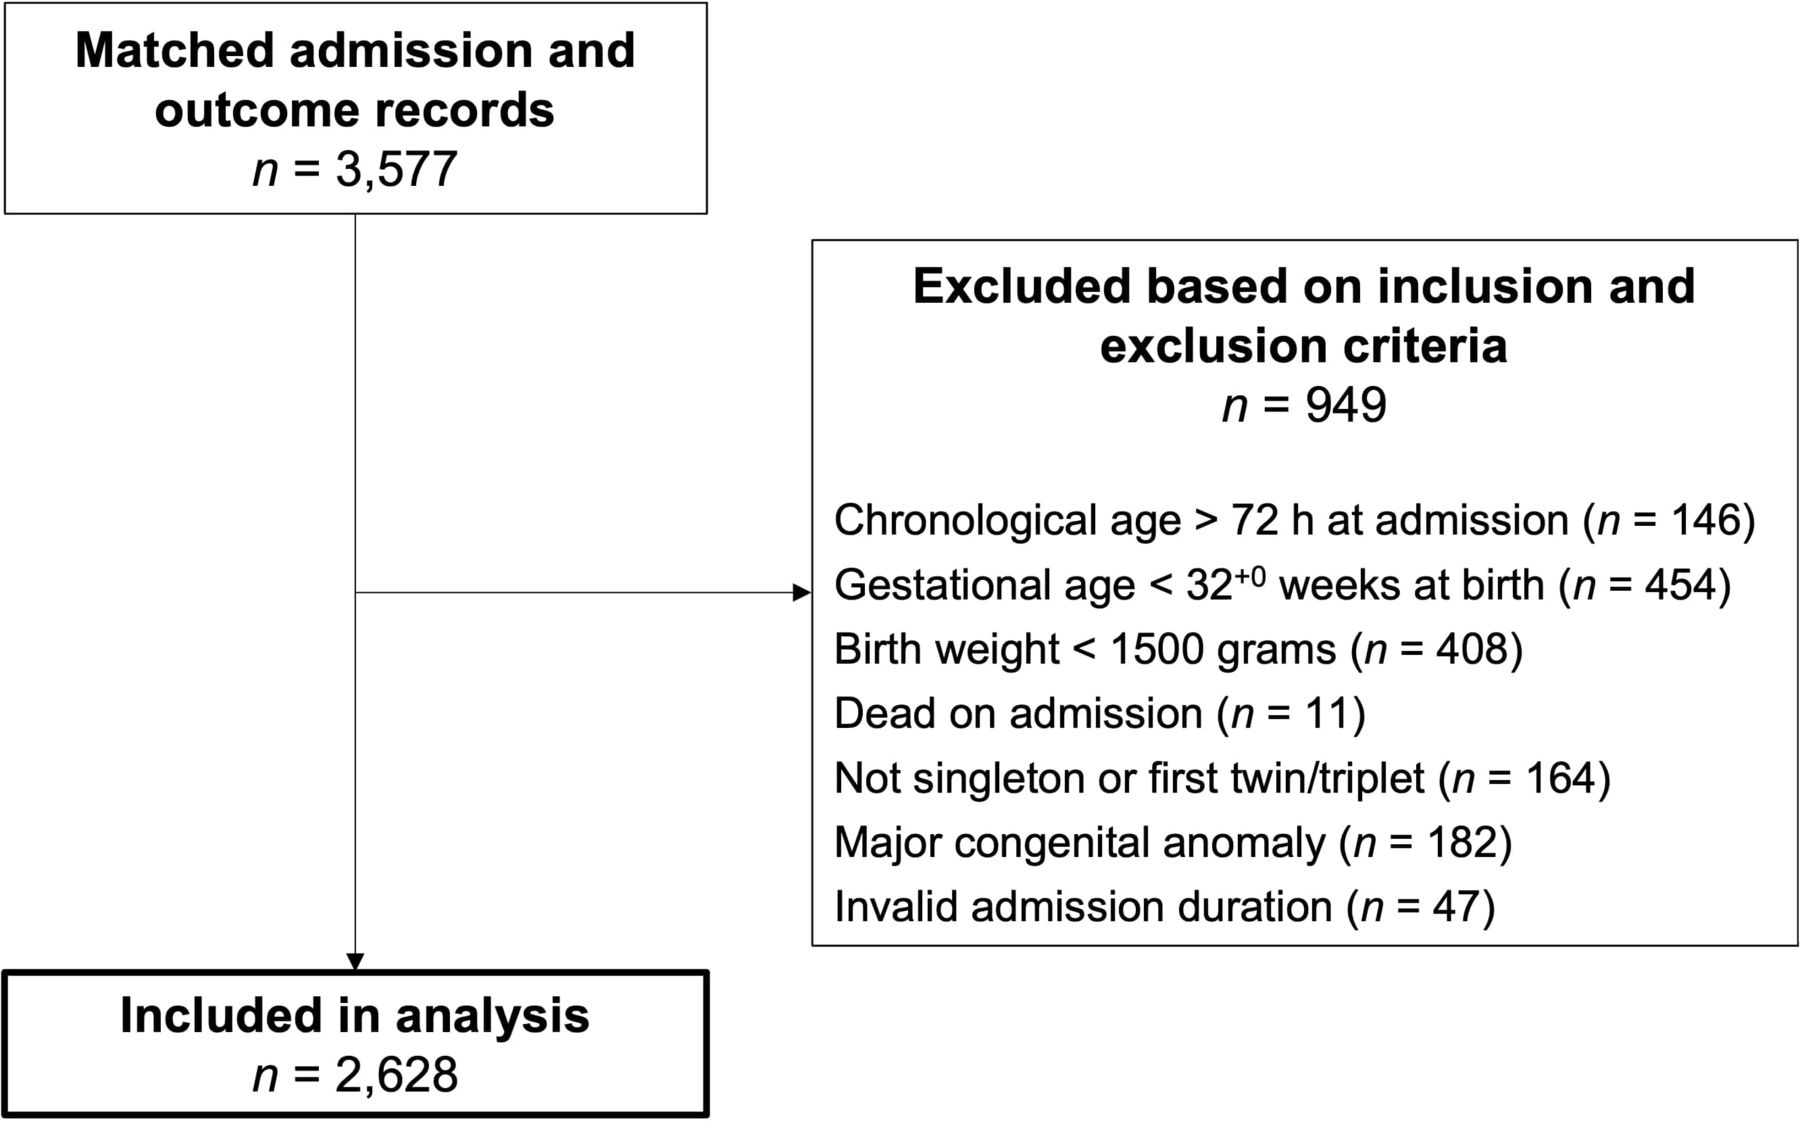
Flow diagram summarising participant inclusion and exclusion. Participants could fulfil multiple inclusion and/or exclusion criteria, therefore, the sum of participants excluded based on each criterion exceeds 949.
Characteristics of the study participants
Missing data
In total, 14 variables had missing values. All variables had <1% missing values except temperature (31%) and birth weight (1.2%). Time since the start of data collection predicted missing temperature (OR 0.96, 95% CI 0.96–0.96, p<0.001) as a limited number of thermometers were available early in the study. Missing temperature was not associated with clinical EOS (OR 0.79, 95% CI 0.60–1.03, p=0.08).
Model development
From the set of 22 candidate predictors (table 2), eight were excluded due to <5% category prevalence with a non-significant Fisher’s exact test (cyanosis, seizures, fontanelle, colour, abdominal distention, omphalitis, abnormal skin appearance and history of vomiting). Three of the five categories for activity had a prevalence of <5% in either outcome group but Fisher’s exact test indicated a significant difference in the distribution between the two groups (p<0.001). Activity was retained as a predictor and the three smaller categories were collapsed into one ‘other’ group.
Distributions of candidate predictors in the study cohort
Therefore, 14 candidate predictors were considered for model development. Of these, 12 had a significant univariable association with clinical EOS (table 3). The strongest univariable predictor was maternal fever (OR 6.0, 95% CI 2.1–17.4). Neither birth weight (OR 1.14, 95% CI 0.96–1.35) nor grunting at triage (OR 1.23, 95% CI 0.95–1.59) predicted clinical EOS in univariable models.
Univariable association between candidate predictors and outcome
Among plausible multivariable models, a model containing eight of the 14 candidate predictors was selected as the optimal model (online supplemental file 2, section 8). Fitting non-linear effects for temperature or birth weight, or allowing for an interaction between birth weight and gestational age, did not improve fit.
Model specification
The optimal model included eight predictors: temperature at admission, respiratory rate, maternal fever during labour, offensive liquor, prolonged rupture of membranes, activity, chest retractions and grunting (table 4). It can be written as:

Predictors and their pooled regression coefficients and ORs for the optimal model
where LP(EOS) denotes the linear predictor based on the logit transformation of the probability of clinical EOS. The probability of clinical EOS (Pr(EOS)) is thus given by the inverse logit function:

Model performance
The pooled AUC was 0.74 (95% CI 0.70–0.77) (figure 2). The calibration intercept was 0.00 (95% CI −0.13 to 0.13), calibration slope 1.00 (95% CI 0.85–1.15) and the calibration curve remained close to the identity line (figure 3).
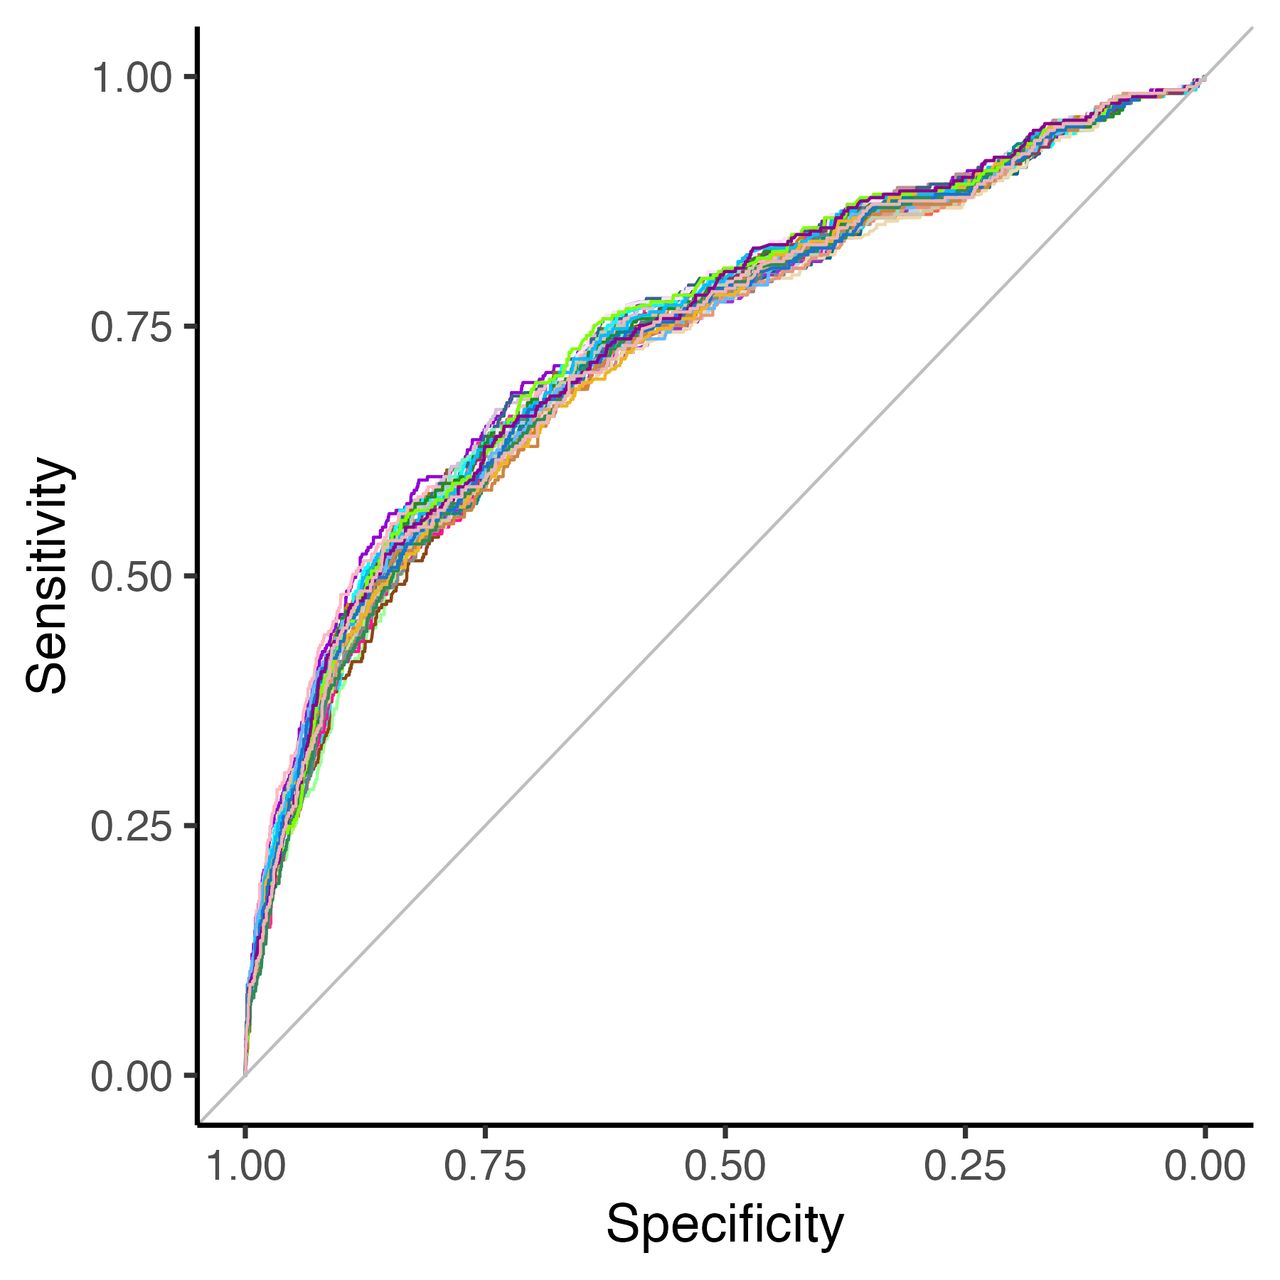
Receiver operating characteristic curve for the optimal model in each of the 40 imputed data sets. Pooled area under the curve (AUC)=0.74 (95% CI 0.70–0.77).

Calibration curve for the optimal model in the single data set used for model selection. A flexible curve with pointwise 95% CIs (shaded region) was fitted using local regression (loess). Calibration intercept=0.00 (95% CI −0.13 to 0.13); calibration slope=1.00 (95% CI 0.85–1.15). At the bottom of the figure, a violin plot shows the distribution of predicted probabilities for neonates with (1) and without (0) sepsis.
The ‘optimal’ classification threshold was 0.12 (ie, 12% predicted probability of clinical EOS) yielding sensitivity 65% (95% CI 59%–70%) and specificity 74% (95% CI 72%–75%) (table 5). For a sensitivity of 95%, the corresponding classification threshold was 0.03 giving sensitivity 95% (95% CI 92%–97%) and specificity 11% (95% CI 10%–13%). Corresponding predictive values and likelihood ratios are shown in table 5.
Model performance at several classification thresholds of predicted probability
Discussion
We developed a clinical prediction model to diagnose clinical EOS that can be applied in LRS. The optimal model included eight predictors: three perinatal risk factors (maternal fever during labour, offensive liquor and prolonged rupture of membranes) and five clinical signs in the neonate (temperature, respiratory rate, activity on neurological examination, chest retractions and grunting). Using a classification threshold for high sensitivity resulted in low specificity in the derivation cohort.
Interpretation
Incidence of clinical EOS was 113 per 1000 admissions. This is greater than a recent estimate for EOS in low-income and middle-income countries of 31.1 per 1000 live births (95% CI 9–100; I2 99.9%),28 but there is marked heterogeneity between relatively few studies worldwide.
Our model shares predictors with existing models for neonatal sepsis.13 While several models do not require laboratory tests (some of which have been validated in LRS), data are limited to a few small studies and comparisons are challenging as studies infrequently report global performance measures such as AUC. For example, Weber et al developed a score with 14 clinical features to predict neonatal sepsis, meningitis, pneumonia or hypoxaemia in LRS countries.29 Validation in the subgroup of 285 neonates aged ≤6 days of life showed a sensitivity of 95% with a specificity of 26% if one or more clinical features were present.29
The Kaiser Permanente Early-Onset Sepsis Calculator combines perinatal risk factors with clinical appearance to recommend management based on the estimated probability of EOS in neonates born at ≥34 weeks’ gestation.30 31 Meta-analyses suggest its use reduces rates of admission, antibiotic use and use of laboratory tests, without increased mortality (although some authors have voiced concerns about ‘missed’ or delayed diagnoses).32–35 All studies in these meta-analyses were from high-income countries.
The Kaiser Permanente Calculator does not require laboratory tests but may be less suited to LRS. First, the baseline incidences of EOS used are lower than in most LRS.28 30 Second, the calculator was developed in a population where Group B Streptococcus (GBS) is the predominant organism in EOS and where antenatal GBS screening is performed routinely. Finally, descriptors used for clinical presentation (‘clinical illness’, ‘equivocal’ and ‘well appearing’) include interventions such as mechanical ventilation, which are not useful measures of illness in neonatal units where these interventions are unavailable. Two studies have validated the Kaiser Permanente Calculator in middle-income countries with variable results.36 37 No studies have validated the calculator in low-income countries or sub-Saharan Africa.
Implications
Our model includes clinical predictors and risk factors that are simple to identify by any grade of HCP with minimal additional training. Acceptable classification thresholds will vary by clinical context. High sensitivity is important to avoid missing true cases of sepsis, but higher specificity would reduce inappropriate antimicrobial therapy and might be favoured during periods of resource shortages to allow treatment of neonates with the highest probability of EOS.
Our model may be suited to excluding EOS given its low negative likelihood ratio (which represents the change in pretest to post-test odds of having EOS given our model classified a neonate as ‘no EOS’38). At a classification threshold of 0.03, the negative likelihood ratio was 0.4 (95% CI 0.3–0.6): a 60% reduction in the odds of EOS for neonates classified as ‘no EOS’. In our cohort, the model had a high negative predictive value (which represents the probability that a neonate does not have EOS if our model classified them as ‘no EOS’38). Approximately 300 neonates are admitted each month to SMCH.39 With a negative predictive value of 95% and our EOS prevalence of 113 per 1000 admissions, we would expect one or two true cases of EOS to be missed per month.
We would suggest managing neonates classified as having EOS with parenteral antibiotic therapy as per local protocols. Management of neonates classified as ‘no EOS’ would depend on the chosen classification threshold (and resultant negative predictive value) and local HCPs’ and families’ attitudes to risk. Neonates are assessed by the Neotree on admission to the neonatal unit, suggesting they appear unwell to an HCP (nurse, midwife or obstetrician). If classified as ‘no EOS’ by our model, neonates should be observed and investigated for an alternative diagnosis. It may be useful to reapply our model (eg, at 12 hours) to update predictions when the clinical picture has evolved. This is feasible given median admission duration in our cohort was 2.1 (IQR 2.9) days for those without EOS, although further research is required to validate the model in this context.
Limitations
First, the Neotree collects data at admission and on discharge or death. Neonates admitted for ‘safekeeping’ could have unremarkable clinical appearance and vital signs on admission but develop signs of sepsis later during admission.
Second, very preterm and very low birthweight neonates were not included. Our study focused on stratifying risk of EOS in moderate to late preterm and term neonates, where evidence-based recommendations advising against antibiotics might be more readily observed.
Third, no specific actions were performed to blind outcome assessment. As we performed secondary analysis of data from a quality improvement project, the consultant neonatologist is unlikely to have been biased in their classification of EOS.
Fourth, although blood culture is the gold standard method for diagnosing EOS, erratic supplies of lab reagents meant we could not assess the correlation between positive blood cultures and the consultant neonatologists’ diagnosis of EOS.
Finally, we present model performance in the derivation data, which can be optimistic due to overfitting.12
Conclusions
We developed a prediction model to diagnose clinical EOS using eight predictors. For high sensitivity it achieved low specificity, suggesting it may be suited to excluding EOS to support HCPs’ decisions to withhold antibiotics in non-septic neonates. Our future work will examine (1) external validation; (2) acceptability and feasibility of implementation via the Neotree; and (3) impact of implementation on sepsis-related neonatal morbidity and mortality.
Data availability statement
Data are available upon reasonable request. An open-source, anonymised research database is planned as part of the wider Neotree project. Currently, sharing of deidentified individual participant data will be considered on a case-by-case basis.
Ethics statements
Patient consent for publication
Ethics approval
This study involves human participants and was approved by the University College London Research Ethics Committee (16915/001, 5019/004), Medical Research Council Zimbabwe (MRCZ/A/2570) and Sally Mugabe Central Hospital Ethics Committee (250418/48). The requirement for informed consent was waived for this study as only data used for routine clinical care were collected. However, posters were displayed in the neonatal unit to inform parents of the ongoing study and doctors and nurses were available to address specific concerns.
Acknowledgments
We thank Dr David Musorowegomo, Dr Hannah Gannon and Ms Heather Chesters for assistance with the literature review. We thank Dr Liam Shaw and Mr Yali Sassoon for technical assistance exporting and manipulating Neotree data. We thank the wider Neotree team including Dr Caroline Crehan and Mr Tim Hull-Bailey for valuable discussions throughout the study. We also thank all the staff in the neonatal unit at Sally Mugabe Central Hospital, especially Dr Christopher Pasi (Chief Executive Officer), Dr Hopewell Mungani (Clinical Director), Ms Prisca Nyamapfeni, Matron Alice Mudzingwa and Matron Dade Pedzisai, for local support. We are grateful to the editor and reviewers for their constructive comments. Finally, we are grateful to all the babies and families who participated.
References
Supplementary materials
Supplementary Data
This web only file has been produced by the BMJ Publishing Group from an electronic file supplied by the author(s) and has not been edited for content.
Footnotes
Twitter @SamuelRNeal, @flicfitzgerald, @m_heys, @cortina_borja
MC-B and GC contributed equally.
Contributors SRN designed the study protocol, conducted the literature review, carried out the analyses, drafted the initial manuscript, reviewed and revised the manuscript and is responsible for its content as guarantor. MH and FF conceptualised the study, led the implementation of Neotree in Zimbabwe, supervised the analyses and critically reviewed and revised the manuscript. GC and SC led the implementation of Neotree in Zimbabwe, provided the data, contributed to study conception and critically reviewed and revised the manuscript. MC-B supervised the analyses and critically reviewed and revised the manuscript. All authors approved the final manuscript as submitted and agree to be accountable for all aspects of the work.
Funding This research was supported by the National Institute for Health Research (NIHR) Great Ormond Street Hospital Biomedical Research Centre. Funders of the wider Neotree project, past and present, include the Wellcome Trust Digital Innovation Award, RCPCH, Naughton-Cliffe Mathews, UCL Grand Challenges and Global Engagement Fund, and the Healthcare Infection Society.
Disclaimer The funders had no role in the design of the study; in the collection, analyses or interpretation of data; in the writing of the manuscript; or in the decision to publish the results.
Competing interests None declared.
Provenance and peer review Not commissioned; externally peer reviewed.
Supplemental material This content has been supplied by the author(s). It has not been vetted by BMJ Publishing Group Limited (BMJ) and may not have been peer-reviewed. Any opinions or recommendations discussed are solely those of the author(s) and are not endorsed by BMJ. BMJ disclaims all liability and responsibility arising from any reliance placed on the content. Where the content includes any translated material, BMJ does not warrant the accuracy and reliability of the translations (including but not limited to local regulations, clinical guidelines, terminology, drug names and drug dosages), and is not responsible for any error and/or omissions arising from translation and adaptation or otherwise.