Article Text

Abstract
Background Genetic evaluation of cardiomyopathies poses a challenge. Multiple genes are involved but no clear genotype–phenotype correlations have been found so far. In the past, genetic evaluation for hypertrophic (HCM) and dilated (DCM) cardiomyopathies was performed by sequential screening of a very limited number of genes. Recent developments in sequencing have increased the throughput, enabling simultaneous screening of multiple genes for multiple patients in a single sequencing run.
Objective Development and implementation of a next generation sequencing (NGS) based genetic test as replacement for Sanger sequencing.
Methods and Results In order to increase the number of genes that can be screened in a shorter time period, we enriched all exons of 23 of the most relevant HCM and DCM related genes using on-array multiplexed sequence capture followed by massively parallel pyrosequencing on the GS-FLX Titanium. After optimisation of array based sequence capture it was feasible to reliably detect a large panel of known and unknown variants in HCM and DCM patients, whereby the unknown variants could be confirmed by Sanger sequencing.
Conclusions The rate of detection of (pathogenic) variants in both HCM and DCM patients was increased due to a larger number of genes studied. Array based target enrichment followed by NGS showed the same accuracy as Sanger sequencing. Therefore, NGS is ready for implementation in a diagnostic setting.
- Cardiomyopathy
- Diagnostics
- Genetics
- Molecular genetics
This is an Open Access article distributed in accordance with the Creative Commons Attribution Non Commercial (CC BY-NC 3.0) license, which permits others to distribute, remix, adapt, build upon this work non-commercially, and license their derivative works on different terms, provided the original work is properly cited and the use is non-commercial. See: http://creativecommons.org/licenses/by-nc/3.0/
Statistics from Altmetric.com
Introduction
Genetic cardiomyopathies represent a group of diseases that are caused by alterations in over 50 genes lacking clear genotype–phenotype correlations.1–3As sequential testing of all those genes is both time consuming and expensive, a better testing strategy should therefore be cheaper and have shorter turnaround times. Over time, different approaches have been developed. In our laboratory, cardiomyopathy genes were tested using denaturing high performance liquid chromatography (dHPLC) followed by Sanger sequencing and Sanger sequencing without dHPLC as a pre-screen. Array based sequencing is a technique developed in the last few years that results in higher throughput, diminished costs, and shorter turnaround times.4 However, this technology is less sensitive to insertion/deletion detection, is less amenable to panel modification (by adding new genes, for example), and has a very limited sequencing capacity in comparison to Illumina GAII sequencing, for example.5 Next generation sequencing (NGS) is an attractive approach for high throughput screening of a large number of genes in a time and cost effective manner. At the moment the most popular choices are the Mi/HiSeq (Illumina), SOLiD (Life Technologies) and GS-FLX Titanium (Roche). Gowrisankar et al5 published their results on using the Illumina GAII for the sequencing of pooled concatenated PCR products from five patients with dilated cardiomyopathy (DCM) who were previously analysed on their sequencing array. They concluded that NGS showed an analytical sensitivity that outperformed array based sequencing, mainly because of better indel detection, but it had a higher turnaround time in their hands. Meder et al6 used the SOLiD 3 to test for mutations in 47 cardiomyopathy related and candidate genes in 10 patients diagnosed with either hypertrophic cardiomyopathy (HCM) or DCM. They concluded that an array based enrichment combined with SOLiD sequencing of 47 genes can be performed with high accuracy (but with known difficulties in detection of indels using short reads7) and in a cost effective manner.
For our study, we selected GS-FLX Titanium because of significantly longer reads, short run times and easy data analysis, making the transition to use in a diagnostic setting easier without the need for complex bioinformatics. Furthermore, the long reads of GS-FLX Titanium allow for more accurate mapping (pseudogene discrimination), detection of small indels, and can compensate for small untargeted regions of capture arrays.
In the present study we show that array based sequence capture can be optimised for balanced exon coverage. Optimised sequence capture in combination with GS-FLX Titanium sequencing allows for accurate detection of variants in 23 genes involved in HCM and DCM.
Methods
Subjects and clinical evaluation
This study comprises an initial pilot study followed by additional experiments in which a total of 63 patients were included. All patients have a confirmed diagnosis of HCM or DCM according to international criteria and were identified at or referred to the Department of Clinical Genetics, Academic Medical Center (AMC), Amsterdam, for screening of cardiomyopathy related genes offered at the Department of DNA diagnostics, AMC, the Netherlands.
For an initial pilot we included five HCM patients with a confirmed pathogenic mutation in either the MYBPC3 or MYH7 gene. In an additional experiment we included nine probands who were diagnosed with HCM but had no pathogenic mutation in eight HCM genes (MYBPC3, MYH7, MYL2, MYL3, TNNI3, TNNT2, TPM1, and GLA) screened in our laboratory by Sanger sequencing. Furthermore, we also included 19 probands diagnosed with DCM. However, DCM patients were not routinely screened for all these genes, in contrast to HCM patients. Finally, we included 30 cardiomyopathy index patients who were registered for routine DNA diagnostics for all HCM genes. These patients were used to validate the entire procedure with the intention to implement the procedure for diagnostics. Informed consent was obtained from all the patients.
Array design
We designed four custom 385K oligonucleotide microarrays according the Nimblegen Rebal algorithm to select unique probes (Roche NimbleGen). In the first design we targeted all exons, including 100 bp of the flanking upstream and downstream intronic sequence, of 18 genes with known involvement in HCM and/or DCM. The design comprises 236 exons, targeting 92.5 kb (table 1). In the second design we rebalanced the capture probes by the addition of replicate probes at regions with low coverage in order to obtain a more evenly distributed exon coverage. For regions with a coverage between 75% and 61% of the mean coverage we added one additional probe, between 60% and 51% we added two additional probes, between 50% and 41% we added three additional probes, between 40% and 31% we added four additional probes, between 30% and 21% we added five additional probes, and for ≤20% we added six additional probes. In the third design we fine-tuned the balancing and added five more genes, making the total number of genes 23, containing 292 exons and targeting 117.5 kb. These 23 genes were selected because they were already used in diagnostics supplemented with candidate genes that were selected based on published evidence, with a focus on mutation detection rate. In the fourth design we rebalanced the last five genes that were added (table 1).
Genes present on the capture array
A schematic overview of the different versions of the arrays used, the hybridisation protocol used, the array design used for a patient group and its improved performance as represented in coverage statistics is provided in online supplementary figure S1.
Sample preparation
DNA was isolated from peripheral blood leucocytes using an automated DNA isolator (Gentra). Then 0.5–5 µg DNA was fragmented according to the manufacturer's instructions (Covaris). DNA quality was assessed by running the samples on a DNA7500 chip on the Bioanalyzer (Agilent). Each sample was bar coded by ligation of GSMID-adaptors or RL-multiplex identifiers (MID) adapters using standard Roche protocols. Libraries were amplified by linker mediated PCR to obtain sufficient amounts of starting material for the sequence capture; 3 µg of amplified library was loaded onto the array according to manufacturer's instructions (http://www.nimblegen.com/products/lit/SeqCap_UserGuide_Titanium_Delivery_v1p1.pdf). For on-array multiplexed samples, 5–10 amplified libraries were mixed equimolarly and then 3 µg of the mixture was loaded onto the array. For multiplex experiments an equimolar pool of bar code specific blocker oligo's was added in the same concentration as used for non-multiplexed hybridisations.
Target enrichment and sequencing
Hybridisation, post-hybridisation washes and elution of the enriched sample was performed according to the manufacturer's instructions (http://www.nimblegen.com/products/lit/SeqCap_UserGuide_Titanium_Delivery_v1p1.pdf). To increase target enrichment, the enriched samples were hybridised a second time on the same array used the first time. This second hybridisation reduces background sequences (off-target sequences) that are still present after the first hybridisation. It is the reduction of background that results in higher on-target percentages. To verify successful hybridisation capture, we performed quantitative PCR (qPCR) on four control loci before and after array enrichment. The relative fold enrichment was calculated using the values of delta crossing point (CP) (ie, the difference between average CP of non-captured and average CP of captured samples) according Eδ-Cp where E is the efficiency of the qPCR assay for a particular amplicon.
The enriched library was diluted, annealed to capture beads, and clonally amplified by emulsion PCR. After emulsion PCR, beads with clonal amplicons were enriched and deposited on a picotitre plate and sequenced on the GS-FLX Titanium.
Mapping, variant detection and classification
The obtained sequence reads were mapped against the human reference genome (hg19) with the Roche GS Reference Mapper (V.2.6) using the default software settings. Output was restricted to the targeted regions as defined by the sequence capture design. Coverage statistics were extracted from the mapping output files using custom scripts. Variants were automatically detected during mapping and annotated with known gene (refSeq genes from http://genome.ucsc.edu/) and single nucleotide polymorphism (SNP) information (dbSNP130 from http://genome.ucsc.edu/). They were denoted as high quality differences (HCDiffs) when the variation was present in at least three non-duplicate reads that included at least one forward and one reverse read, or when it was seen in at least five reads with quality scores over 20. Variants that did not meet the above criteria were collected in the AllDiff files. Occasionally, known variants end up in the AllDiff table but not in the HCDiff table. A custom script was written for the comparison of the HCDiff and AllDiff variants and selection of variants with a variant percentage ≥20%.
The script also identifies, at the single base resolution, regions with a coverage lower than 16×. These regions are additionally analysed by Sanger sequencing. This threshold has been reported by Hoischen et al 8 to be sufficient for diagnostic testing. We also calculated the minimal number of reads needed statistically. For the statistics we have used the following criteria:
-
for a heterozygous variant the allele frequency is 50%
-
a variant is reported when the variant percentage is ≥20%.
All individual chances that a variant is missed at a given coverage is calculated in R using:
x—seq(300) and c—pbinom((x*0.2),x,0.5).
With these criteria we calculated a 99% sensitivity (comparable to a Phred quality score of 20) at 16×. The frequency of each individual coverage given a mean coverage±SD is calculated in R using y <- pnorm(x, mean coverage, SD) with x <- seq(300).
Then the chance that a variant is missed in an experiment with mean coverage±SD is calculated as: sum of (chance variant missed at given coverage)×(frequency at given coverage). Since we use a 16× threshold, the chance that a variant is missed is calculated for the 16× to 300× coverage interval. At a coverage of 100±35× this chance is 4.03E-5 (0.004%). An example of the calculations is given in online supplementary figure 2.
The following criteria were used to classify variations/mutations. We use a list of mutation specific features based on in silico analysis using the mutation interpretation software AlaMut (V.1.5). A score is given depending on the outcome of a prediction test for each feature (ie, Grantham distance). Then, depending on the total score and the availability of the variant in at least 300 ethnically matched control alleles (data obtained from the literature and/or the internet, eg, 1000 Genomes: http://browser.1000genomes.org/index.html; Exome Variant Server: http://evs.gs.washington.edu/EVS, or from own control alleles), we classified them as: not pathogenic; as a variant of unknown clinical significance; VUS1, unlikely to be pathogenic; VUS2, uncertain; or VUS3, likely to be pathogenic. Family information (co-segregation), phenotypic features and/or functional analysis are needed to classify a variant as (putatively) pathogenic. The protocol used for the classification of variants has recently been published by van Spaendonck-Zwarts et al 9 All variants of interest identified in our HCM and DCM group were confirmed by Sanger sequencing.
Results
Target enrichment and on-target percentage
We evaluated and optimised the ability of Roche NimbleGen 385K Custom Sequence Capture Arrays to enrich patient samples for every exon in a panel of 23 genes. The degree of enrichment for the captured samples was estimated by qPCR analysis of four control loci. The average relative enrichment for the four control loci was >100-fold for all samples sequenced. The on-target percentages, calculated as number of bases present on the targeted region divided by the total number of mapped bases, varied between 12.8% and 33.1%, using the standard sequence capture protocol. When calculating the ratio of mean base coverage of the 92.5 kb targeted region divided by the mean base coverage outside the targeted region (∼3 Gb), the enrichment factor is still 4720-fold and 16 046-fold respectively. A mean on-target percentage using the standard protocol was on average ∼20%. Although this is the equivalent of an enrichment factor of ∼8000-fold, it is still not high enough to sequence an acceptable number of patients at an acceptable base coverage on the GS-FLX Titanium. Therefore we introduced a second round of hybridisation of the same sample on the previously used capture array. This procedure increased the on-target percentage to 75–92% (an 80% on-target represents an enrichment factor of 129 729-fold). Base coverage was reproducible both within and between the experiments with 99.8% of the targeted sequence covered.
On-array multiplexing
The use of capture arrays gives a limitation in the number of samples that can be processed in a given time. Moreover, the costs of one capture array per sample are a significant part of the total costs of the entire procedure. Therefore, we used unique MIDs (bar coding) which are introduced during library preparation. After amplification and quantification of the individual libraries, equimolar mixtures of 5–10 patients were hybridised to one capture array according to the protocol. From that moment on the 5–10 patients were treated as one sample. After sequencing, the patients were separated based on their barcode and the variants were determined using the gsMAPPER (Roche) (figure 1). In general, 100K reads per patient within each multiplex experiment were sequenced. The difference in the number of reads per patient within a multiplexed sample usually was below twofold (75K to 150K reads per patient). Comparable number of reads per patient indicates that on-array multiplexing is feasible. Only occasionally a sample has less than half of the reads that was aimed for.
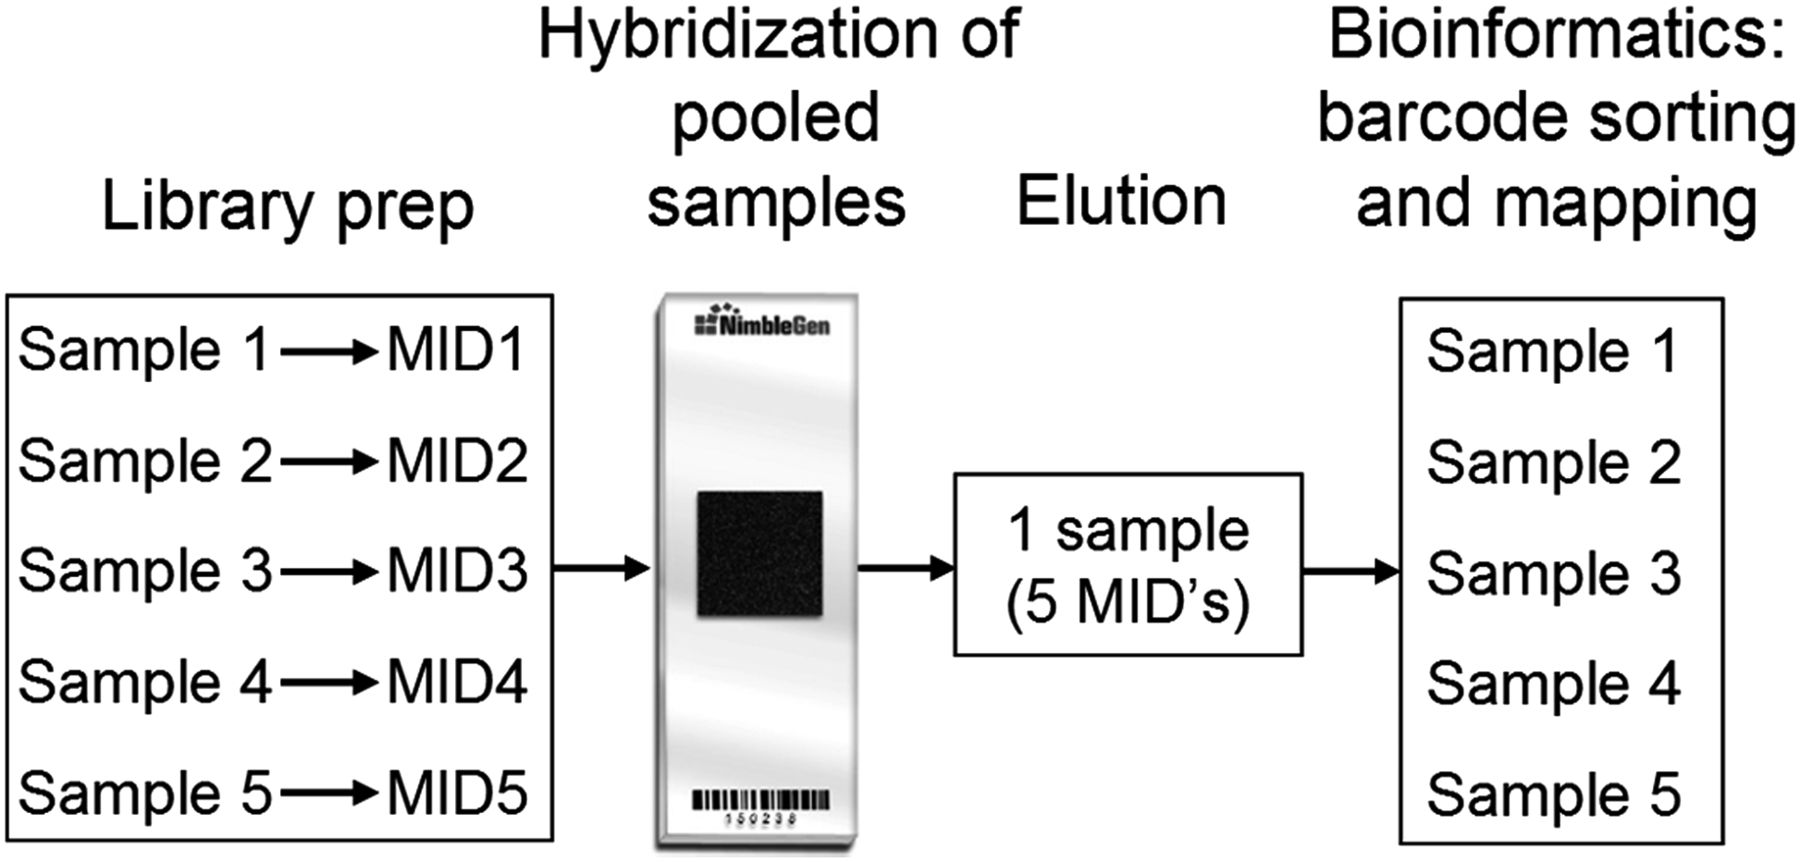
A schematic representation of an on-array multiplexed sequence capture experiment. After individual introduction of an unique bar code (multiplex identifiers) to each sample during the library preparation, all samples are mixed equimolarly and hybridised to one capture array. From that time on, the five multiplexed samples are treated as one sample during hybridisation, washes and elution as well as all post-capture steps including linker-mediated PCR, emulsion PCR and sequencing.
Proof of principle experiment
In a first proof of principle experiment we evaluated a custom design capture array (V1) to enrich patient samples for every exon of 18 genes with known involvement in cardiomyopathy (table 1). In this experiment we included five HCM patients with different known pathogenic mutations (two substitutions, a 2 bp deletion, and a 1 bp and 26 bp insertion,) in either the MYBPC3 or MYH7 gene. All five pathogenic variants (MYH7 c.1436A>C, MYH7 c.1207C>T, MYBPC3 c.2373_2374dup, MYBPC3 c.676_701dup26, and MYBPC3 c.2864_2865del) were detected with sequencing on the GS-FLX Titanium. The whole coding region including splice junctions were Sanger sequenced for at least the gene where a pathogenic mutation was identified in the above mentioned HCM patients. Therefore, direct comparison of all the variants (pathogenic and non-pathogenic) found with Sanger sequencing and GS-FLX Titanium sequencing was possible. This showed that 57 out of 57 (100%) variants were detected with GS-FLX Titanium sequencing. Fifty-three out of 57 variants were present in the HCDiff list whereas four out of 57 were present in the AllDiff list. Evaluation of the variants present in the AllDiff list showed that three out of four variants were variants at the same position (MYBPC3 c.1093-24C>T) and were not in the HCDiff list due to low coverage at the flank of the targeted region. The fourth variant (MYBPC3 c.2373dup) was present in a sufficient number of reads that were of good quality, so there was no clear reason why it was not present in the HCDiff list. Therefore, in all the following analysis also the variants present in the AllDiffs with a variant percentage >20% were extracted from the list.
Optimisation of exon coverage and addition of more genes
Exon coverage was determined for all 18 genes and all exons except exon 5 of PRKAG2 were enriched by the capture array. Coverage per exon varied significantly between genes but also within genes (figure 2A). The mean base coverage for the targeted bases was 38.3±14.8 (mean±SD) after a single hybridisation. Exons with coverage significantly below the mean coverage were rebalanced on the next design (V2) by adding more probes for poorly covered regions (both more identical and probes from the same region but at a different position were added). The number of probes added per target region was dependent on the coverage. After enrichment with this rebalanced capture array and sequencing the mean coverage per exon was calculated again. The mean base coverage for the targeted bases after a single hybridisation was 41.6±12.9 (mean±SD). Lower SD at a higher mean coverage implies a more even coverage when using the V2 array. In fact, exons that had a low coverage in the V1 array were more evenly distributed after enrichment with the V2 array (figure 2B). The missing exon from the V1 array (exon 5 of PRKAG2) was targeted in the V2 with seven times the standard amount of probes, but still this particular exon was not present in the reads. Evaluation of the characteristics of this region showed a high GC content of 76%. It is likely that during pre-capture and post-capture amplification there is poor amplification of this region and therefore it is not represented in the post-capture library. Since the on-target percentages were low we switched to a protocol that used a double hybridisation. After the second hybridisation the mean base coverage for the targeted bases was 62.8±42.3 (mean±SD). Introduction of a second hybridisation increased the on-target percentage drastically, however, the SD of the mean coverage also increased. In the next version of the capture array (V3), we performed an additional balancing step and added the coding exons of five more genes, resulting in targeting a total of ∼300 exons of 23 genes. The mean base coverage for the targeted bases was 97.6±44.7 (mean±SD). The percentage of bases covered at least once was 99.8% (only missed 90 bases of exon 5 PRKAG2: chr7:151329155-151329224). In the final version of the capture array (V4) we have rebalanced the final five genes. The mean base coverage for the targeted bases was 103.7±35.9 (mean±SD). With the last design there was an average of 1.64 fragment per patient that had one or more bases at <16× coverage and therefore needed to be analysed with a Sanger reaction. This represents an average of 0.36% of the analysed bases.
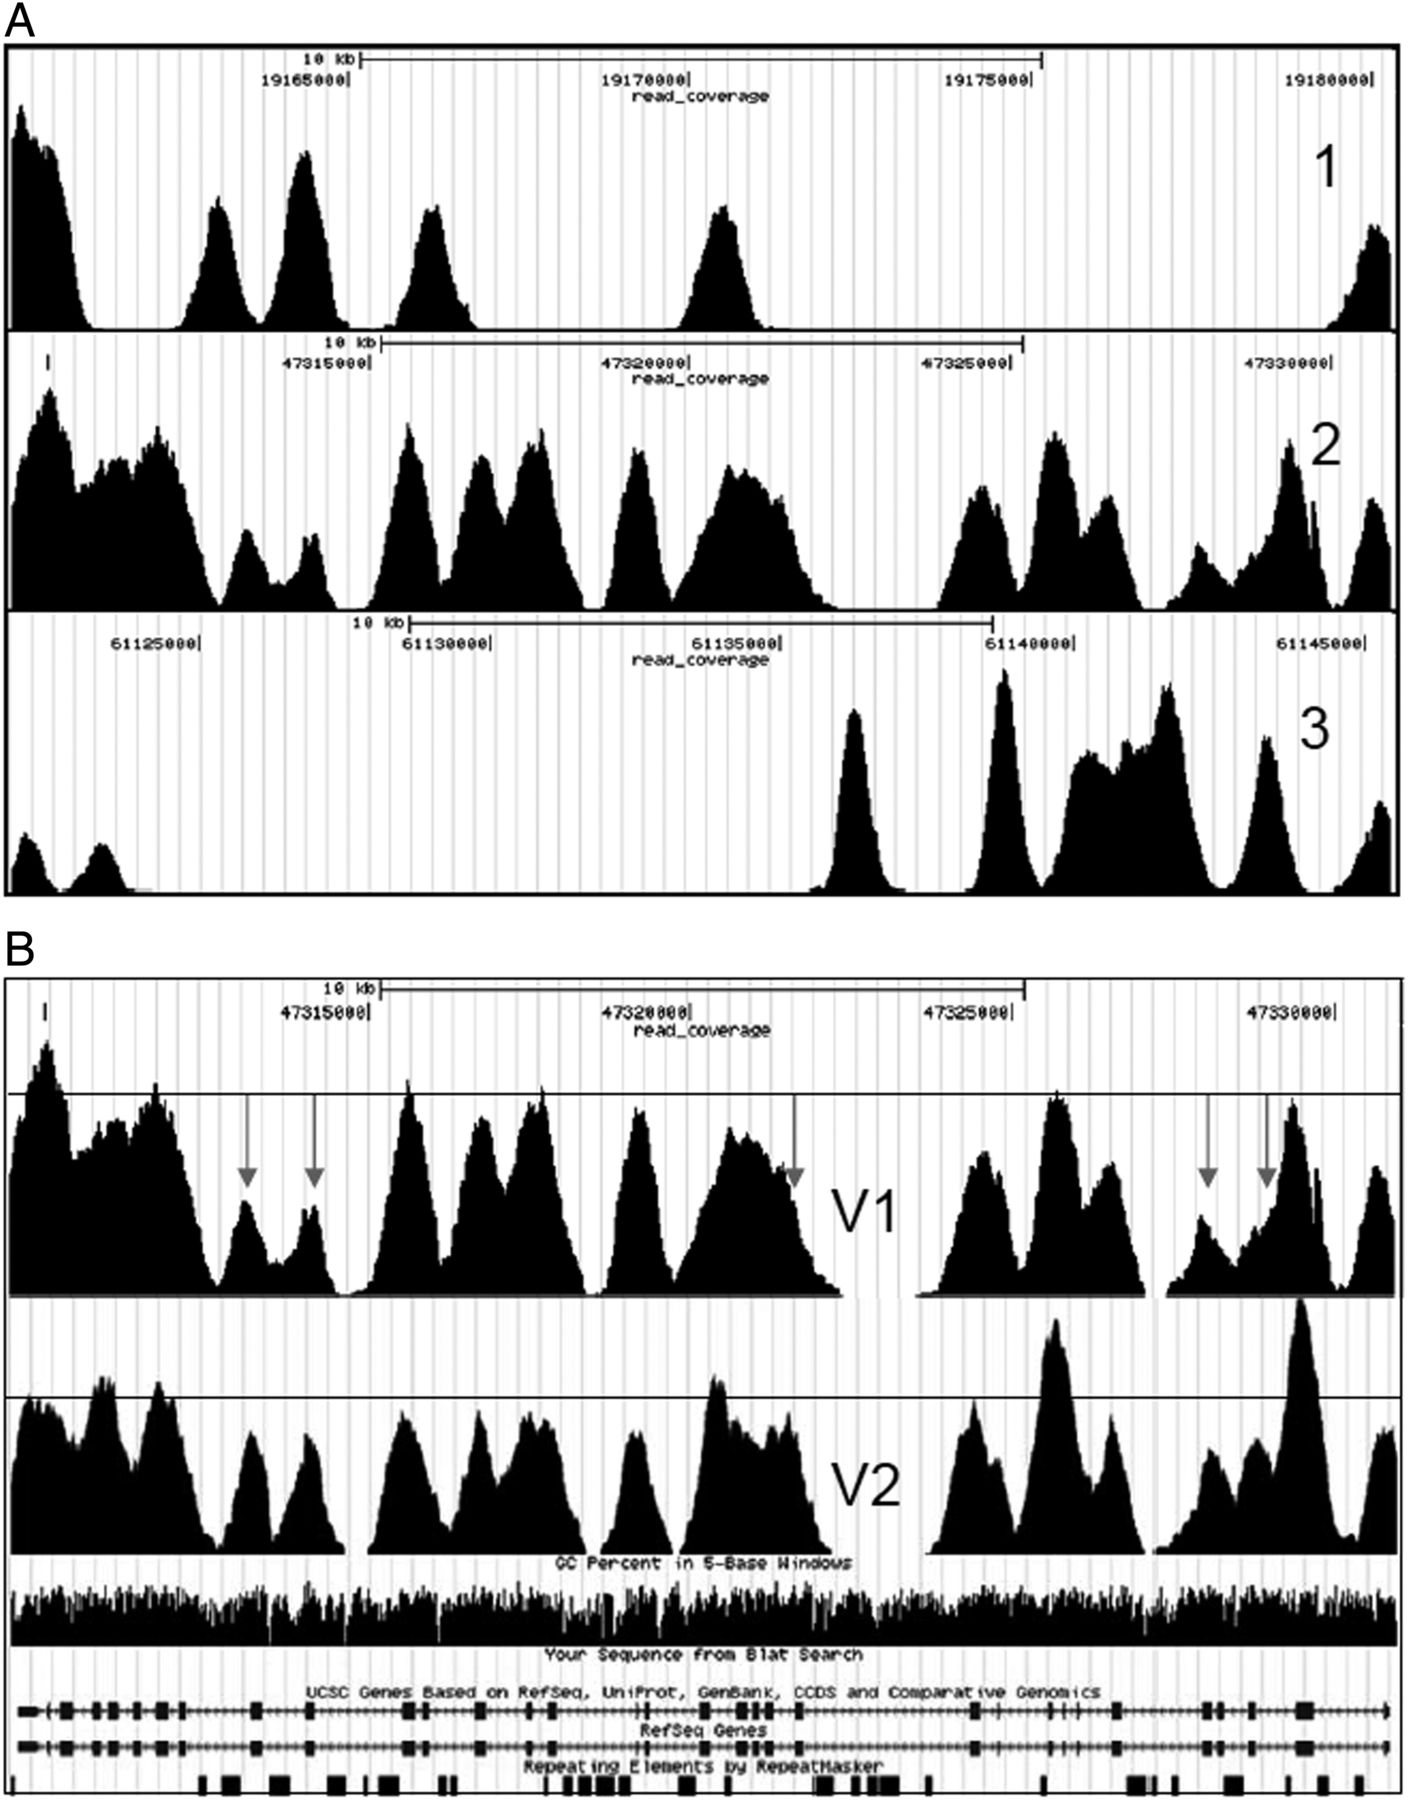
Representative example of a gene with even exon coverage (1), intermediate exon coverage (2), and uneven exon coverage (3) before rebalancing of the capture array (A) and exon coverage distribution before (V1) and after (V2) rebalancing of the capture array (B). Note that poorly covered exons or exon flanks (arrows) are far below the average coverage (horizontal line) before rebalancing. After rebalancing exon coverage is far more uniform.
When comparing double hybridisation on the V2 array with the V4 array (mean±SD 62.8±42.3 vs 103.7±35.9) it clearly shows improved performance due to design optimisation.
Screening of DCM patients already seen in diagnostics but no mutation found
Seventeen patients diagnosed with DCM and two patients with a DCM family history were selected for screening of the genes present on the V2 and V3 arrays. In 10 out of 19 patients we found variants with different probability of pathogenicity (for more details see table 2). Two variants, the PLN c.40_42del and the MYH7 c.415G>T, were both observed twice in unrelated patients, with one patient having two variants (MYH7 c.415G>T+LAMP2 c.661G>A). All the other variants were present solitary. All the variants present in TNNI3, EMD, SCN5A, MYH7, and LAMP2 were not observed in all the previously tested probands for these genes. The variant present in PLN has been reported as pathogenic10 ,11 and is a well-known founder mutation in the Netherlands. One of the two variants in SCN5A (NM_198056.2 : c.4859C>T) has been reported previously.12–16 The variant in LDB3 has not been found in 200 HCM/DCM/non-compaction cardiomyopathy patients screened in Erasmus Medical Center, Rotterdam (personal communication).
Clinical parameters and variants found in DCM patients
Comparison of variants found with Sanger sequencing and GS-FLX Titanium sequencing in HCM patients
In order to make a side by side comparison between variants that were found with Sanger sequencing and variants that were found by GS-FLX Titanium sequencing, we have selected nine patients diagnosed with HCM but with no pathogenic mutation identified. In these patients, all the coding exons of the genes offered for DNA diagnostics (MYBPC3, MYH7, MYL2, MYL3, TNNI3, TNNT2, TPM1, and GLA genes) were already analysed with dHPLC and/or Sanger sequencing. Within the targeted region of the V3 capture array, 258 variants were detected with dHPLC and/or Sanger sequencing. Of these 258 variants, three were variants of unknown clinical significance (TNNT2, c.877C>T,20 ,21 TPM1, c.755A>G and MYBPC3, c.3392T>C22), while the others were non-pathogenic coding and non-coding variants. These variants served as positive control in the direct comparison of Sanger sequencing versus GS-FLX Titanium Roche sequencing. Evaluation of the variants present in the HCDiff and AllDiff lists showed a total of 262 variants. From the 258 variants that were potentially detectable, one variant (MYL2 c.353+46dup) was missed in two patients by the GS-FLX Titanium. This means six additional variants (one heterozygote and five homozygotes) were found with GS-FLX Titanium sequencing, but not with dHPLC. All additional variants were confirmed with Sanger sequencing. This results in a detection rate of 101.6%, compared to the dHPLC and/or Sanger sequencing. If one excludes the missed variants by the dHPLC, 258 variants were potentially detectable. From these, 256 were found in either HCDif or AllDiff, while one variant (MYL2, c.353+46dup) was missing in two patients resulting in a corrected detection rate of 99.2%. It should be noted that all the other 48 known non-coding indels of different lengths were detected correctly.
On top of the known variants and putative mutations we also found two additional amino acid changes from which one also introduced a potential splice site loss in genes that were not analysed before. These variants are VCL: NM_014000.2: c.1543G>A (amino acid change and loss of splice site), LDB3: NM_007078.2: c.566C>T. We classified them as VUS2 (see table 3).
Clinical parameters and variants found in HCM patients
Side by side comparison of GS-FLX Titanium sequencing and Sanger sequencing in 30 index patients
Finally, the fully optimised capture array (V4) was used for a second direct comparison in 30 HCM index patients by comparing the seven genes (MYBPC3, MYH7, TNNT2, TNNI3, TPM1, MYL2, and MYL3) sequenced with both Sanger sequencing and GS-FLX Titanium sequencing. From the 319 variants present, a total of 317 variants were detected with Sanger sequencing and 318 with GS-FLX Titanium sequencing. One variant was not detected with GS-FLX Titanium sequencing (MYL2: NM_000432.3: c.353+20delG) and two variants were not detected with Sanger sequencing (MYH7: NM_000257.2 c.1231G>A and MYH7: NM_000257.2: c.2967T>C). Re-examination of these two variants by Sanger sequencing confirmed both variants. Re-evaluation of the original traces also showed the two variants but they were not picked up due to high background. Also, here it must be noted that the other 51 known indels were detected with GS-FLX Titanium sequencing. This represents a sensitivity of 317/319 (99.4%) and 318/319 (99.7%) for Sanger sequencing and GS-FLX Titanium sequencing, respectively.
In the 30 patients we found 26.7±5.8 (mean±SD) variants per patient. From these, 17 variants (0.57±0.77, mean±SD) have varying probabilities of pathogenicity. These include variants in genes routinely screened with Sanger sequencing—that is, MYH7: NM_000257.2: c.1178C>T,26–28 c.1231G>A,29–32 c.2002C>A, c.5135G>A, c.1987C>T, c.121G>A and MYBPC3: NM_000256.3: c.2827C>T,33 c.3004C>T (twice), c.2864_2865del, MYL2: NM_000432.3: c.37G>A34–37 and TPM1: NM_000366.5: c.618A>G, but also in genes that are part of the additional genes in the NG cardiomyopathy panel—that is, SCN5A: NM_198056.2: c.3157G>A38 ,39, PRKAG2: NM_016203.3: c.253C>T, TCAP: NM_003673.2: c.37_39del,40 ,41 CSRP3: NM_003476.3: c.10T>C42 ,43, LMNA: NM_170707.2: c.1804G>A,44 ,45 DES: NM_001927.3: c.935A>C (table 4). Ten patients had a single variant, two patients had two variants each (MYH7: NM_000257.2: c.1178C>T combined with SCN5A: NM_198056.2: c.3157G>A, and MYBPC3: NM_000256.3: c.3004C>T combined with LMNA: NM_170707.2: c.1804G>A), and one patient had three variants (MYH7: NM_000257.2: c.121G>A, MYBPC3: NM_000256.3: c.3004C>T, and DES: NM_001927.3: c.935A>C). All variants were confirmed with Sanger sequencing.
Clinical parameters and variants found in index patients
Discussion
In the present study we show the feasibility of array based target enrichment of 23 HMC and DCM genes combined with NGS for diagnostic mutation screening in HCM/DCM patients. The use of DNA bar codes enabled pre-capture multiplexing, a step essential for increasing throughput and reducing the costs of analysis.46 This approach not only enables the simultaneous and comprehensive investigation of multiple target genes but also facilitates the analysis of multiple samples in parallel. We have developed an optimised capture array that is at least as sensitive as the current standard, Sanger sequencing. For HCM, the current capture array analyses three times more genes as compared with the current Sanger sequencing panel within the same turn-around time. Screening of more genes results in a higher diagnostic yield. For DCM patients, but not for HCM patients, we have developed a similar assay for TTN. This enables us to screen TTN on top of the 23 reported genes only for DCM patients.
We and others have shown that NGS technologies are on the verge of being broadly used in clinical laboratories. It is very likely that these new technologies will replace traditional (Sanger sequencing based and array based) sequencing tests for genetically heterogeneous disorders like HCM/DCM.
Targeted exome massively parallel sequencing has great potential for both research and clinical use. However, sequencing of the entire exome for diseases with ‘limited’ numbers of genes to be investigated is not practically feasible yet due to relatively high costs, variable depth of exon coverage, the extent of data analysis, and data storage. To overcome these problems, sequence capture based target enrichment for a limited number of genes followed by NGS can be an approach that is logistically and financially feasible.
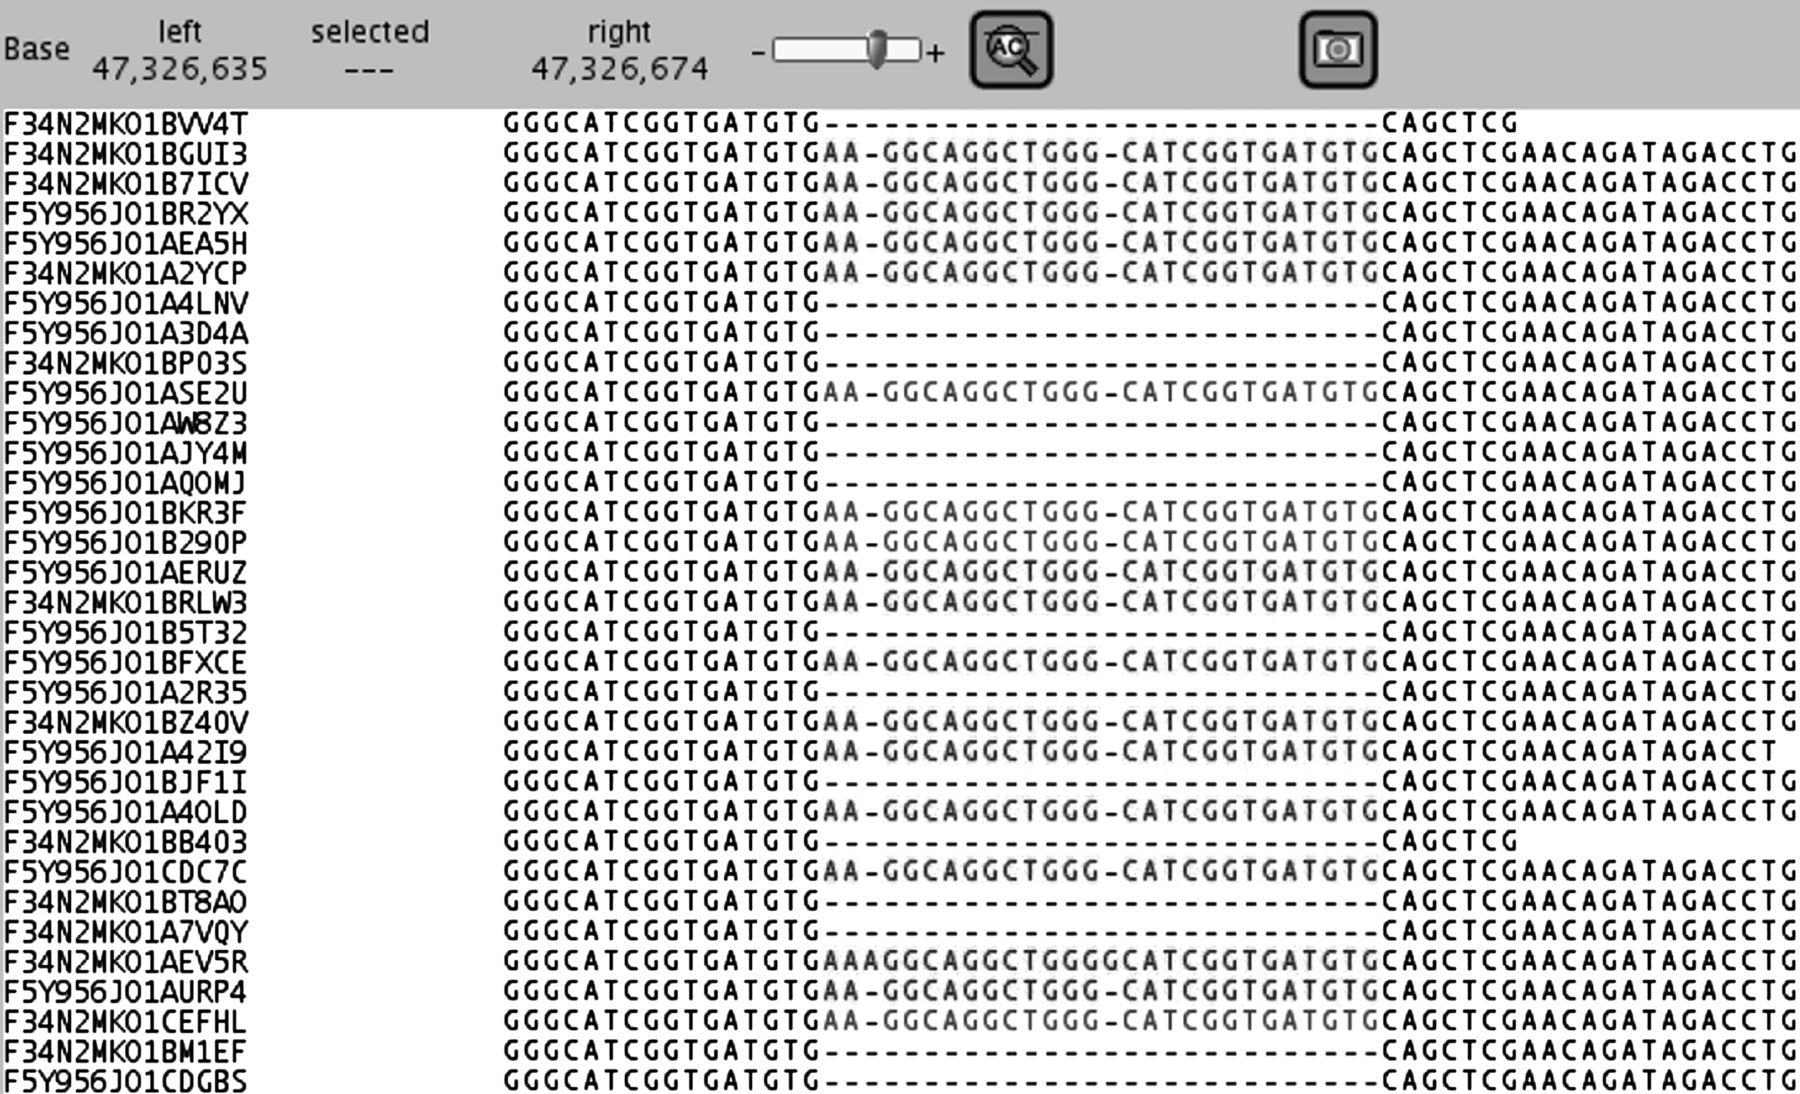
Our first pilot study with five HCM patients with known pathogenic mutations showed that array based target enrichment and NGS could easily detect different types of known mutations (substitutions, insertions and deletions) and numerous non-pathogenic variants already detected with Sanger sequencing. All 57 variants detected with Sanger sequencing were also found with GS-FLX Titanium sequencing, including a coding 26 bp insertion in the MYBPC3 gene (figure 3). Because we detected 100% of the variants present in five HCM patients we proceeded with testing of additional patients. Nevertheless, in this pilot study we have observed that exon coverage varies significantly within one sample (determined by array design) resulting in lower confidentiality of particular variants (eg, MYBPC3: NM_000256.3: c.1093-24C>T). A balanced representation of all targeted exons would reduce the average coverage needed to detect variants with high confidentiality, consequently lowering the false negative rate. Therefore, we have designed arrays with a more balanced coverage as has previously been proposed by others.47 ,48 The rebalanced capture array has been used to analyse nine HCM patients and 19 DCM patients. The rebalanced design showed that 99.80% of the targeted coding bases were covered at least once and 99.64% at least 16×. We and others8 have calculated that at 15–16× coverage a 99% sensitivity is obtained. This means that for an experiment with a mean coverage of 100±35× the statistical chance that a variant is missed in a patient is 0.004% (for calculation see supplementary figure S2).
Mapping of a coding 26 bp duplication in a hypertrophic cardiomyopathy patient. In contrast with short read platforms, a heterozygous insertion of 26 bp is easily mapped and reported.
The bases with low coverage were exon 5 from PRKAG2 (NM_016203.3) in all patients and exon 2 from LAMP2 (NM_002294.2) in about half of the patients. This is likely due to a high GC content, a phenomenon observed before.49 In the current test these exons are analysed by standard Sanger sequencing.
From the nine HCM patients the HCM gene panel had been analysed with Sanger sequencing. In these patients 99.2% of the present variants were detected with GS-FLX Titanium sequencing. The two undetected non-coding variants (identical in two individuals) were both times a single nucleotide insertion present in a region with multiple homopolymer stretches of four to six nucleotides. Variant detection and in particular indels in homopolymer stretches is a known problem with pyrosequencing due to incorrect base calling in these regions.50 In our datasets it has become clear that homopolymer stretches up to 5-mers are generally called properly, while 6-mers and more in general result in improper base calling. Screening all coding regions for ≥6-mers showed 17 exons with ≥6-mers. For diagnostic purposes, these exons are analysed by Sanger sequencing until better base calling algorithms are available.
Apart from the variants present in the already used gene panel, numerous additional variants were found in the genes that were not Sanger sequenced previously. Two variants (indicated in bold), which both result in amino acid changes (one amino acid change also predicts a splice site loss) (table 3), are of possible clinical significance. The variant in LDB3 has been reported before 23–25 while the VCL variant is novel.
In the DCM panel we detected 11 potentially pathogenic mutations in 10 individuals. The genes involved are MYH7 (three mutations), TNNI3 (one mutation), PLN (two identical mutations), LAMP2 (one mutation), LDB3 (one mutation), EMD (one mutation), and SCN5A (two mutations) (for details see table 2). The variant in TNNI3, PLN, and SCN5A have already been reported in the literature,10 ,11 ,17–19 and all other variants are novel. Identification of additional variants in both HCM and DCM patients shows an increase in diagnostic yield upon extension of the gene panel sequenced.
Finally, we evaluated 30 index patients in parallel with Sanger sequencing. In these experiments we especially focused on the diagnostic value of this approach. In 10 patients a single potentially pathogenic variant was found, in two patients two potentially pathogenic variants were found, and in one patient three potentially pathogenic variants were identified. From the 17 variants 11 were in the genes regularly screened with Sanger sequencing, and six were found in genes that were additionally screened due to GS-FLX Titanium sequencing (table 4). This shows that the clinical sensitivity can be increased by the addition of extra genes. In this experiment we were able to compare directly the sensitivity of Sanger sequencing and GS-FLX Titanium sequencing. Sensitivity of GS-FLX Titanium sequencing was at least as good as that of Sanger sequencing (99.7% vs 99.4%, respectively), showing that GS-FLX Titanium sequencing can replace Sanger sequencing in a diagnostic setting.
Small insertions and deletions (1–50 bp) represent the second most frequent class of variation in the human genome after SNPs.51 Throughout all the experiments described here we have particularly focused on the detection of indels. Two non-coding variants (MYL2 c.353+20 and c.353+46) were not reported in the GS-FLX Titanium variant list. Both variants are present in a region with multiple homopolymer stretches of four to six nucleotides, likely the underlying reason for improper variant calling. Nevertheless, the other 106 indels present in this study were called properly. In fact, pathogenic mutations caused by an insertion of a G nucleotide, deletion of CT nucleotides, deletion of AGA nucleotides, as well as an insertion of 26 bases were called correctly. Furthermore, multiple known non-coding indels like insertion of a C nucleotide, deletion of a C nucleotide, insertion of AC nucleotides, deletion of CTTCT nucleotides, insertion of ATTTT nucleotides, insertion of ATTTTGTTTT nucleotides, and insertion of ACAG nucleotides were all detected in these patients.
In conclusion, we have shown that on-array multiplexed sequence capture in combination with GS-FLX Titanium sequencing is suitable for reliable variant detection (sensitivity of 99.7%) and will increase clinical sensitivity in cardiomyopathy patients. To date, NGS is used as a research tool with high confidence and ease. In the present paper we demonstrate that due to continuing improvements in throughput, accuracy, cost and ease of data analysis, it has become feasible to apply NGS in a diagnostic setting.
References
Supplementary materials
Supplementary Data
This web only file has been produced by the BMJ Publishing Group from an electronic file supplied by the author(s) and has not been edited for content.
Files in this Data Supplement:
- Data supplement 1 - Online figures
Footnotes
MAH, J-FS and JBAM contributed equally.
-
Contributors All authors included on the paper fulfil the criteria of authorship, as they contributed to the study conception and design, acquisition of data, or analysis and interpretation of data, drafting the article or revising it for intellectual content, and approving the final version submitted. In addition, ORFM designed the study and experimental set-up, performed the experiments, analysed data, and wrote the paper. RHLD and MMAMM designed the study, analysed data, and wrote the paper. FB designed the experimental set-up. J-FS analysed data and contributed to drafting the manuscript. JvM contributed to the study design and drafting of the manuscript. NH and IC contributed to identification and selection of patients. MAH performed the experiments and developed the bioinformatical analysis. MEJ performed the experiments.
-
Competing interests None.
-
Patient consent Obtained.
-
Provenance and peer review Not commissioned; externally peer reviewed.