Article Text

Abstract
Objective: To ascertain time trends in rates of hospital admission, operations, in-hospital case fatality and general mortality for congenital heart disease (CHD) in England and Wales.
Design: Retrospective analysis of Hospital Episodes Statistics for England (April 1995 to March 2004) and mortality statistics for England and Wales (1994–2003).
Population: All NHS patients admitted with a primary diagnosis of CHD to hospitals in England, and all deaths in England and Wales with an underlying cause of CHD.
Main outcome measures: Age-standardised hospital admission rates, case fatality rates and death rates from congenital heart disease.
Results: Between 1995/1996 and 2003/2004 the age-standardised hospital admission rate for CHD increased from 30.7 per 100 000 (95% CI 29.9 to 31.4) to 35.5 per 100 000 (95% CI 34.7 to 36.4) in men and boys and from 28.2 per 100 000 (95% CI 27.4 to 28.9) to 32.8 per 100 000 (95% CI 32.0 to 33.6) in women and girls. Between 1997/1998 and 2003/2004 in-hospital case fatality rates fell from 2.10% (95% CI 1.97 to 2.22) to 0.83% (95% CI 0.74 to 0.92). Population mortality fell steadily over the decade from 1994 to 2003 in men and women, with the largest proportionate decrease in the 1–4-year age group.
Conclusion: Admission rates for CHD have increased over the past decade, particularly amongst patients in older age groups. There has also been a significant decrease in both in-hospital case fatality rates and in general population mortality rates. These trends are consistent with improvements in the quality of care for these patients, improvements in survival and the predicted expansion in the number of adults living with CHD.
- congenital heart disease
- hospital admissions
- mortality
- time trends
Statistics from Altmetric.com
Congenital heart disease (CHD) is one of the most common forms of congenital anomaly in the UK,1 affecting between five and eight live births in every 1000.2–4 As a group, cardiovascular malformations account for a large proportion of all congenital anomaly deaths – over 40% in 2003.5 Around three-quarters of all congenital heart defects diagnosed in childhood are recognised by the age of 1, and a further 18% are diagnosed between the ages of 1 and 4.6 A small proportion of structural and/or valvular defects present later on in adulthood.7
The incidence of CHD is thought to have remained relatively stable over the past 50 years. In their review of more than 60 studies of CHD incidence published since 1955, Hoffman and Kaplan found no evidence for a change in the incidence of heart defects over time, after taking into account variations in case definition and methods of ascertainment between studies.2 The past half century has also seen dramatic improvements in survival from CHD owing to major developments in the diagnosis and management of CHD.6 8 9 More than 85% of people born with a heart defect are now expected to survive to adulthood.10 A reduction in postoperative mortality following paediatric cardiac surgery has also been reported nationally.11 12 On the basis of these trends, experts predict a substantial increase in the number of adults living with CHD.6 13–15 The British Cardiac Society Working Party’s report on CHD in adults estimates that, between 2000 and 2010, the number of people aged 16 years and over living with CHD in the UK will increase by 25%.15
Whilst there has been intense study and scrutiny of paediatric CHD in recent years following the Bristol Inquiry,16 there is a dearth of population-level data on the management of and outcomes for older patients with CHD and few studies have examined the overall mortality burden at a national level.17 Most studies of CHD-associated mortality or survival have tended to focus on populations living in particular geographic regions,6 18 or undergoing surgical interventions at specialist centres.10 19
Analysis of hospital admissions data and national mortality statistics can go some way towards filling this gap. National trends in mortality due to CHD, particularly in the context of a relatively stable disease incidence over time, may tell us something about changing patterns of survival and quality of health care provision for this population of patients. In this article, we examine trends in hospital admissions, operation and case fatality rates for CHD between 1995/1996 and 2003/2004 in England, and trends in overall mortality due to CHD between 1994 and 2003 in England and Wales.
METHODS
Hospital episode statistics
The Hospital Episode Statistics (HES) database holds data for England on the care provided by NHS hospitals (including to patients treated privately) and for NHS hospital patients treated elsewhere. Private hospitals are not covered. For the 2003/2004 financial year, HES collected over 13 million records detailing episodes of inpatient treatment delivered by NHS hospitals.20
From April 1995, HES data have been coded using the International Classification of Diseases 10th revision (ICD-10). All operations and procedures recorded within HES are coded using the Office of Population Censuses and Surveys list of surgical operations and procedures, fourth revision (OPCS4). The “main operation” is the first recorded and is normally the most resource-intensive procedure. This study examines admissions for CHD, and the main operations performed in relation to those admissions.
The HES records included in this study are finished consultant episodes (FCEs). Each FCE details a continuous period of care under a specific consultant at a single provider that ends in internal transfer, discharge or death. If, during a spell of treatment, a patient is transferred to another consultant and/or to a different provider, a new FCE record will be generated. The first FCE during an admission spell can be used as a proxy measure for the number of admissions.
Hospital admission rates
Data on all inpatient and day case admissions in which CHD was recorded in the primary diagnosis field were obtained for analysis. Data were obtained for each financial year between 1995/1996 and 2003/2004. Admission rates were calculated using these data and mid-year population estimates for England. As admissions data are presented in financial years (April to March), and population estimates in calendar years, the population estimates for the year overlapping 9 months of the financial year were used. To allow comparison over time and between sexes, directly age-standardised rates were calculated using the European Standard population.
Operation rates
For patients admitted with a primary diagnosis of CHD, data on all operations and procedures performed during their first FCE were also obtained. The proportion of admissions in which the main operation was either on the heart or on the veins and arteries was calculated by age and sex. Direct age standardisation was performed, taking the population of hospital admissions for CHD in 2003/2004 as the reference population. The proportion of admissions in which the main operation fell into one of 13 broad procedure groups was also examined. These 13 procedure groupings were developed as part of a previous analysis of HES data for the Bristol Inquiry by Aylin et al.21 As shown in table 1, the majority map onto the procedure categories used by the UK Cardiac Surgical Register.
Directly age-standardised operation rates for each procedure grouping were calculated, using the population of hospital admissions for CHD in 2003/2004 as the reference population.
In-hospital case fatality rates
For patients admitted with a primary diagnosis of CHD, deaths occurring in any FCE within the admission spell were identified. Using the unique HES patient identifier (available for the years 1997/1998 onwards), any duplicate recordings of death for individual patients in successive FCEs were removed. Case fatality rates were calculated as the percentage of admissions ending in death. Age-standardised rates were also calculated, using all hospital admissions for CHD in 2003/2004 as the standard population.
Mortality rates
Mortality statistics for England and Wales were obtained from the Office for National Statistics. These are recorded in calendar years and were coded using ICD-9 from 1979 to 2000 inclusive and ICD-10 from 2001 onwards (table 2). All deaths with an underlying cause of CHD were identified for the years 1994–2003.
Age and sex-specific mortality rates were calculated using ONS mid-year population estimates for England and Wales for the relevant years as denominators. Death rates were directly standardised using the European population.
RESULTS
Hospital admissions
The total number of hospital admissions with a primary diagnosis of CHD increased from 12 866 in 1995/1996 to 14 109 in 2003/2004, a 9.7% increase.
Age-standardised rates of hospital admission for a primary diagnosis of CHD increased in men and boys from 30.7 per 100 000 (95% CI 29.9 to 31.4) in 1995/1996 to 35.5 per 100 000 (95% CI 34.7 to 36.4) in 2003/2004 (table 3). Similarly in women and girls there was a statistically significant increase in age-standardised rates of hospital admission for CHD over that time period. Rates rose from 28.2 per 100 000 (95% CI 27.4 to 28.9) in 1995/1996 to 32.8 per 100 000 (95% CI 32.0 to 33.6) in 2003/2004.
In each year between 1995/1996 and 2003/2004, the number and rate of hospital admissions were higher for men and boys than for women and girls. This difference was significant in all years except 1999/2000 and 2002/2003.
Rates of hospital admission have remained relatively stable in children aged under 1. In all other age groups, rates of hospital admission have increased over time. The greatest proportionate increase in both sexes was in the 45–64 year age group.
In absolute terms, about one-third of all admissions with a primary diagnosis of CHD are accounted for by children under 1 year of age, although this proportion has been declining steadily over time. In 1995/1997, 38.7% (95% CI 37.9% to 39.5%) of all admissions were in children under 1, compared with 32.4% (95% CI 31.6% to 33.1%) in 2003/2004. Correspondingly, the proportion of admissions for CHD accounted for by persons aged 25 years and over has increased from 21.5% (95% CI 20.8% to 22.2%) in 1995/1996 to 27.3% (95% CI 26.6% to 28.0%) in 2003/2004. (See online supplementary data.)
Operation rates
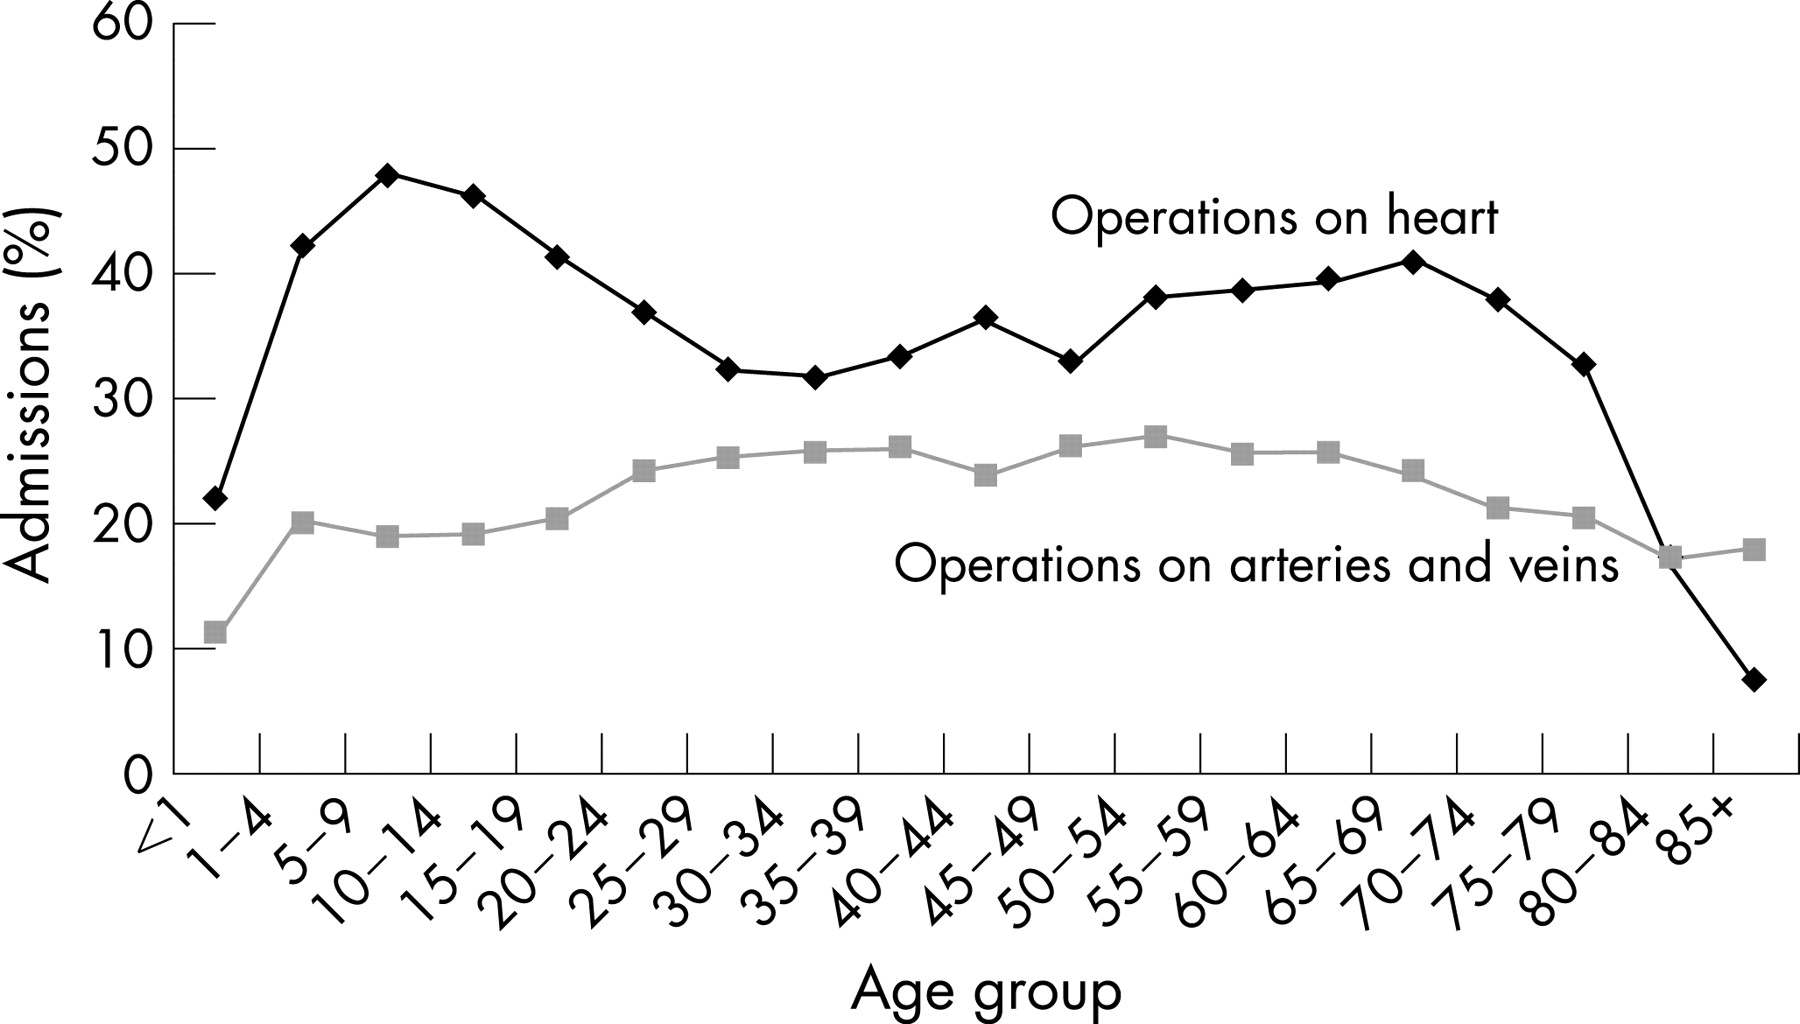
A procedure on the heart (OPCS4 codes K01 to K71) was performed as the main operation in 4886 (34.6%) admissions with a primary diagnosis of CHD in 2003/2004. In 2660 (18.8%) admissions for CHD, the main operation involved a procedure on the veins and arteries (OPCS4 codes L01–L97).
Figure 1 shows the age-specific rates of main operation on the heart and on the arteries and veins, in patients admitted with a primary diagnosis of CHD. Rates are based on pooled data for the years 1995/1996 to 2003/2004.

Rates of operation on the heart rise to a sharp peak in the 5–9-year age group, fall in later adolescence and young adulthood and then steadily rise to a second peak in the 65–69-year age group. The lowest operation rates on the heart are seen in the very old age groups (80 years and above). Rates of operation on the arteries and veins exhibit a different pattern. Rates are lowest in the very young, rising to a peak in middle age, and then gradually declining in the older age groups.
Operations in procedure groups
Operations in the 13 procedure groupings were performed as the main operation in 1829 (13.0%) admissions for CHD in 2003/2004. Of the 13 procedure groups, closure of secundum and sinus venosus atrial septal defects (group 6) were by far the most frequently performed main operation in the period 1995/1996 to 2003/2004. The second most common group of procedures was closure of ventricular septal defects (group 7) (see table 4).
Age-specific rates of operation for all procedures in the 13 procedure groupings exhibit a broadly similar pattern to age-specific operation rates for all heart procedures, as seen in fig 1. (See online supplementary data.)
Trends in the age-standardised rate of operation for each of the 13 procedure groupings are shown in table 4. Between 1995/1996 and 2003/2004 the largest proportionate increase in the age-standardised operation rate was in Fontan-type procedures (group 9), although this represents an absolute increase in procedure numbers of just 47. The largest proportionate decrease was seen in group 2 (interatrial transposition of the great arteries), although the absolute decrease in procedure numbers was again small,11 reflecting the small total number of procedures.
Case fatality rates
The absolute number of deaths in patients admitted with a primary diagnosis of CHD fell from 295 in 1997/1998 to 221 in 2003/2004. Deaths in the under-1-year age group account for 65% or more of all deaths in each year of the study.
There has been a statistically significant decrease in age-standardised case fatality rates amongst persons admitted with a primary diagnosis of CHD over the period of the study. The age-standardised case fatality rate fell from 2.20% (95% CI 2.06 to 2.34) in 1997/1998 to 1.57% (95% CI 1.44 to 1.69) in 2003/2004. (See online supplementary data.) This decrease in case fatality has not been confined to children under 1 year of age but is evident across all age groups, as shown in table 5.
Population mortality rates
The number of deaths with an underlying cause of CHD fell from 716 in 1994 to 540 in 2003. In 2003, 107 (19.8%) of the 540 deaths due to CHD were in children under 1 year of age. These 107 deaths accounted for 3% of all deaths in infancy.
The proportion of deaths due to CHD that occur in children under 1 has remained relatively stable over the past decade (see fig 2). The proportion of deaths in children aged 1–9 fell from 14.4% in 1994 to 7.8% in 2003. The proportion of deaths occurring in adults aged 25 years and over has increased. Deaths in adults aged 45 years and over accounted for 43.1% of all CHD deaths in 2003, compared with 39.1% in 1994.

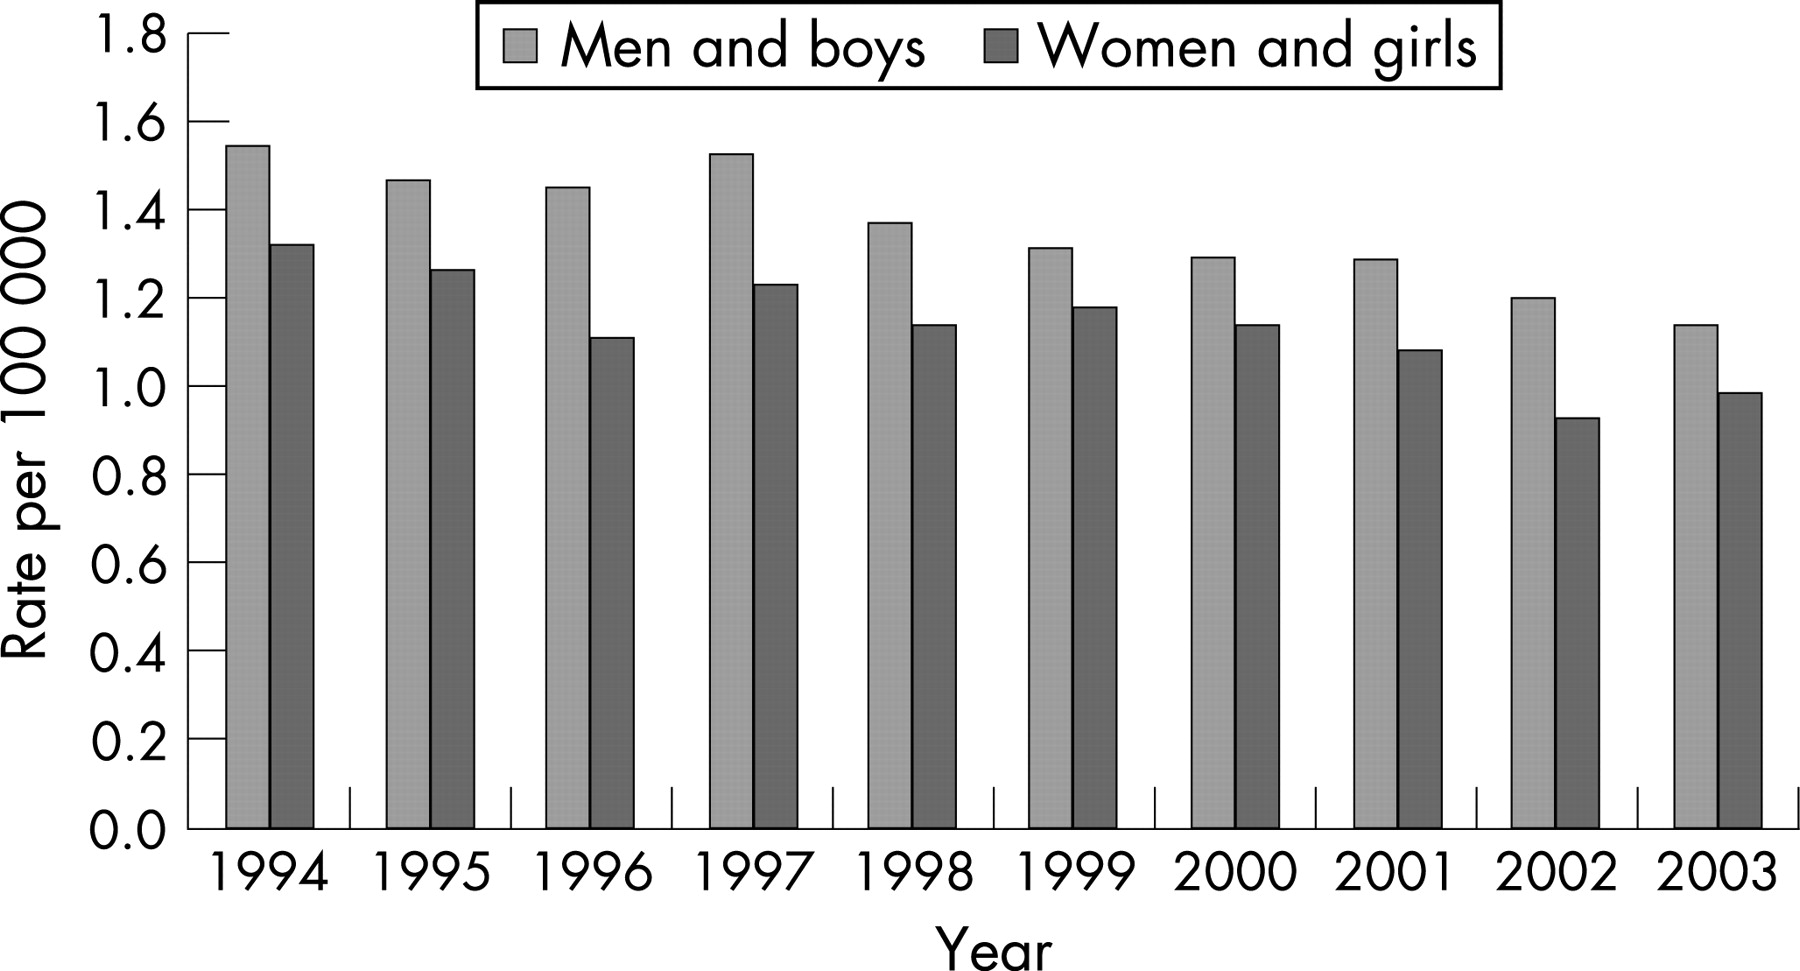
There has been a statistically significant decrease in age-standardised mortality rates for CHD between 1994 and 2003 (table 6). Age-standardised death rates fell by around 26% both in men and boys and in women and girls over this time period. Looking at age-specific death rates, the decline in mortality is apparent across all age groups. The largest proportionate decrease in mortality in both sexes was in the 1–4-year age group, followed by the 5–14-year age group.
As figure 3 shows, age-standardised death rates have been higher in men and boys than in women and girls for the entire period from 1994 to 2003, although since 1999 the difference in rates has not been statistically significant.

DISCUSSION
Principal findings
This is the first study to examine national time trends in hospital admission rates, case fatality rates and population mortality rates for CHD. Our study shows a rise of 16% in the age-standardised rate of hospital admission for CHD between 1995/1996 and 2003/2004. Hospital admissions amongst children under 1 have remained relatively stable over the period of the study. The largest proportionate increase in admissions has been amongst adults (in particular adults aged 45–64 years). Nevertheless, children under 5 continue to account for half of all admissions to hospital with a primary diagnosis of CHD.
In just over one-third of patients admitted with a primary diagnosis of CHD, an operation on the heart is recorded as the main operation. There is wide variation in operation rates on the heart with age. Rates peak at just under 50% in children aged 5–9 years, fall off again in adolescence and young adulthood, and rise to a second, slightly lower peak in middle age. A lower proportion of admissions (19%) undergo a main operation on the veins and arteries. Rates of operation on the veins and arteries are highest in middle-aged patients. Of the 13 more specific procedure groups examined, closure of atrial septal defects and closure of ventricular septal defects were the two most commonly performed groups of procedures between 1995/1996 and 2003/2004.
Case fatality rates in patients admitted with a primary diagnosis of CHD have fallen by 29% between 1995/1996 and 2003/2004. Decreases in in-hospital mortality have occurred across all age groups, and not just in children.
With respect to overall mortality, the absolute number of deaths with an underlying cause of CHD decreased by 25% between 1994 and 2003, whilst the age-standardised death rate from CHD has declined by 26% over this decade. Deaths in adults aged 45 years and over now account for more than 40% of all deaths due to CHD. Between 1994 and 2003 the largest proportionate decline in age-standardised death rates occurred in children aged between 1 and 4 years. Mortality rates from CHD were consistently higher in men and boys than in women and girls over the period of the study.
Strengths and weaknesses of the study
The principal limitation of this study relates to the quality of HES data. The accuracy and completeness of hospital admissions coding is known to vary over time and by hospital, and this inevitably introduces errors into the calculation of hospital admission rates, operation rates and case fatality rates. We used first FCEs with a primary diagnosis of CHD as a proxy for admissions. Episodes of care in which CHD was coded as a secondary or other non-primary diagnosis were not included in the study. Whilst this focus on primary diagnoses is an approach commonly employed in analyses of hospital admissions, concerns regarding the quality of diagnostic coding in CHD, particularly for adult patients, mean that our findings should be interpreted with caution. Compared with childhood admissions, adults may be less likely to have CHD coded as their primary diagnosis, either because of the general culture and setting of hospital care for adult CHD patients, or because adults are more likely to be admitted with acquired disease. Our study may therefore underestimate the true burden of hospital admissions and procedures for adult patients.
Our numerator for the calculation of case fatality rates should capture all deaths occurring in any FCE, and not just first FCEs. Restricting our analysis to 1997/1998 onwards, we were able to use the unique HES patient identifier to remove any duplicate recording of death for the same patient. Whilst there will be some inaccuracy in the calculation of case fatality rates owing to the use of first FCEs as a proxy denominator for admissions, the interpretation of trends over time should not be affected.
Patients admitted to private hospitals in England are excluded from the HES database. However, for serious diagnoses such as CHD, the number of admissions and operations performed in private hospitals is likely to be very small, and therefore this exclusion is unlikely to affect our main findings.
The use of national mortality data over a decade allows trends in death rates to be identified reliably. Moreover, the use of national-level data provides large denominators and numerators for the study of this relatively uncommon condition. Virtually all deaths are captured by the death registration system; therefore it is unlikely that systematic errors will occur due to missing data. With the move to ICD-10 coding in 2001, the Office for National Statistics (ONS) also introduced a new hierarchical classification for deriving an underlying cause of death in neonatal deaths and stillbirths. Such changes in coding and classification can affect the numbers of deaths that are coded to a particular cause, and may lead to spurious changes over time. Bridge coding studies are conducted to examine the comparability of deaths coded under new and previous classifications. Bridge coding studies conducted in Scotland and the United States have shown that, with the introduction of ICD-10, there was a small decrease in the number of deaths coded as having an underlying cause of CHD.22 23 It is possible that changes in death coding could account for a small proportion of the observed decline in mortality rates from CHD between 2000 and 2001. However, continuation of the decline in death rates beyond 2001 suggests that the observed decline is genuine rather than artefactual.
A bridge coding study using the new ONS methodology for assigning an underlying cause to neonatal deaths also showed that, on moving from ICD-9 to ICD-10, there was a very small decrease (1%) in the number of deaths categorised as “congenital anomalies”, but no significant change in death rates from this group of causes.22 It is therefore unlikely that this change in methodology for classifying neonatal deaths will have a significant bearing on our overall findings.
Underascertainment of CHD deaths may occur where CHD remains unrecognised at death. It has been estimated that up to 30% of all deaths in infancy due to CHD remain undiagnosed.24 This problem of underascertainment means that routine mortality statistics underestimate the total burden of mortality due to CHD. This limitation, however, is unlikely to affect our overall finding of decreasing mortality rates over time. Indeed, over the period of this study, case ascertainment is likely to have improved due to developments in diagnostic techniques.3
Explanation of findings and implications
As survival from CHD improves over time and patients with this condition live longer, demand for healthcare from adults living with CHD is expected to grow. Our analysis, which suggests that rates of hospital admission for CHD are increasing, is broadly consistent with the predicted expansion in the number of adults living with CHD in the United Kingdom.15 Moreover, we have found that the largest increases in admission rates have been amongst adults. Persons aged 25 years and over now account for more than a quarter of all hospital admissions for CHD, and, if current trends continue, this proportion is set to increase over the coming years. Indeed, the true secondary and tertiary care burden of adults with CHD may be understated in our study, owing to the likelihood of poorer-quality diagnostic coding for the adult patient. Our finding of increasing rates of hospital admission amongst adults with CHD is also consistent with the growth in demand reported by specialist units that serve this particular patient population.13 25
The relatively stable rates of admission amongst children under 1 are consistent with studies from the United Kingdom and elsewhere that have reported a stable incidence at birth of moderate and severe congenital heart defects.4 26 27
The pattern of age-specific operation rates is interesting. The early peak in operation rates on the heart undoubtedly represents first-time operations performed on young children. Despite tailing off in adolescence and adulthood, operation rates remain above 30% in people admitted with a primary diagnosis of CHD. These high rates of operation in adulthood are indicative of the continuing needs and burden of morbidity experienced by older patients. The second peak in operation rates in late middle age and early old age is, at least in part, likely to reflect the considerable need for reintervention and reoperation in later life.
The decrease in case fatality rates for patients admitted with a primary diagnosis of CHD found in this study is consistent with other reports of improving survival following cardiac surgery.12 28 A deterioration in data quality over time, or a decrease in the number of high-risk procedures, is an unlikely explanation for this apparent improvement in case fatality rates, according to a previous study of paediatric cardiac surgical mortality.12 More likely this reduction in case fatality is due to improvements in the quality of care. Moreover, our study suggests that older patients, and not just infants and children, have benefited from these improvements.
The decline in population mortality rates over time fits in with the picture of increasing survival from CHD, and is consistent with trends reported in the United States.17 Given the apparently stable incidence of complex congenital heart lesions,3 it is possible to suggest that improvements in survival are the principal reason behind declining death rates. The largest reductions in mortality rates from CHD over the past decade have been in children aged between 1 and 14 years. This finding is consistent with other reports of improving survival following paediatric cardiac surgery.11 12 Such improvements have been attributed to improvements in quality of care rather than changes in patient casemix or issues relating to data quality.
Higher mortality rates from CHD in men and boys than in women and girls have also been found in the United States.17 This male excess may be partially explained by an increased incidence at birth of serious CHD lesions amongst boys, although studies reporting a sex differential in the incidence of certain heart defects are inconsistent. Studies have reported a male excess of serious heart defects such as hypoplastic left heart syndrome, transposition of the great arteries and tricuspid atresia.29 Others have found a higher incidence of lethal congenital heart defects amongst girls.30
CONCLUSION
Our study shows an increase in rates of hospital admission for CHD in England, particularly amongst patients in older age groups. We have also shown that rates of operation, although highest amongst very young children admitted for CHD, remain relatively high into adulthood and middle age. There has also been a significant decrease in in-hospital case fatality rates over time in England, as well as a fall in general population mortality from CHD over the past decade in England and Wales.
These trends in hospital admission and operation rates warrant cautious interpretation owing to concerns regarding the quality of HES data, and in particular the accuracy of diagnostic coding for CHD patients. However, the broad trends identified in our study are consistent with other studies reporting improvements in quality of care and survival for patients with CHD. As patients with CHD live longer, demand for healthcare from adults living with this condition can be expected to grow.
Previous studies and reports have highlighted many problems and deficiencies in the current organisation and provision of care for adults with CHD, not least the lack of a structured and well-resourced networked approach to meeting the ongoing needs of patients with different levels of CHD severity and complexity.8 15 28 These deficiencies in current service provision for adults, together with rising demand, highlight to both service commissioners and providers the importance of taking into account the needs of adults with CHD when planning services.
Acknowledgments
JB and AM were responsible for the conception and design of the study. JB analysed the data. MC, MG, AM and JB interpreted the findings of the data analysis. JB wrote the first draft of the article. AM, MC and MG reviewed it critically for intellectual content. JB and AM are guarantors for the study.
REFERENCES
Supplementary materials
web only figures 94/3/342
Files in this Data Supplement:
Footnotes
Funding: This study received no external funding.
Competing interests: None.
Ethics approval: Ethical approval was not required for this study, as it involved the secondary analysis of publicly available routine data (hospital episode statistics and national mortality statistics).