Article Text

Abstract
Objective Meta-analysing studies with low event rates is challenging as some of the standard methods for meta-analysis are not well suited to handle rare outcomes. This is more evident when some studies have zero events in one or both treatment groups. In this article, we discuss why rare events require special attention in meta-analysis, we present an overview of some approaches suitable for meta-analysing rare events and we provide practical recommendations for their use.
Methods We go through several models suggested in the literature for performing a rare events meta-analysis, highlighting their respective advantages and limitations. We illustrate these models using a published example from mental health. We provide the software code needed to perform all analyses in the appendix.
Results Different methods may give different results, and using a suboptimal approach may lead to erroneous conclusions. When data are very sparse, the choice between the available methods may have a large impact on the results. Methods that use the so-called continuity correction (eg, adding 0.5 to the number of events and non-events in studies with zero events in one treatment group) may lead to biased estimates.
Conclusions Researchers should define the primary analysis a priori, in order to avoid selective reporting. A sensitivity analysis using a range of methods should be used to assess the robustness of results. Suboptimal methods such as using a continuity correction should be avoided.
Statistics from Altmetric.com
Introduction
When the outcome of interest is rare, for example, for the case of adverse events, individual studies are often underpowered to detect treatment effects. Pooling together evidence from multiple clinical trials via a meta-analysis offers a way to increase power.1 Performing such meta-analyses, however, might be a methodologically challenging task, especially when some of the studies reported no events in one or both treatment arms (we will refer to such studies as single-zero and double-zero studies, respectively). The issue of rare events is in itself quite frequent; an empirical study found that 30% of a random sample of 500 Cochrane reviews contained at least one trial with zero events in one arm.2 It is important to note at this point that there is no universally accepted definition of what constitutes a rare event. Probably most researchers would agree that a risk smaller than 1% would be enough to classify an event as rare. However, at the meta-analysis level, and depending on the size of the relevant studies, higher event rates might also lead to zero events if the sample sizes are sufficiently small.
Meta-analysing rare events requires special attention because standard methods are not well suited for the task. Probably the most popular method for performing a meta-analysis is the inverse-variance method, either fixed effect or using the DerSimonian and Laird random effects model.3 4 This method involves calculating a treatment effect separately from each study, along with a standard error (SE). For binary outcomes the treatment effects are usually measured as odds ratios (ORs), risk ratios or risk differences. These study-specific estimates are then synthesised at a second level, across studies. An important aspect of the inverse-variance method is that it uses a normal approximation of the true binomial likelihood (the ‘large sample approximation’). This approximation does not work well when event rates are low, while for studies with no events in one or both arms, calculating treatment effects in terms of odds or risk ratios becomes impossible since it involves division by zero.
Consider for example the case of study i, which reported data in the form of the  table shown in table 1. The odds ratio
  for this study can be calculated as
  and the corresponding SE, using the large sample approximation, is given by
  . It is easy to see that when no events are observed in one or both treatment groups (ie, when
  and/or
  ) then the OR, the SE, or both cannot be calculated. The same problem is present when calculating risk ratios as well. Thus, when one or more of the entries of table 1 is zero, the inverse-variance method cannot be used. Note that the problem also appears when all patients had the event in one or both treatment groups (ie, when
  and/or
  ).
).
Data provided by study i, in the form of a 2×2 table
One easy way to overcome the zero-cell problem in single-zero studies is to ‘correct’ the data. This is done by adding a fixed value (typically 0.5) to all cells of table 1, for studies with zero events in one of their arms. This so-called ‘continuity correction’ bypasses the problem caused by zero events, and allows the use of the standard inverse-variance methods. Another simple solution to the problem is to completely forfeit the use of ORs and risk ratios, and only use risk difference to measure relative effects. This would work because the risk difference does not suffer from computational problems in the presence of zero events.
Unfortunately, both aforementioned solutions (applying a continuity correction or using the risk difference) have been found to be problematic for the meta-analysis of rare events.5 Simulations showed that using the inverse-variance method after applying a 0.5 continuity correction leads to excess bias in the estimated effects. In addition, it has been showed that when events are rare, risk difference methods have poor statistical properties (they provide too wide intervals and have low power), which makes them unsuitable for meta-analysis.5
Double-zero studies are usually omitted from the meta-analysis (this is the default option for many statistical software). The Cochrane Handbook argues that such studies do not carry information regarding odds/risk ratios, and should therefore be excluded. Some researchers, however, pointed out that from an ethical point of view, patients in double-zero studies deserve to be included in the analyses,6 while others discuss that such studies may carry information of relative treatment effects through their sample size.7
One additional issue with rare events is that, for the case of random effects meta-analysis, the estimation of the variance of random effects (heterogeneity) may be biased,8 which may lead to spuriously narrow confidence intervals (CIs).
Thus, for the case of rare events meta-analysts need to resort to more advanced statistical methods. There are several alternatives that can be used to this end. In the Methods section of this paper we give a brief account of some of these methods. In the Results section we employ an example from a recent meta-analysis regarding mortality in antipsychotics9 to illustrate the methods that will be discussed.
Methods
In this section we go through some of the methods that have been proposed for the meta-analysis of rare events.
Peto’s method
Peto’s method10 can only be used to estimate ORs. It is by definition a fixed effects method, that is, it cannot account for heterogeneity between trials, which is one of the limitations of this model. Peto’s OR follows an approach similar to the inverse-variance model, but the effect estimate and the weight for each study are defined differently. The model incorporates evidence from single-zero studies without having to resort to continuity corrections. Double-zero studies are excluded from the analysis. Thus, the only instance when Peto’s method runs into computational problems is when all studies in the meta-analysis are double-zero, that is, when no events were observed in all studies. Simulations by Sweeting et al 11 and Bradburn et al 5 showed that the Peto’s OR works reasonably well when the event is rare (<1%), the treatment groups are balanced (ie, there is approximately the same number of patients in the treatment and control arms within each study) and the effects are not very large. If these conditions do not hold, Peto’s method may give biased results. For this reason, Cochrane does not recommend Peto as the default approach for rare events meta-analysis.1
Mantel-Haenszel meta-analysis
The Mantel-Haenszel (MH) method12 is a different approach to fixed effects meta-analysis. It can be used for ORs, risk ratios or risk differences, and it uses a different weighting scheme for each measure. The method incorporates evidence from single-zero studies without requiring continuity corrections, unless the same cell of table 1 is zero for all studies (eg, when  for all i). Thus, the method requires continuity corrections much less often. The MH method excludes from the analysis double-zero studies, unless risk difference is used. MH ORs have been shown to perform better than Peto’s method, in cases where the latter performed poorly (eg, when the treatment groups are unbalanced).5 Cochrane’s software for meta-analyses (RevMan) uses MH as the default fixed effect meta-analysis method. Note here that a random effects MH approach is also implemented in RevMan V.5. This however is not a ‘true’ MH model; it only uses the MH fixed effect pooled result to estimate the heterogeneity, and then uses a DerSimonian and Laird (inverse variance) random effects model. This means that this hybrid approach suffers from the usual problems that the inverse-variance method faces when events are rare.
Using a ‘treatment-arm’ continuity correction
As we already discussed, a simple way to bypass the complications associated with zero events is to add 0.5 to all cells of table 1 (ie, to  and
and  ). This method, however, has been shown to perform poorly, that is, it may give extremely biased results, especially when groups are unbalanced.11 Sweeting et al
11 tried to mitigate these undesirable effects by using non-fixed corrections. In their approach, the continuity correction is different for each treatment arm of each study, and is inversely related to the size of the treatment arm. After implementing this correction to the data, standard approaches can be used for meta-analysis (eg, inverse variance, MH). The authors showed that a non-fixed continuity correction is preferable to the usual 0.5.
). This method, however, has been shown to perform poorly, that is, it may give extremely biased results, especially when groups are unbalanced.11 Sweeting et al
11 tried to mitigate these undesirable effects by using non-fixed corrections. In their approach, the continuity correction is different for each treatment arm of each study, and is inversely related to the size of the treatment arm. After implementing this correction to the data, standard approaches can be used for meta-analysis (eg, inverse variance, MH). The authors showed that a non-fixed continuity correction is preferable to the usual 0.5.
However, the use of continuity corrections has been criticised, and it has been pointed out that this essentially arbitrary correction (0.5 or any other number) can affect the results of the meta-analysis.6 7
Logistic regression
Logistic regression approaches use the correct binomial distribution of the data, and can be used to perform either a fixed or a random effects meta-analysis. In this approach, single-zero studies are included without any continuity correction, while double-zero studies are excluded from the analysis. One general caveat of logistic regression is that in order to perform a random effects meta-analysis it is required to estimate the extent of heterogeneity of treatment effects, and this might be very difficult when events are rare.8 Logistic regression (with unconditional binomial likelihood) has been shown to perform similarly with the MH OR without continuity correction.5
Bayesian meta-analysis
Bayesian statistics is a branch of statistics in which the notion of probability corresponds to the state of knowledge regarding a certain phenomenon,13 rather than the expected frequency of an event (which corresponds to the so-called frequentist probability). Bayesian statistics are based in updating pre-existing evidence in the light of new data. In a Bayesian analysis, for each quantity of interest (eg, the treatment effects, or the extent of heterogeneity in a meta-analysis) we assign a prior distribution. This distribution quantifies our prior knowledge regarding this quantity, along with some uncertainty. In practice, for some of the parameters of a model there might be no prior knowledge or we may wish our priors to have a minimal effect on the model’s estimates. In such cases we can use ‘uninformative’ (‘vague’) distributions for these parameters.
For a Bayesian meta-analysis one can use an adaptation of the simple logistic regression model.14 15 This requires specifying prior distributions for all model parameters. When data are sparse, the choice of prior distributions can be very important. Even if a prior distribution is intended to be uninformative, it might have substantial impact on the results.16 This is especially true for the case of specifying priors for heterogeneity in a random effects meta-analysis.17
This problem can be tackled by using reliable external information. For example, in a recent metaepidemiological study,18 19 Turner et al analysed data from 15 000 binary outcome meta-analyses from the Cochrane Database of Systematic Reviews. The authors then used results to formulate informative prior distributions for the extent of between-study heterogeneity. These distributions cover 80 different settings with respect to the outcome being assessed, the nature of the interventions being compared, and so on. Such informative distributions can be used as priors for a random effects Bayesian meta-analysis, to overcome the problem of having ‘uninformative’ priors dominating results.
Beta-binomial with correlated responses
The methods we have described up to this point (with the exception of the MH risk difference) exclude double-zero studies from the analyses. Kuss performed a simulation study7 to compare several methods for meta-analysing rare events that do not exclude double-zero studies and do not use continuity corrections. Based on these simulations, Kuss concluded that a beta-binomial model with correlated responses may be the best approach to meta-analysing rare events in studies with balanced treatment groups. This approach models the probability of an event in each treatment group of each study using a binomial likelihood, and then pools this probability for each group across studies using a bivariate (‘Sarmanov’) beta distribution.20 The beta-binomial model can be used to estimate odds/risk ratios and risk differences, and is by definition a random effects model.
Arcsine difference
Rücker et al
21 proposed the use the arcsine difference for summarising treatment effects. Their approach calculates the treatment effect from each study separately along with its SE. This is done using a measure called arcsine difference, which is a function of  and
and  of table 1. The study-specific estimates of the arcsine difference are then combined using a standard fixed or random effects approach. The advantage of this approach is that it incorporates evidence from single-zero and double-zero studies without requiring a continuity correction. It can also provide an estimate even in the extreme case of having only double-zero studies in the meta-analysis, that is, when there was no event in any study. The major disadvantage of this method is that arcsine difference is very hard to interpret. Thus, this method has not been used in practice very often. It may however be valuable as a secondary analysis, to assess the robustness of results (eg, when another method has detected a treatment effect).
Other methods
Several other models have appeared in the literature and can be used for the meta-analysis of rare events, such as an exact method based on combining CIs,22 a bivariate binomial-normal model,16 a hypergeometric-normal model,16 a Poisson-gamma model23 and others. These methods have been rarely used in practice, and we will not consider them here in more detail.
Illustrative case study
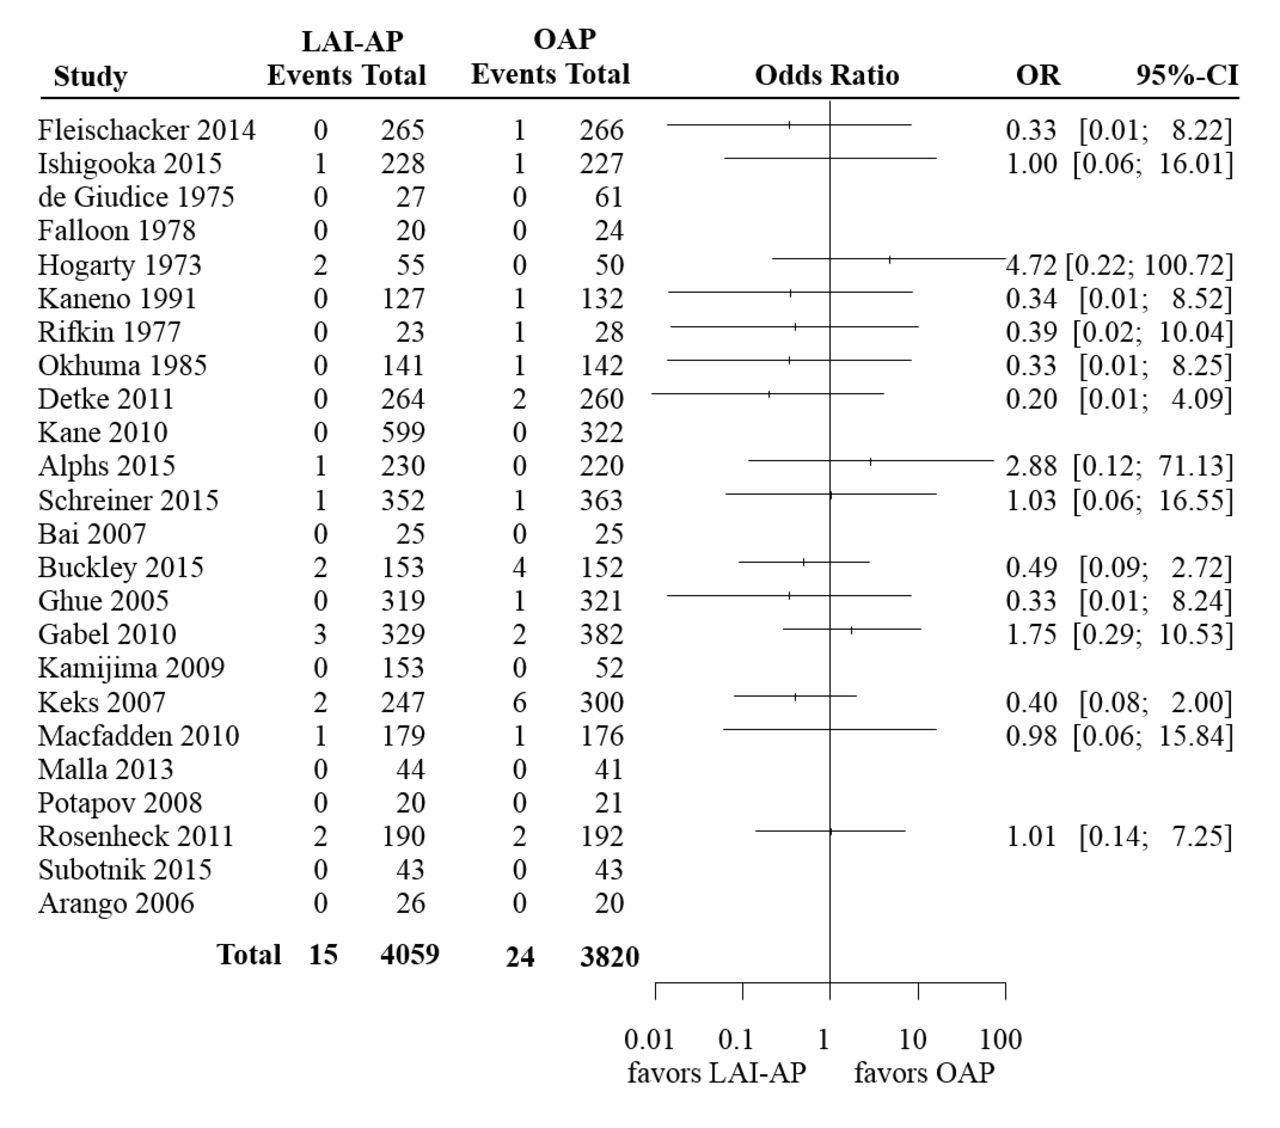
In order to illustrate the methods that we discussed in this section, we used a set of previously published data regarding mortality risk in antipsychotics.9 This comprised two independent meta-analyses. The first one included 18 trials that compared long-acting injectable antipsychotics (LAI-AP) to placebo, for all-cause mortality. The event was very rare; the risk of death across both arms in all studies was around 0.2%. Only seven events were reported in the drug arms (total 3774 patients) and six events in the placebo arm (2145 patients). The available data are summarised in figure 1, where we also show the ORs and 95% CI from each study, calculated using the large sample approximation. In this figure, in order to calculate ORs in single-zero studies we used a 0.5 continuity correction, for illustration purposes. No ORs are shown for double-zero studies. The second meta-analysis compared LAI-AP with oral antipsychotics (OAP) for all-cause mortality. A total of 24 studies were included, reporting 15 deaths in LAI-AP (4059 patients) and 24 deaths in OAP (3820 patients). The total risk of death across both arms was around 0.5%. Figure 2 shows the available data.

Summary of the available studies for all-cause mortality, for long-acting injectable antipsychotics (LAI-AP) versus placebo. For illustration purposes, in order to calculate ORs and CIs in single-zero studies we have used a 0.5 continuity correction. For double-zero studies no effect is shown.

Summary of the available studies for all-cause mortality, for long-acting injectable antipsychotics (LAI-AP) versus oral antipsychotics (OAP). For illustration purposes, in order to calculate ORs and CIs in single-zero studies we have used a 0.5 continuity correction. For double-zero studies no effect is shown.
In the original publication,9 the authors performed both meta-analyses using the standard inverse-variance method, with a 0.5 continuity correction for single-zero studies. Here we reanalysed these data using a range of different methods. As we have already discussed, risk difference has been shown to perform poorly when it comes to meta-analysing rare events,5 and we did not consider it here. Moreover, when the probability of an event is low, the difference between risk ratios and ORs becomes negligible. Thus, we only focused on ORs—an analysis of risk ratios would give almost identical results. For the Bayesian random effects meta-analyses we used informative prior distributions for heterogeneity, based on the empirical study by Turner et al. 19 For the first meta-analysis (LA-IAP vs placebo) we used the distribution corresponding to all-cause mortality, for pharmacological interventions versus placebo. For the second meta-analysis (LAI-AP vs OAP) we used the distribution corresponding to all-cause mortality, for pharmacological versus pharmacological interventions (table IV in ref 19).
All analyses were performed using freely available software (R24 and OpenBUGS24). All software codes we used as well as some additional details regarding fitting the models are given in the online supplementary appendix.
Supplementary file 1
Results
Table 2 summarises results from all analyses. It is evident that the choice of the method for meta-analysis is more important in the first example (LAI-AP vs placebo) as compared with the second (LAI-AP vs OAP). This is because events in the first data set were sparser. In fact, out of the 18 studies of the LAI-AP versus placebo data set only one had events in both arms—the rest were either single-zero (nine studies) or double-zero (eight studies). Conversely, in the second data set there were seven studies with events in both arms, eight single-zero and nine double-zero studies. This finding highlights a more general conclusion, that is, the sparser the data, the larger the impact of the choice of meta-analysis method.
Results from two sets of meta-analyses using a range of different methods. An OR <1 or an arcsine difference <0 in the X versus Y comparison indicates that treatment X is safer (lower risk of death)
If we focus on the first example we can easily see that using a continuity correction (either 0.5 as in the original paper, or the treatment-arm continuity correction11) leads to narrower CIs compared with other methods, that is, larger precision in the results. This should come as no surprise, as this method in essence imputes data in single-zero studies. Thus, this increase in precision is artificial. Moreover, it is obvious that different choices of the continuity correction lead to different results.
In the same example, the Peto’s method gives similar, but not identical results to MH with no continuity correction. A look at the data might convince us that Peto’s method is suboptimal for this particular example, as there are studies with large imbalances, for example, there are studies with 3:1 randomisation ratio.
The fixed effect Bayesian model gave almost identical results to the MH approach (without continuity correction). The effect of modelling random effects was rather minimal in both analyses, as the estimated value for heterogeneity was small (detailed results in the online supplementary appendix).
The beta-binomial with correlated responses model failed to converge for the first example. This highlights one of the potential disadvantages of this model, as compared with the other approaches. For the second example it gave results comparable to the rest of the methods.
Finally, in table 2 we also show the results from the arcsine difference meta-analysis. It should be obvious that interpreting this effect measure in a clinically meaningful way can be very difficult.
Discussion
Different methods for meta-analysing rare events may lead to different conclusions, and the sparser the data the larger the differences between the results of the alternative methods. This was highlighted in a much-publicised meta-analysis regarding the effects of rosiglitazone on the risk of myocardial infarction and death. The original meta-analysis25 gave results very close to the conventional threshold of ‘statistical significance’ (ie, p<0.05). Subsequent meta-analyses of the same data set using alternative methods led to (slightly) different results than the original publication,23 26 which had an impact on the statistical significance of the findings.
This ambiguity stems from the fact that there is currently no clear answer as to which is the best model for meta-analysing rare events. Different models employ different assumptions, whose validity is usually difficult (or even impossible) to assess. Keeping that in mind, we highlight several general considerations that researchers can take into account when setting off to perform a meta-analysis of rare events:
The use of artificial continuity corrections should be avoided (with an exception perhaps for visualising evidence,7 eg, as we did in figures 1 and 2).
Risk difference is usually not the optimal effect measure to use.
Peto’s method should not be employed when the three conditions needed are not met (event rates <1%, balanced groups, small treatment effects). In such circumstances the MH ORs without continuity correction perform better than Peto.
The beta-binomial model has been shown in simulations to outperform other methods in some settings,7 but might suffer from issues regarding convergence of the model.
Bayesian meta-analysis with informative prior distributions is a good way to include random effects in the meta-analysis. This is because it overcomes the problem of estimating heterogeneity when events are sparse.
Results regarding relative effects (odds/risk ratios) should always be presented along with absolute incidence rates, to put results into context.27 A risk ratio of 1.5 might have very different clinical implications when the risk in the control group is 5% and when it is 0.1%.
Meta-analysts should avoid labelling results as statistically significant or non-significant. The use of p value thresholds to dichotomise findings has recently attracted a lot of criticism.28 Particularly for the case of rare events meta-analysis, the use of arbitrary cut-points for p values (such as the usual 0.05 or any other threshold29) can be even more problematic, because results might be affected by the choice of model—as was the case in the rosiglitazone example.
Finally, researchers should predefine an analysis plan a priori (eg, at the protocol), to avoid selective use of methods. In addition, when events are rare, meta-analysts should always perform extensive sensitivity analyses using a range of alternative models, to ensure the robustness of their results. When results are very sensitive to the choice of model researchers should be particularly cautious on how they present and interpret their findings. In such cases, results should be considered exploratory and hypothesis generating.27
References
Footnotes
Funding This work has been supported by the Swiss National Science Foundation (grant title: ‘Enhancing methods for evaluating the comparative safety of medical interventions’).
Competing interests None declared.
Patient consent Not required.
Provenance and peer review Not commissioned; externally peer reviewed.