


Abstract
Nicotine is the major addictive agent in tobacco smoke, and it is metabolized extensively by oxidation and glucuronide conjugation. The contributions of ethnicity and UGT2B10 haplotype on variation in nicotine metabolism were investigated. Nicotine metabolism was evaluated in two populations of smokers. In one population of African American and European American smokers (n = 93), nicotine and its metabolites were analyzed in plasma and 24-h urine over 3 days while participants were abstinent and at steady state on the nicotine patch. In a second study of smokers (n = 84), the relationship of a UGT2B10 haplotype linked with D67Y to nicotine and cotinine glucuronidation levels was determined. We observed that both African American ethnicity and the UGT2B10 D67Y allele were associated with a low glucuronidation phenotype. African Americans excreted less nicotine and cotinine as their glucuronide conjugates compared with European Americans; percentage of nicotine glucuronidation, 18.1 versus 29.3 (p < 0.002) and percentage of cotinine glucuronidation, 41.4 versus 61.7 (p < 0.0001). In smokers with a UGT2B10 Tyr67 allele, glucuronide conjugation of nicotine and cotinine was decreased by 20% compared with smokers without this allele. Two key outcomes are reported here. First, the observation that African Americans have lower nicotine and cotinine glucuronidation was confirmed in a population of abstinent smokers on the nicotine patch. Second, we provide the first convincing evidence that UGT2B10 is a key catalyst of these glucuronidation pathways in vivo.
Lung cancer is the second most common cancer and the leading cause of cancer death among both African Americans and European Americans (Jemal, 2009). African Americans have higher rates of lung cancer than European Americans despite consistently reporting smoking fewer cigarettes per day (cpd) (Haiman et al., 2006). Yet, higher levels of the nicotine metabolite cotinine have been documented in African Americans at all levels of smoking (Wagenknecht et al., 1990; Pirkle et al., 1996; Caraballo et al., 1998; Perez-Stable et al., 1998; Kandel et al., 2007). In the National Health and Nutrition Examination Study III, cotinine was also higher in African American nonsmokers than European American nonsmokers who reported similar environmental tobacco smoke exposure (Caraballo et al., 1998). Higher cotinine among African American compared with European American smokers could reflect higher exposure per cigarette, differences in nicotine metabolism, or a combination. Benowitz et al. (1999) conducted a nicotine infusion study in smokers and reported that African Americans had decreased urinary levels of nicotine and cotinine glucuronide conjugates, slower conversion of nicotine to cotinine, and increased nicotine exposure per cigarette compared with European Americans (Perez-Stable et al., 1998). Ethnic differences in nicotine metabolism may affect cancer risk through an effect on smoking behavior or because the enzymes that metabolize nicotine also metabolize carcinogens in tobacco smoke.
In most smokers, nicotine is metabolized primarily by P450 2A6-catalyzed 5′-oxidation (Hukkanen et al., 2005). The product of this reaction is further metabolized to cotinine either by P450 2A6 or aldehyde oxidase (von Weymarn et al., 2006). Cotinine, in turn, is metabolized to trans-3′-hydroxycotinine. Nicotine may also be metabolized by N-oxidation or N-glucuronidation (Fig. 1); each of these pathways, on average, accounts for less than 10% of the total nicotine dose excreted. However, in some smokers, nicotine glucuronide may account for up to 50% of the nicotine metabolites excreted (Murphy et al., 2004).

Glucuronide conjugation pathways of nicotine metabolism.
In the urine of a smoker, or an individual on the nicotine patch, >80% of the nicotine dose is accounted for by nicotine, cotinine, trans-3′-hydroxycotinine, and their glucuronide conjugates (Hukkanen et al., 2005; Scherer et al., 2007). The sum of these six compounds, referred to as total nicotine equivalents, has been used by us and others as an estimate of tobacco exposure (Scherer et al., 2007; Derby et al., 2008). Overall, glucuronide metabolites of nicotine and cotinine account for approximately 25% of the nicotine metabolites excreted in urine, and from 0.8 to 84% of the nicotine or cotinine in a smoker's urine is present as its glucuronide conjugate (Benowitz et al., 1994; Murphy et al., 2004).
Variation in nicotine metabolism has been associated with differences in smoking behavior (Benowitz, 1999; Schoedel et al., 2004; Malaiyandi et al., 2006; Strasser et al., 2007). Metabolism largely determines the rate of decline in nicotine levels and to avoid onset of nicotine withdrawal, smokers adjust their smoking (Benowitz, 1999). The P450 2A6 (CYP2A6) gene is highly polymorphic, and several variants are associated with altered (increased or decreased) nicotine metabolism, including variants found in African Americans (Mwenifumbo and Tyndale, 2007; Mwenifumbo et al., 2008; Ho et al., 2009). Yet, even among African Americans who are genotypically considered CYP2A6 wild type, there is significant variation in phenotype, assessed by the ratio of trans-3′-hydroxycotinine to cotinine (Ho et al., 2009).
The role of glucuronidation on variation in nicotine metabolism and smoking behavior is not well characterized. N-Glucuronide conjugation of nicotine and cotinine is catalyzed by UDP-glucuronosyl transferases (UGTs) (Kuehl and Murphy, 2003; Kaivosaari et al., 2007), and in vitro the most efficient catalyst of both reactions is UGT2B10, followed by UGT1A4 (Kaivosaari et al., 2007). Both enzymes are polymorphic but few variants have been evaluated in nicotine metabolism (Ehmer et al., 2004; Saeki et al., 2005; Chen et al., 2007). An D67Y substitution in UGT2B10 is associated with a 20 to 30% decrease in nicotine and cotinine glucuronidation in vitro (Chen et al., 2007). In European Americans the D67Y allele is linked with a haplotype with an allelic prevalence of 11%; UGT2B10 haplotype analysis or genotyping of D67Y has not been reported for African Americans (Chen et al., 2007).
We report here the results of a controlled dose nicotine metabolism study of African Americans and European Americans. Nicotine and its major metabolites were analyzed in urine from abstinent smokers on the nicotine patch, as well as while participants were smoking ad libitum. In addition, we evaluated the effect of UGT2B10 haplotype on nicotine and cotinine glucuronidation.
Materials and Methods
Patch Study Recruitment.
The study was approved by the University of Minnesota's Institutional Review Board. Smokers were recruited from the Minneapolis-St. Paul area through newspaper advertisements, flyers, and word of mouth. Potential participants were scheduled by telephone for a screening visit. Inclusion criteria were 1) age 18 to 74 years, 2) grandparents who were all either African American or European American, 3) daily smoking >10 cpd, and 4) in good health. A medical history questionnaire and vital signs were used to assess health. Individuals who used illicit drugs were taking barbiturates or anticonvulsants and women who were pregnant were ineligible. In total, 105 individuals enrolled.
Patch Study Protocol.
The 8-day study included baseline smoking assessment, followed by administration of the nicotine patch (Nicoderm; GlaxoSmithKline, Uxbridge, Middlesex, UK). Participants completed questionnaires about demographics and smoking behavior. Current smoking was verified by exhaled CO and a urine spot check for nicotine (NicCheck; Mossman Associates, Blackstone, MA). Participants collected 24-h urine while smoking as usual. Subsequently, participants were instructed to abstain from smoking and to use 21-mg nicotine patches. On days 5 to 7 of using the patch, after reaching steady state, participants visited the study center for CO testing, blood pressure, and heart rate assessment, and 24-h urine drop-off. A subset of participants provided plasma (n = 70; 75%) during days 5 to 7. Blood for genotyping was obtained from 32 participants. Compliance was determined as having a CO <8 ppm and turning in used nicotine patches. Participants were offered referrals to smoking cessation programs and received compensation (US$200).
TRIP Study.
UGT2B10 genotype-phenotype analyses involved samples from a prior study of nicotine metabolism among European American smokers. Tobacco Reduction Intervention Program (TRIP) participants were smokers aged 18 to 70 who smoked >14 cpd (Hecht et al., 2004; Murphy et al., 2004). While smoking as usual, participants provided first morning urine; two to four samples were collected with each at least 1 week apart. Urinary nicotine and nicotine metabolite concentrations were previously reported (Murphy et al., 2004).
Chemicals and Reagents.
(S)-[5-3H]Nicotine was purified as described previously (Murphy et al., 2005). Nicotine N-β-d-glucuronide was purchased from Toronto Research Chemicals Inc. (North York, ON, Canada). Other chemicals were purchased from Sigma-Aldrich (St. Louis, MO) unless otherwise noted.
Nicotine and Metabolite Analysis.
All urine samples were stored at −20°C before analysis. Four 24-h urine samples were analyzed (days 1 and 5–7) per participant. Base treatment was used to cleave glucuronide conjugates of nicotine and cotinine. Free nicotine, total nicotine (free nicotine + N-glucuronide), free cotinine, and total cotinine (free cotinine + N-glucuronide) were quantified by gas chromatography/mass spectrometry (GC/MS) (Hecht et al., 1999a,b; Murphy et al., 2004). Total cotinine and total nicotine values for urine samples, stored at −20°C and analyzed 8 months apart, did not differ significantly. The mean difference in the pair of values was 7.3% for cotinine and 12% for nicotine (n = 62). Free cotinine concentrations in urine stored at 5°C for 30 days are no different then when analyzed immediately (Hagan et al., 1997). Total trans-3′-hydroxycotinine (trans-3′-hydroxycotinine + its glucuronides) was analyzed after treatment with β-glucuronidase by GC/MS (Hecht et al., 1999a). From whole blood, plasma was separated and stored at −20°C. Nicotine and cotinine were then quantified by GC/MS as performed for urinary metabolites except for an initial solid phase extraction using an Oasis MCX column (Waters, Milford, MA) (Hecht et al., 1999b). Analyses were performed in duplicate and repeated if values differed by >10%. The mean difference in duplicates was 3%.
UGT2B10 Haplotyping.
DNA was isolated from blood (Ethnic study, n = 32; TRIP study, n = 84) with the GFX DNA purification kit (GE Healthcare, Piscatway, NJ) or from frozen human liver tissue (n = 28) using the DNeasy kit (QIAGEN, Valencia, CA). Polymerase chain reaction-restriction fragment length polymorphism (RFLP) analysis was performed as previously described on the UGT2B10 SNP rs7657958 that is linked with D67Y in Caucasians (haplotype C) (Chen et al., 2008). DNA samples that tested positive for the rs7657958 variant and an equal number of samples that were called wild type were subjected to a second RFLP targeting the codon 67 position with HinfI digestion (Chen et al., 2008). DNA from all African Americans and from all European Americans in the ethnic study was genotyped at the codon 67 position. The D67Y substitution was confirmed by DNA sequencing in eight individuals (two African Americans and six European Americans) and its absence was confirmed in two wild-type individuals.
Nicotine Glucuronidation by Human Liver Microsomes.
Frozen normal liver tissues from African American (n = 14) or European American (n = 14) donors were obtained through the Liver Tissue Cell Distribution System from the University of Pittsburgh repository (National Institutes of Health Contract N01-DK-7-0004/HHSN26700700004C). Donor characteristics were average age (49 years), gender (50% female), body mass index (26.6 kg/m2), and smoker (36%). Microsomes were prepared by the method of Fowler et al. (1994) and aliquots were stored at −80°C. Total protein concentrations were determined by the Bradford assay with Coomassie Plus (Pierce Chemical, Rockford, IL). Microsome quality was evaluated by p-nitrophenol O-glucuronidation activity. Product formation was quantified by UV-HPLC after incubation with 500 μM p-nitrophenol and 5 mM UDPGA (Kuehl and Murphy, 2003). These HLMs had p-nitrophenol glucuronidation activity ranging from 10 to 55 nmol/min/mg protein.
HLMs (2 mg/ml) were incubated with 0.5 or 5 mM (S)-[5-3H]nicotine (specific activity, 25 and 2.5 Ci/mol, respectively) and 5 mM UDPGA essentially as described by Kuehl and Murphy (2003). Metabolites were quantified by radioflow HPLC using a Gemini C18 (5 μm, 250 × 4.60 mm) column (Phenomenex, Torrance, CA), SPD-10Avp UV-VIS detector (Shimadzu, Kyoto, Japan), and β-RAM radioflow detector (IN/US Systems, Tampa, FL). The mobile phase was 20 mM ammonium bicarbonate, pH 9.2, in water (A) and acetonitrile (B), and the gradient was 2.5% B for 0 to 12 min, to 25% B in 15 min, and hold at 25% B for 5 min. The eluant flow was 0.8 ml/min, and the scintillant flow was 2.4 ml/min using Monoflow 5 (National Diagnostics, Atlanta, GA). This HPLC system provided good separation between nicotine N-glucuronide (11 min) and nicotine (41 min). No significant cleavage of nicotine N-glucuronide was observed during HPLC analysis. The tritiated reaction product coeluted with nicotine N-glucuronide standard and formed nicotine after β-glucuronidase treatment. Activity assays were performed with microsomes that underwent a single freeze-thaw because repeated freeze-thaw resulted in significantly decreased p-nitrophenol and nicotine glucuronidation activity; however, this did not seem to vary by donor ethnicity or haplotype.
Other Analyses.
Exhaled CO was determined using a Medical Gas Monitor (Bedfont Scientific Ltd., Kent, UK). Urine spot checks for nicotine were performed using NicCheck.
Statistics.
Patch participants were excluded from analyses if they were noncompliant. Specifically, participants were excluded if on more than one visit they excreted <20 or >120% of the patch dose or had exhaled CO levels >8 ppm. Single visits that met noncompliance criteria were excluded from analysis (eight of 279; 3%). Overall, 12 participants (seven African American) were excluded due to ethnicity was American Indian (n = 1), not completing the study (n = 2), dose recovery was <20% (n = 6), and dose recovery was >120% (n = 3; two had plasma cotinine levels greater than 700 ng/ml, suggesting concurrent smoking). Included in analyses were 93 participants. Baseline urine was available for 59 participants, after exclusion of 4 participants who returned <400 ml of 24-h urine at baseline.
Statistical analyses were conducted using SAS (SAS Institute, Cary, NC) and Excel (Microsoft, Redmond, WA). Wilcoxon two-sided t-approximation statistics were calculated to compare means of continuous variables that did not have a normal distribution, and a p value less than 0.05 was considered significant. Chi-square approximation statistics were analyzed for categorical variables. Spearman nonparametric correlation was used to assess univariate correlations. Multivariate linear regression models were evaluated to assess predictors of cotinine glucuronidation (square-root transformed ratio of cotinine glucuronide to free cotinine) and the nicotine metabolite ratio (square-root transformed ratio of total trans-3′-hydroxycotinine to total cotinine) (Derby et al., 2008).
Results
Patch Study Population.
African American and European American participants were not statistically different in age (mean, 38; range, 26–56), gender (51% female), cpd (mean, 21), or quit attempts (mean, 4). The distribution of time to first cigarette was 48%, 0 to 5 min; 37%, 6 to 30 min; 11.5%, 31 to 60 min; and 3.5%, > 60 min, and there was no difference by ethnicity. African American women reported more attempts to quit than men (6.1 versus 3.2; p = 0.012) or European American women (6.1 versus 3.3; p = 0.02). Mentholated cigarettes were smoked by 86% African Americans and 24% European Americans (p < 0.0001). Fewer African Americans than European Americans reported attending at least some college in this study population (43 versus 64%; p = 0.04).
Nicotine Metabolism on the Patch.
Free nicotine and free cotinine were quantified in plasma to assess nicotine dosing achieved with the patch in 70 of 93 (75%) of participants. At steady state (day 6), free cotinine levels were comparable with levels observed in smokers. Mean free nicotine and free cotinine were 28.1 ± 30.6 and 311 ± 170 ng/ml for African Americans and 18.3 ± 11.8 and 245 ± 129 ng/ml for European Americans, and values were not statistically different by ethnicity. Mean plasma free cotinine and nicotine concentrations also did not differ by gender. Plasma free cotinine was correlated with 24-h urinary free cotinine (0.49; p < 0.0001).
Nicotine and nicotine metabolites were quantified in 24-h urine from days 4, 5, and 6 of patch use, and their average urinary concentrations were determined for each individual. The mean intraindividual variation in the concentrations for all analytes measured was much less than the interindividual variation (Table 1). To estimate the nicotine dose each subject obtained during patch use, we calculated the percentage of the patch dose excreted in each 24-h urine collection. Specifically, the molar sum of nicotine and its metabolites in 24-h urine were expressed as a molar percentage of nicotine in a 21-mg (130-μmol) patch. The mean estimated dose on days 5 to 7 was 61 ± 20% for African Americans and 70 ± 25% for European Americans (p = 0.09). The intraindividual variation in the estimated dose recovered was 13% for both African Americans and European Americans. In addition, nicotine equivalents, defined as the sum of nicotine, cotinine, trans-3′-hydroxycotinine, and their respective glucuronides, expressed as nanomoles per millimeter or micromoles per 24-h urine, were the same for African Americans and European Americans, 81.2 ± 39.4 and 84.0 ± 42.7 nmol/ml, respectively (Scherer et al., 2007). Therefore, any differences in absorbance from the patch or compliance, in patch use or urine collection, did not vary by ethnicity.
Urinary nicotine and nicotine metabolite levels
The urinary concentration of free cotinine did differ significantly by ethnicity. The mean free cotinine concentration for African Americans was 33% higher than for European Americans, 12.7 ± 6.2 versus 9.5 ± 4.2 nmol/ml, respectively (p = 0.01). Free nicotine was also higher among African Americans than European Americans, 12.9 ± 9.4 versus 9.9 ± 6.5 nmol/ml, but the means were not statistically different (p = 0.17). There was no significant difference by ethnicity in mean total nicotine, total cotinine or total trans-3′-hydroxycotinine, the product of cotinine oxidation (Table 1). Therefore, the observation that African Americans had higher free cotinine but similar total cotinine levels reflects a difference in glucuronidation.
Glucuronide conjugation of both nicotine and cotinine was significantly lower among African Americans compared with European Americans (Table 1). The percentage of nicotine excreted as a glucuronide conjugate in 24-h urine was 18.1 ± 12.7% for African Americans versus 29.3 ± 16.9% for European Americans (p = 0.002). The percentage of cotinine excreted as a glucuronide conjugate was 41.4 ± 20.7% for African Americans versus 61.7 ± 14.2% for European Americans (p < 0.0001). Nicotine and cotinine glucuronidation were correlated in African Americans and European Americans, 0.73 and 0.53, respectively (p = 0.11 for difference in correlation by ethnicity).
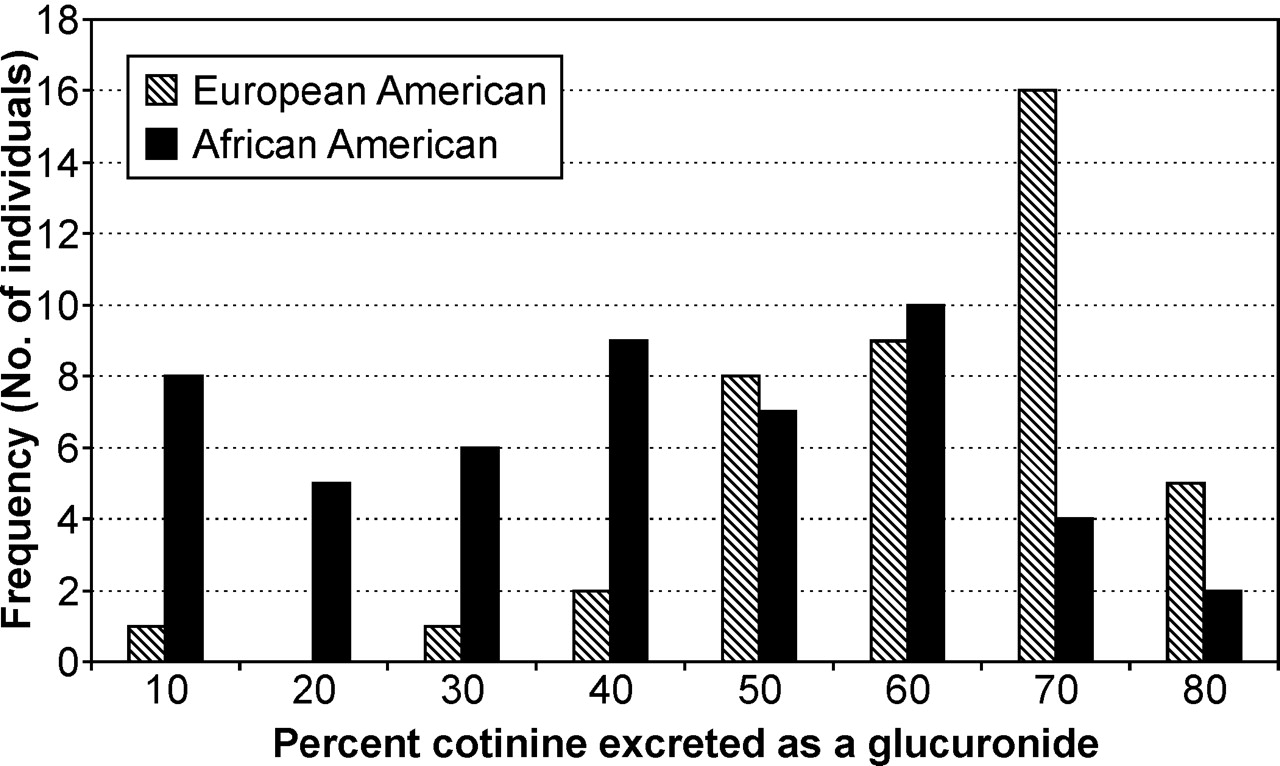
The distribution of percentage of cotinine excreted as a glucuronide was distinct for African Americans (Fig. 2). Few European Americans excreted less than 50% cotinine as its glucuronide, whereas this was common among African Americans. We observed large interindividual variation in percent glucuronidation regardless of ethnicity. The ranges of percent glucuronidation for nicotine and cotinine were 0.4 to 67.5 and 8.6 to 84.4%, respectively. Intraindividual variation in glucuronidation on days 5 to 7 was low, with a mean S.D. of 7.3% for nicotine (range, 0.1–53%) and 4.9% for cotinine (range, 0.1–21.8%). There was no difference in intraindividual variation by ethnicity.

Percentage of cotinine excreted as its glucuronide in 24-h urine by ethnicity.
In contrast, we observed no difference in nicotine 5′-oxidation by ethnicity. We evaluated nicotine 5′-oxidation as the urinary ratio of total trans-3′-hydroxycotinine to total cotinine (Benowitz et al., 2003; Derby et al., 2008). The value of this ratio ranged from 0.10 to 7 across all subjects, with one outlier of 15.8. The mean ratio was 2.28 ± 2.42 for African Americans and 1.62 ± 1.12 for European Americans (p = 0.27). The ratio of total trans-3′-hydroxycotinine to total cotinine (total/total) was highly correlated with the ratio of total trans-3′-hydroxycotinine to free cotinine (total/free) in both ethnic groups, 0.79 (p < 0.0001). Neither ratio varied by ethnicity. There was also no influence of gender on either ratio.
Predictors of glucuronidation, assessed as the ratio of cotinine glucuronide to cotinine, were evaluated by univariate correlations and multivariate linear regression models (Table 2). In univariate comparisons, a lower glucuronidation ratio was significantly correlated with African American ethnicity, male gender, older age, lower nicotine equivalents, higher trans-3′-hydroxycotinine/cotinine ratio, lower percentage of dose excreted as nicotine, and lower percentage of dose recovered. The glucuronidation ratio was not correlated with baseline cpd or urine volume. The multivariate model to evaluate predictors of low glucuronidation ratio (square-root of cotinine glucuronide/cotinine) using stepwise selection included African American ethnicity, low nicotine equivalents, and high trans-3′-hydroxycotinine/cotinine ratio, and not gender. The adjusted r2 value for the model was 0.41, compared with 0.35 if the trans-3′-hydroxycotinine/free cotinine ratio was not included.
Predictors of the glucuronidation ratioa: multivariate linear regression models and univariate spearman correlation coefficients
Baseline Nicotine Metabolism.
Nicotine and nicotine metabolites were also quantified in 24-h urine at baseline while participants were smoking ad libitum (Table 1). As was observed when these subjects were using the nicotine patch, free nicotine and free cotinine were higher in African Americans compared with European Americans, 8.8 versus 6.0 nmol/ml (p = 0.02) and 6.1 versus 4.4 nmol/ml (p = 0.01), respectively. Between ethnic groups there were no statistically significant differences in total nicotine (p = 0.07), total cotinine (p = 0.54), or total trans-3′-hydroxycotinine (p = 0.1). The correlation between total nicotine and total cotinine was 0.70 (p < 0.0001). Mean nicotine equivalents were 77.4 and 61.7 nmol/ml among African Americans and European Americans, respectively (p = 0.09). Notably, mean nicotine equivalents per cigarette were higher for African Americans compared with European Americans, 4.7 versus 3.0 nmol/ml (p = 0.02).
At baseline, the percentage of nicotine excreted as its glucuronide was 51.4 and 57.4% among African Americans and European Americans, respectively (p = 0.05). The percentage of cotinine excreted as its glucuronide was lower among African Americans compared with European Americans, 71.2 versus 79.8% (p = 0.01). The correlation between percentage of nicotine and cotinine glucuronidation was 0.63 (p < 0.0001).
There was no difference in the mean trans-3′-hydroxycotinine/cotinine ratio (total/total) by ethnicity at baseline. The ratio had an overall range of 0.1 to 3.7. The mean ratios were 1.5 ± 1.0 and 1.1 ± 0.6 among African Americans and European Americans, respectively (p = 0.17). There was also no ethnic difference if the ratio was calculated as total trans-3′-hydroxycotinine to free cotinine (p = 0.92). However, the correlation between total trans-3′-hydroxycotinine and total cotinine concentration was lower among African Americans than European Americans, 0.36 versus 0.72, with 95% confidence intervals of 0.002 to 0.637 and 0.456 to 0.864, respectively (p = 0.06).
We analyzed predictors of the glucuronidation ratio during smoking (Table 2). In univariate comparisons, the strongest correlation was between the glucuronidation ratio and trans-3′-hydroxycotinine/cotinine ratio (−0.56; p < 0.0001). In addition, a low glucuronidation ratio was correlated with African American ethnicity, male gender, and lower nicotine equivalents. In a multivariate model, African American ethnicity, low nicotine equivalents, and a high trans-3′-hydroxycotinine/cotinine ratio were significant predictors of low cotinine glucuronidation with an adjusted r2 value of 0.50 (Table 3).
Urinary nicotine metabolites in smokers by UGT2B10 haplotypea
Values are mean (S.D.).
In Vitro Nicotine Glucuronidation by Human Liver Microsomes.
Nicotine glucuronidation was characterized in vitro for 28 liver samples (14 from African American donors) that were genotyped for UGT2B10 D67Y. Correlation between p-nitrophenol-O-glucuronidation and nicotine-N-glucuronidation was r = 0.4. A 50-fold variation was observed in glucuronidation activity when liver microsomes were incubated with either 0.5 or 5 mM nicotine [range, 1.1–51 (mean 14.7) and not detectable (<15) to 112 (mean 46.4) pmol/min/mg protein, respectively]. Mean nicotine glucuronidation activity was not different between samples obtained from African American and European American donors at both nicotine concentrations, 15.1 ± 12 versus 14.3 ± 13 pmol/min/mg protein (p = 0.90), respectively, at 0.5 mM nicotine. Unlike ethnicity, UGT2B10 genotype did seem to predict nicotine glucuronidation (Fig. 3). The UGT2B10 D67Y variant was present in two African American and six European American samples. The mean rate of nicotine glucuronidation was 46 to 50% lower for D67Y samples at both nicotine concentrations compared with wild-type, 8.1 pmol/min/mg protein compared with 17.5 pmol/min/mg protein (p = 0.07) at 0.5 mM nicotine. Due to the small sample numbers, the power to detect a difference in the means was limited.

In vitro nicotine glucuronide conjugation by UGT2B10 haplotype. Human liver microsomes were incubated with 0.5 mM [3H]nicotine (specific activity, 25 nCi/nmol) and 5 mM UDPGA.
Relationship of Nicotine and Cotinine Glucuronidation in Vivo to UGT2B10 Haplotype.
DNA was available from only 32 subjects in the patch study (18 African Americans and 14 European Americans). These subjects were genotyped for the UGT2B10 D67Y allele (Chen et al., 2008). In this small number of subjects there was no evidence that the D67Y allele was more common in African American individuals. Five participants, three African Americans and two European Americans, were heterozygous and one African American was homozygous for the D67Y allele. No statistical differences were observed in nicotine metabolites by genotype. It is interesting that the percentage of nicotine and cotinine glucuronidation in the single homozygous D67Y variant was low, 7.5 and 11.9%, respectively.
In a second population of smokers, for which both urinary nicotine metabolites and DNA were available, we further investigated the relationship of the UGT2B10 D67Y variant to nicotine and cotinine metabolism in vivo. Nicotine metabolite data on this population had been previously gathered (Hecht et al., 2004; Murphy et al., 2004). For the current study, participants were genotyped for the UGT2B10 haplotype that is tagged by the rs7657968 SNP and linked to D67Y (haplotype C) (Chen et al., 2008). Genotyping results were concordant in the subset of samples, which included all heterozygous individuals that were analyzed by two RFLP analyses and DNA sequencing. D67Y was detected as a G>T substitution at nucleotide + 199, and this co-occurred with a synonymous SNP at nucleotide 111 (T>C) as reported previously (Chen et al., 2008). The allele frequency was 0.11 and was in Hardy-Weinberg equilibrium. The mean percentage of glucuronidation and glucuronidation ratio of urinary metabolites in these smokers was determined for each haplotype (Table 3). Using either measure the extent of glucuronide conjugation for both cotinine and nicotine was significantly lower among smokers who were heterozygous for UGT2B10 D67Y relative to smokers with no D67Y alleles. Moreover, nicotine equivalents were significantly lower among individuals with a UGT2B10 D67Y allele (Table 3); the mean was 35% lower than wild type. The distribution of percentage of cotinine excreted as a glucuronide was related to UGT2B10 genotype (Fig. 4). However, there were wild-type individuals who excreted less than 10% cotinine as its glucuronide conjugate and heterozygotes excreting as much as 80% cotinine as a glucuronide conjugate.

Percentage of cotinine excreted as its glucuronide in 24-h urine by UGT2B10 genotype.
Discussion
Higher free cotinine levels have been consistently reported among African Americans compared with European Americans (Wagenknecht et al., 1990; Caraballo et al., 1998; Kandel et al., 2007). To the extent that higher cotinine levels reflect higher nicotine exposure and correspondingly exposure to tobacco carcinogens, higher cotinine could explain a portion of the increased cancer risk observed among African Americans. In our study, as observed previously (Perez-Stable et al., 1998; Benowitz et al., 1999), African Americans received a higher dose of nicotine per cigarette than European Americans, presumably due to a difference in smoking behavior. However, differences in nicotine metabolism independent of dose per cigarette also contribute to ethnic differences in free cotinine levels. Here, we report that among abstinent smokers on the nicotine patch, African Americans excreted less nicotine and cotinine as their glucuronide conjugates than European Americans. It is important that the observed difference in glucuronidation occurs in the absence of exposure to other constituents in tobacco smoke. Higher free cotinine among African Americans was accounted for by lower glucuronide conjugation in the controlled dose setting.
In an elegant pharmacokinetic study of nicotine and cotinine, Benowitz et al. (1999) reported that nicotine and cotinine glucuronidation, as well as cotinine clearance, cotinine half-life, and the conversion of nicotine to cotinine were lower in African American compared with European American smokers. They concluded from their study that cotinine and nicotine metabolism is slower in African Americans, due in part to decreased N-glucuronidation and also to decreased oxidation. However, the observed ethnic difference in cotinine's pharmacokinetic parameters could all be explained by decreased cotinine glucuronidation. The metabolic clearance of nicotine to cotinine, as defined by the authors is significantly influenced by the clearance of cotinine, which was 25% lower in African Americans (Benowitz et al., 1999). Therefore, decreased cotinine glucuronidation not decreased nicotine oxidation may be driving the reported decrease in the metabolic clearance of nicotine to cotinine. In the present study, there was no evidence that nicotine C-oxidation differed between African Americans and European Americans. Neither the urinary trans-3′-hydroxycotinine concentration nor the ratio of trans-3′-hydroxycotinine/cotinine was significantly different in these two ethnic groups.
The urinary trans-3′-hydroxycotinine/cotinine ratio is highly correlated with the plasma trans-3′-hydroxycotinine/cotinine ratio and is used as a biomarker for P450 2A6 activity (Benowitz et al., 2003). Yet, Swan et al. (2009) reported that variation in the urine ratio is greater than the plasma ratio and it is likely influenced by the contribution of other genes. We observed that glucuronidation is associated with the urinary trans 3′-hydroxycotinine/cotinine ratio (in both studies reported here), and contributes to variation in this ratio. Consequently, caution is warranted in comparing the urinary nicotine metabolite ratio as a marker of P450 2A6 activity between populations with different phenotypic variation of cotinine glucuronidation.
Because the majority of African Americans smoke menthol cigarettes compared with a minority of European Americans, this has been proposed as an explanation for ethnic differences in nicotine metabolism. However, in a recent study of both African American and European American smokers of menthol cigarettes, no difference in urinary nicotine metabolites was observed between menthol and nonmenthol cigarette smokers (Heck, 2009). In addition, in a large study of young adult smokers (n = 1424), use of menthol cigarettes did not explain higher cotinine levels among African Americans compared with European Americans, and African Americans who smoked nonmentholated cigarettes (n = 89) still had higher cotinine (Wagenknecht et al., 1990). In our study, menthol was not a factor because the half-life of menthol is approximately an hour, and all participants had not smoked mentholated cigarettes for a period of 4 days before sample collection (Gelal et al., 1999).
Differences in glucuronidation that result from differences at the enzyme level, due to variation in enzyme amount or activity, could be confirmed in vitro. We compared the in vitro glucuronidation of nicotine by human liver microsomes prepared from African American and European American donor tissue. Regretfully, the availability of liver tissue from African American donors was limited and in the small in vitro study no ethnic difference in nicotine glucuronidation was observed. However, UGT2B10 haplotype seemed to predict low versus high rates of nicotine glucuronidation independent of donor ethnicity. The UGT2B10 D67Y variant was present in samples from both African Americans and European Americans. We expect that this polymorphism affects nicotine metabolism in both populations, and that it is unlikely to explain the observed decreased levels of glucuronidation in African Americans compared with European Americans. However, an uncharacterized variant in UGT2B10 may well contribute.
UGT2B10 is the most efficient catalyst of nicotine and cotinine glucuronidation in vitro and it is predicted to be the major enzyme responsible for nicotine and cotinine glucuronidation in smokers (Chen et al., 2007; Kaivosaari et al., 2007). This is the first report of in vivo nicotine and cotinine glucuronidation by UGT2B10 haplotype, and our finding that smokers with a variant D67Y allele had decreased excretion of glucuronide conjugates provides convincing evidence that UGT2B10 significantly contributes to nicotine metabolism in vivo. However, as illustrated in Fig. 4, the D67Y UGT2B10 variant is clearly only one contributor to nicotine and cotinine glucuronidation. The relatively high percentage of cotinine glucuronidation in some individuals heterozygous for this variant could be due to either variation in UGT2B10 expression or the contribution of UGT1A4, as a second catalyst of cotinine glucuronidation.
It is interesting that individuals with the UGT2B10 D67Y variant had lower nicotine equivalents than individuals without this allele, and in both studies reported here, individuals with a low glucuronidation phenotype (irrespective of genotype) had lower nicotine equivalents while smoking ad libitum. The potential role of UGT2B10 on smoking behavior merits further investigation based on these intriguing and novel findings.
We expect that differences in UGT2B10 activity, due to genetic or environmental factors, will affect the disposition of drugs and xenobiotics, beyond nicotine. For example, UGT2B10 was reported to catalyze the metabolism of the analgesic medetomidine, and its role in the metabolism of other drugs that undergo N-glucuronidation is being investigated (Kaivosaari et al., 2008). UGT2B10 has been shown to catalyze the N-glucuronidation of the tobacco carcinogen 4-(methylnitrosamino)-1-(3-pyridyl)-1-butanol in vitro and is predicted to contribute to its detoxification in vivo (Lazarus et al., 2005; Chen et al., 2008). UGT2B10 activity may modulate cancer risk through an effect on smoking behavior or carcinogen metabolism. In brief, low UGT2B10 activity, independent of ethnicity may have important health consequences.
Acknowledgments
We thank Elizabeth Thompson, Jodi Blustin, and Gregory Blaufuss for assistance in preparing samples, genotyping, and quantifying nicotine metabolites. We thank Dr. Jasit Ahluwalia and the University of Minnesota Office of Clinical Research for generous support.
Footnotes
-
This work was supported in part by the National Institutes of Health National Institute on Drug Abuse [Grants DA13333, 1F30-DA020968]; and the National Institutes of Health National Institute of General Medical Sciences [Grant MSTP T32-GM08244] (Medical Scientist Training Program).
-
Article, publication date, and citation information can be found at http://jpet.aspetjournals.org.
doi:10.1124/jpet.109.159855
-
ABBREVIATIONS:
- cpd
- cigarettes per day
- P450
- cytochrome P450
- UGT
- UDP glucuronosyltransferase
- TRIP
- Tobacco Reduction Intervention Program
- GC/MS
- gas chromatography/mass spectrometry
- RFLP
- restriction fragment length polymorphism
- SNP
- single-nucleotide polymorphism
- HPLC
- high-performance liquid chromatography
- UDPGA
- UDP-glucuronic acid.
- Received August 3, 2009.
- Accepted September 21, 2009.
- © 2010 by The American Society for Pharmacology and Experimental Therapeutics


