Article Text

Abstract
England was the first European country to pursue a systematic policy to reduce socio-economic inequalities in health. This paper assesses whether this strategy has worked, and what lessons can be learnt. A review of documents was conducted, as well as an analysis of entry-points chosen, specific policies chosen, implementation of these policies, changes in intermediate outcomes, and changes in final health outcomes. Despite some partial successes, the strategy failed to reach its own targets, that is, a 10% reduction in inequalities in life expectancy and infant mortality. This is due to the fact that it did not address the most relevant entry-points, did not use effective policies and was not delivered at a large enough scale for achieving populationwide impacts. Health inequalities can only be reduced substantially if governments have a democratic mandate to make the necessary policy changes, if demonstrably effective policies can be developed, and if these policies are implemented on the scale needed to reach the overall targets.
- Health policy
- public health epidemiology
Statistics from Altmetric.com
Introduction
Over the past three decades, research into socio-economic inequalities in health has gradually moved from description to explanation to intervention.1 As a result, some European countries have been able to start systematic government action to reduce health inequalities. England has been the first to enter this stage, after a failed attempt in the early 1980s. The Black report, commissioned by a Labour government to investigate the causes and possible remedies for Britain's undiminished social class inequalities in mortality, had proposed a radical change in social and healthcare policies but had disappeared in a desk drawer after the Conservatives won the 1979 elections.2 However, research continued, and when Labour came back into power almost 20 years later, it again commissioned an expert report to bring together all the evidence—the Independent Inquiry into Inequalities in Health3—and developed a comprehensive programme to tackle health inequalities.
England has been followed by a small number of other countries which have all developed and (partly) implemented national strategies to reduce health inequalities, including The Netherlands,4 Sweden,5 Norway6 and Finland.7 While all these strategies are similar at the surface, the English strategy stands out as having been more systematically developed, better resourced, more stringently implemented and more extensively monitored. Furthermore, the Labour government has stayed in power for a long time, and was in a position to pursue its goal to reduce health inequalities for a unique 13 years. The strategy has come to an end with the 2010 parliamentary elections and the formation of a Conservative/Liberal Democrat coalition government. It is therefore extremely important to know whether the English strategy has worked, and what are the lessons to be learnt. Can we reduce health inequalities?
English strategy to reduce health inequalities
The English strategy to reduce health inequalities was shaped in two steps (table 1). The first was in 1999, when the Department of Health issued ‘Reducing health inequalities: an action report.’8 This was the government's response to the ‘Independent Inquiry into Inequalities in Health,’ which had been published in 1998 and had made 39 recommendations with 123 subclauses, ranging from higher living standards of households in receipt of social security benefits to improvements in school nutrition, and from improved housing insulation to more equitable allocation of resources within the National Health Service.3 One of the reasons for the delay between the 1997 elections and the 1999 Action report was that the Labour party had promised not to exceed the previous government's spending commitments in the first 2 years after their takeover.
Short history of the English strategy to reduce health inequalities
The 1999 ‘Action Report’ adopted many of these recommendations and claimed that ‘[t]his is the most comprehensive programme of work to tackle health inequalities ever undertaken in this country.’ It listed a range of new government policies including the introduction of a national minimum wage, higher benefits and pensions, and substantially increased spending on education, housing, urban regeneration and healthcare. It also announced a number of specific initiatives including the ‘Sure Start’ programme (free childcare, early education and parent support for low-income families), ‘Health Action Zones’ (local strategies to improve health in deprived areas) and a series of antitobacco policies (including free nicotine-replacement therapy for low-income smokers).8
The second step followed in 2003 after the publication of the ‘Cross-Cutting Review of Health Inequalities,’ a systematic assessment by government of its progress in tackling health inequalities. This took as its starting-point the two national health inequalities targets, suddenly announced by the Secretary of State for Health in 2001, to narrow the gap in life expectancy between areas and the difference in infant mortality across social classes by 10% in 2010. The Cross-Cutting Review tried to identify the most significant interventions that would support the delivery of these targets, by quantifying the contribution that the interventions would make to reducing inequalities in specific health outcomes.9
In response to this analysis the Department of Health published a revised strategy in 2003, entitled ‘Tackling health inequalities: a Program for Action.’ It had a foreword by the Prime Minister, Tony Blair, and set out the government's plans to achieve the two health inequalities targets by 2010. It reiterated the need to tackle the structural ‘upstream’ determinants of health inequalities, but it had a stronger emphasis on ‘downstream’ policies than the 1999 Action Report. Key interventions expected to contribute to closing the life expectancy gap were reducing smoking in manual social groups, managing other risks for coronary heart disease and cancer (poor diet and obesity, physical inactivity, hypertension), improving housing quality by tackling cold and dampness, and reducing accidents at home and on the road.10
The strategy was structured around the two overall targets, and underpinned by 12 ‘headline indicators’ (specific targets for intermediate outcomes) and 82 ‘departmental commitments’ (specific actions by various governmental departments) which together were expected to ensure the timely delivery of the targets. The departmental commitments included further poverty reduction efforts, improved educational outcomes, expansion of the Sure Start scheme, expansion of smoking cessation services, improvement of primary care facilities in inner cities, and improved access to treatment for cancer and cardiovascular disease. Many of the departmental commitments were explicitly targeted towards low-income groups or deprived areas, and most were quantified in terms of numbers of people to be reached and budgets to be allocated. The total budget exceeded £20 billion.10
The government's commitment to reducing health inequalities was matched by a commitment to critically review, revise and then rereview its policies (table 1). As a result of these frequent self-reflections, it is relatively easy, even for outsiders, to gauge the results of the English strategy to reduce health inequalities.
Evaluation of the English strategy to reduce health inequalities
Key results of the analysis are displayed in tables 2 and 3, and figure 1.
What happened? ‘Departmental commitments’ in the 2003 ‘Program for Action,’* their relevance to the targets and their achievement
What happened? ‘Headline indicators’ in the 2003 ‘Program for Action,’* their relevance to the targets and their achievement

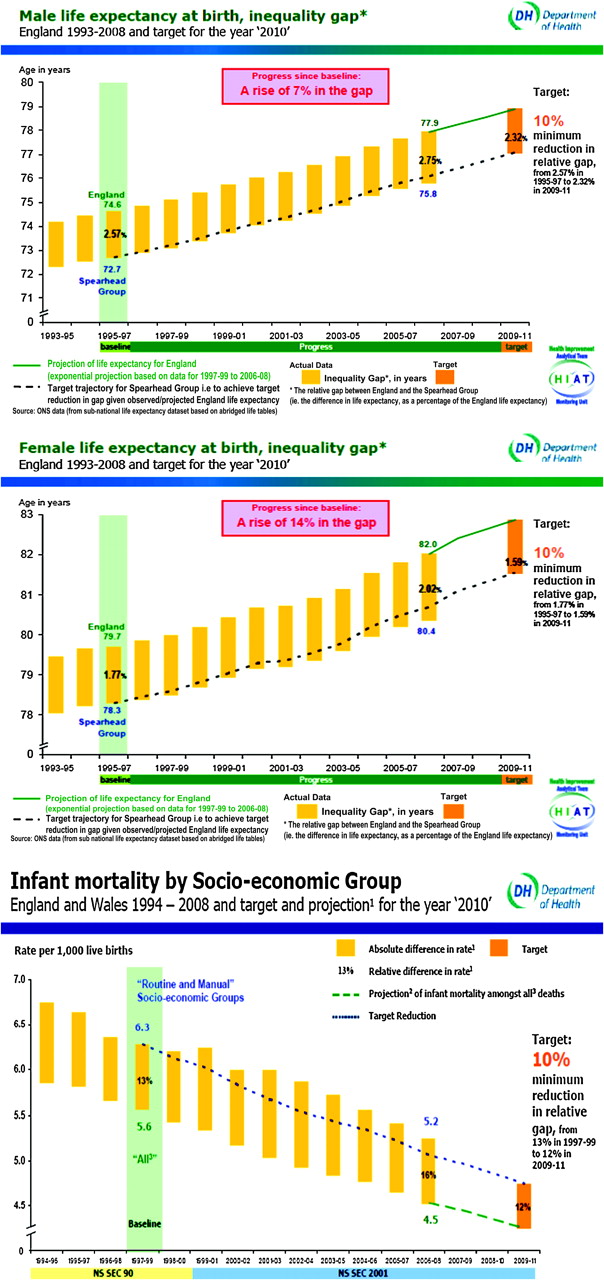
Did final health outcomes respond? Trends in the gaps in life expectancy and infant mortality since the targets were set. Source: Mortality Target Monitoring (Life Expectancy and All-age All-cause Mortality, Overall and Inequalities)16 and Mortality Target Monitoring (Infant Mortality, Inequalities) Update to Include Data for 2008.17
Were the entry-points for policy adequately chosen, given the overall targets?
Most of the policies addressed one or more determinants of health inequalities, but as is evident from the tables, only a few had direct relevance for achieving the life expectancy or infant mortality targets by the year 2010. A few policies related to underlying determinants of health inequalities, but effects on inequalities in life expectancy were unlikely either because any prevented deaths are relatively rare (as in the case of homelessness or fuel poverty) or because they will occur in a future far beyond 2010 (as in the case of child poverty, education and pathways to work). There were no policies addressing income inequality as such, or other important determinants of health inequalities such as working conditions and excessive alcohol consumption. While some policies directly addressed the main causes of adult death, they aimed at improving average access to treatment, not inequalities in access (as in the case of improving access to cancer or coronary heart disease services). Only a few policies in the fields of prevention and primary care (eg, road safety, smoking cessation, diet, flu vaccination, access to primary care) addressed entry-points which were directly relevant for achieving the life expectancy target in 2010. A similar story applies to the infant-mortality target.
That the match between targets and policies was far from optimal probably relates to the fact that the 1999 ‘Action Report’ and the 2003 ‘Program for Action’ were as much a product of scientific evidence as of political opportunity. The ‘Independent Inquiry into Inequalities in Health’ had resulted in a huge ‘shopping list’ from which policy-makers could freely choose.18 Many of the policies included in the programme were part of strategies which the government already pursued for other reasons, for example because it had decided to invest in better education or to upgrade the funding level of the National Health Service upgraded to the European Union average. There were also no explicit and quantified links between departmental commitments, headline indicators and overall targets, and the overall targets had been chosen without regard to the policies they would require. The ‘Program for Action’ therefore was only a loose attempt to link targets and policies.
Were the specific policies to address these entry-points adequately chosen?
Ideally, the 1999 ‘Action Report’ and the 2003 ‘Program for action’ should have been based on evidence of the effectiveness of specific policies, but at the time this scientific evidence base simply did not exist. This can easily be seen in the 1998 ‘Independent Inquiry’ which laid the basis for the English strategy to reduce health inequalities but did not list a single evaluation study which showed that the proposed interventions could actually reduce inequalities in health. All the evidence was from observational studies showing plausible entry-points for intervention at most.3
Although this has been commented on at the time, the lack of an adequate evidence base seems to have been ignored by most of those involved in the development of this strategy, probably because it was felt that this extraordinary window of opportunity should be used for action on health inequalities, and that no time could be lost on evaluating policies before they were implemented on a large scale.19 Instead, attempts were made to assess the effects of these policies while they were implemented, but as a result most of these evaluations had a weak, non-experimental design.
Collecting evidence on effectiveness of policies to reduce health inequalities is difficult, because these are mostly complex interventions and should be evaluated not only for their effectiveness but also for their differential effectiveness.20 It was only around 2005 that the need to collect evidence on differential effectiveness of policies clearly came into focus. Reviews appearing in the second half of the decade then unambiguously showed the almost complete lack of existing evidence. ‘Umbrella reviews’ of population tobacco control policies and policies on wider social determinants showed that where systematic reviews dealt with differential effects by socio-economic status, only a minority actually found some weak evidence for inequalities reduction.21 22
It is therefore impossible to say whether the policies were adequately chosen. A scientifically rigorous answer would be ‘no,’ but for those who accept the urgency argument, the answer could be ‘this would have to be determined during implementation.’
Were these policies successfully implemented on the scale needed for populationwide impacts?
Without any doubt, the English strategy was implemented on a large scale. As shown in table 2, many of the ‘departmental commitments’ had large budgets, and some (such as the commitments towards child poverty reduction, social housing quality improvement and expansion of the Sure Start scheme) had budgets in excess of £1 billion or even £10 billion (ie, €1.5 billion or €15 billion at the former exchange rate).10 This is by far the best resourced of all the Western European strategies to reduce health inequalities which started during the decade. Remarkably, these ‘departmental commitments’ were also mostly met (table 2). Nevertheless, when one starts looking in more detail, a number of problems come to light.
First, during the implementation of the 2003 ‘Program for Action,’ many changes were made to the original plans. To some extent, these reflected ‘learning by doing’: adapting the strategy to experiences in the field, and also to new insights which had emerged. For example, during the implementation of the strategy, a stronger emphasis was placed on a limited number of ‘spearhead areas’ (areas with a concentration of social and health deprivation), because it was felt that focusing on these areas was likely to generate better results. It then seemed logical to also rephrase the overall life expectancy target in terms of differences between these spearhead areas and the national average. However, the speed with which policies were changed and evaluation targets adapted made partnership working and policy learning practically impossible.14
Second, as mentioned above, the ‘departmental commitments’ were not based at all on an analysis of what would be needed to reduce health inequalities. Thanks to a ‘health inequalities intervention tool’ which became available in 2007, the scale at which policies need to be delivered gradually became clear. This revealed many examples of misalignment of ‘departmental commitments,’ ‘headline indicators’ and overall targets. For example, even if the headline indicator for the ‘major killers’ were met, the life expectancy target would not have been achieved.15
Do changes in intermediate outcomes suggest that the policies were effective?
That the ‘departmental commitments’ were insufficient to achieve the targets became quite clear in the 2007 ‘Status Report.’ This concluded that while almost all departmental commitments were wholly or substantially achieved (table 2), the headline indicators and outcome targets showed a more disappointing picture (table 3). Some of the headline indicators showed reduced inequalities (less child poverty and narrowing inequalities in housing quality, educational attainment and uptake of flu vaccinations), but others suggested stable or even increased relative inequalities between socio-economic groups (heart disease and cancer mortality, child road accidents, teenage pregnancies, smoking).11
That some of the ‘headline indicators’ showed narrowing inequalities is a major achievement of the strategy. Unfortunately, however, no favourable changes were seen for some of the main drivers of inequalities in life expectancy or infant mortality, such as smoking. At the population level, smoking went down both in manual and in non-manual groups, and at a similar absolute rate of decline. For example, among men in the manual group the prevalence of smoking declined from 34% in 2001 to 28% in 2008, while it declined from 22% to 16% among men in the non-manual group.23 As a result, while absolute inequalities in smoking remained stable, relative inequalities in smoking prevalence increased. Similarly, although absolute inequalities in mortality from cardiovascular disease declined, relative inequalities increased.12
Not included in the headline indicators, because it did not relate to government objectives, is income inequality. Inequalities in income and wealth in England have remained unchanged or even widened during 13 years of Labour government, although at a slower speed than during the previous decades.24
Mixed intermediate outcomes also emerge from the evaluation studies which have been conducted for a number of specific policies. Health Action Zones could loosely be evaluated but the authors concluded that these ‘made little impact in terms of measurable improvement in health outcomes during their short lifespan.’25 The evaluation of the Sure Start programme concluded that ‘there are some signs that Local Sure Start Programs may be effective,’ but no health outcomes indicative of health inequalities reduction were observed.26 Despite large-scale implementation of smoking cessation services in deprived areas, the evaluation study showed that they made only a tiny contribution to reducing inequalities in smoking.27
The latter study is particularly interesting because it showed how important the scale of implementation is for achieving populationwide impacts. Despite huge efforts, only 2.3% of smokers in the lowest socio-economic group were reached by the programme and made a quit attempt, against 1.3% of smokers in the highest socio-economic group. After 1 year, only 0.42% of all smokers in the lowest socio-economic group had successfully quit, against 0.17% of all smokers in the highest socio-economic group.27
Did final health outcomes respond, as specified in the overall targets?
In view of these intermediate outcomes, it is not surprising that the overall targets have not been met. This already became clear in the 2007 ‘Status Report,’11 and was confirmed by subsequent independent evaluations, including the 2009 ‘Tackling Health Inequalities: 10 Years On’ review. This pointed to ‘significant improvements in the health of the population over the last 10 years, an improvement almost wholly shared by disadvantaged groups and areas, as measured by life expectancy and infant mortality.’ However, ‘[h]ealth inequalities between different groups and areas and the whole population […] persist’ and ‘[t]he current data […] shows that the gap is no narrower than when the targets were first set.’12
Figure 1 shows the most recent update of progress towards the life-expectancy and infant-mortality targets. The life-expectancy target, specified in terms of the gap between ‘spearhead areas’ and the national average, does not show any sign of narrowing—if anything, the gap has grown. Life expectancy has gone up in spearhead areas, but the national average has improved at a higher speed.16 The picture is not better for the gap in life expectancy between occupational classes—absolute inequalities in life expectancy have not narrowed since before Labour came to power in 1997, and have even widened for women.14 Similar results are found for the gap in infant mortality17 (figure 1).
One may ask whether it is not too early to assess the strategy's effect on inequalities in life expectancy. The timeline linking determinants to infant mortality may be short, but the timeline linking determinants to life expectancy may stretch over decades. That is theoretically true, but it does not stop life expectancy from changing rapidly—as can be seen in figure 1, life expectancy in ‘spearhead areas’ increased by 2–3 years in the 10 years since the baseline for the targets was set. The ‘problem’ is that life expectancy in non-spearhead areas (or in higher socio-economic groups) has increased even more rapidly. It seems that the strategy has been unsuccessful in harnessing the underlying forces to help to reduce, instead of widen, the gap.
One may also ask what would have happened in the absence of the English strategy to reduce health inequalities: would the gap in life expectancy or infant mortality have widened even more? Possibly: several European countries have witnessed a widening of inequalities in life expectancy over the past decades,28 and the ‘spontaneous’ trend in England may therefore also have been towards a widening of the gap. As shown in table 3, the strategy has had some favourable effects which may have contributed to less widening. This attenuation is likely to have been modest in size, however, because an unambiguous narrowing of the gap for a headline indicator relevant for inequalities in life expectancy was only seen for flu vaccinations (tables 2 and 3).
Finally, one may ask whether these targets were not simply ‘inspirational’ goals, intended to provide a general policy direction, instead of success criteria for which those responsible for the strategy could be held accountable. From the documents published by and for the Department of Health, however, it is quite clear that they were intended to be success criteria but also have actually been used as such.15–17 Although the Department of Health at the time was warned that achieving these targets might be difficult or impossible,29 it is reasonable to ask whether it would have been possible to justify the expense if the targets had been less ambitious.
Remarkably, the 2010 Marmot review argued that the targets were not ambitious enough. It criticised the life expectancy and infant mortality targets because ‘the current target does not capture the social gradient in health or the more complex patterning of health associated with other groups (eg, ethnic groups)’ and ‘mortality [does] not reflect health status or other dimensions of well-being through the life course.’14 This may be true, but would it not have been even more impossible to create and implement a strategy that would have achieved a 10% reduction in health inequalities across the whole gradient, or a 10% reduction in inequalities in healthy life expectancy, a new measure advocated by the Marmot review?
Reflections
This remarkable story contains a number of important lessons for all those engaged with studying and eventually reducing socio-economic inequalities in health. The 13-year period started in high spirits, and promised to be a period of harvesting the practical results of two decades of research into the determinants of health inequalities. It has become clear, however, that reducing health inequalities is much more difficult than most researchers had foreseen.30
From the analysis presented above, it appears that, in terms of its own targets, the English strategy has failed. It has had some partial successes, which should not be ignored, but it has unfortunately not been possible to reduce health inequalities as measured by inequalities in life expectancy or infant mortality. Other data, not reported here, show that other overall health measures (such as measures of self-reported health) do not show a narrowing of inequalities either.14
Why was this strategy not more successful? The analysis presented in the preceding paragraphs suggests the following clues. First, the English strategy did not address the correct entry-points: it spent resources on entry-points which were irrelevant for life expectancy or infant mortality, at least within the chosen time frame, and it ignored relevant entry-points such as income inequality, working conditions and excessive alcohol consumption. Second, it did not use effective policies: it had to rely on policies of unproven effectiveness, and to the extent that policies were evaluated during implementation, most proved to be largely ineffective in reducing inequalities in health outcomes. Third, it was not delivered at a large enough scale: the scale required for achieving populationwide impacts was not determined in advance, and where reach was part of the evaluation as in the case of smoking cessation, it proved to be insufficient to reduce inequalities at the population level.
Are these failures caused by a lack of determination on the part of the government? Tony Blair's Labour government has been criticised for not being serious enough about tackling inequalities, and being indifferent to income inequalities.31 It has also been criticised for its neoliberal public health philosophy, which emphasised personal responsibility for behaviour change at the expense of attention to underlying determinants.32 But for those who are familiar with the situation in other Western European countries, it is clear that determination is a relative issue—with all its weaknesses, this Labour government probably was the most determined European government ever to tackle health inequalities.
The explanation should be sought elsewhere. First, the suboptimal choice of entry-points reflects the necessity for this (or any) government to match scientific evidence with political opportunity, and the lack of a democratic mandate to take more radical action. Labour had been elected on the basis of a party programme that simply did not include a radical redistribution of income or wealth. Second, the choice of inadequate policies reflects the almost complete lack of scientific evidence on differential effectiveness. This in its turn was due to the relatively short time which had elapsed between the identification of the determinants of health inequalities (mostly in the 1980s and 1990s) and the urgent need of a newly elected and eager government to be advised on what it could do to tackle health inequalities. Third, the insufficient scale of implementation reflects a fundamental discrepancy between the necessary scale of change and the ability of state bureaucracies to change in response to new priorities.33 This is painfully illustrated by the House of Commons' critique of the slowness of change within the National Health Service, where, despite a resource-allocation formula which prioritises those in most need, disadvantaged areas after many years still receive much less than their full needs-based allocations.13
If this analysis is correct, then the way forward includes the following ingredients. First, we need more advocacy to make sure that elected governments have a democratic mandate to make the necessary policy changes. Reducing health inequalities requires large-scale policy change in many fields, and this change will have to be articulated in political party programmes. For example, if a redistribution of income and wealth is necessary to reduce health inequalities, as many social epidemiologists and public health professionals believe, then they will have to convince the electorate that this should be done. Second, we need more research into differential effectiveness of policies. This research can only be done appropriately if policies are systematically tested out before they are widely implemented. Third, the necessary scale of implementation can only be achieved by more focused policy efforts, based on careful alignment of targets, commitments and delivery. Strategies need to focus exclusively on strategic drivers of health inequalities, and make sure that the scale of implementation of policies matches the numbers of people that need to be reached and the degree of environmental or behaviour change to be induced.
In conclusion, over the past decade the health-inequalities field in Europe has entered the stage of systematic policy development and implementation. During the last 13 years, England has led the way and set an extremely valuable example. In contrast to what other commentaries have suggested,34 there has been real progress since the Black Report. When compared with the more recent strategies pursued in other countries, the English strategy still compares very favourably. For example, the Finnish strategy (summarised in table 4) addresses largely similar entry points but contains a smaller number of specific policies. As in the English strategy, most of these policies are of unproven effectiveness. The Finnish strategy, however, has a much weaker implementation plan: there is no attempt at aligning the overall target with intermediate targets and delivery commitments, and there are no specific budget allocations.7
Finnish strategy to reduce health inequalities (2008–2011)*
Unfortunately, the meagre results of the superior English strategy suggest that substantially reducing inequalities in overall health is currently beyond our means. Even if we were to have demonstrably effective policies (which we do not), we would probably be unable to deliver them on a sufficiently wide scale within a realistic window of political opportunity. For the foreseeable future, therefore, we need less ambitious aims, more focused approaches and more rigorous evaluation.
What is already known on this subject
Over the past three decades, research into socio-economic inequalities in health has gradually moved from description to explanation to intervention.
England has been the first European country to enter the stage of systematic government action to reduce health inequalities.
Despite many evaluation reports, England's 13-year strategy to reduce health inequalities has not been comprehensively analysed so far.
What this study adds
Despite some partial successes, the strategy failed to reach its own targets, that is a 10% reduction in inequalities in life expectancy and infant mortality.
The analysis shows that this is due to the fact that the strategy did not address the most relevant entry-points, did not use effective policies and was not delivered at a large enough scale for achieving population wide impacts.
Health inequalities can be reduced substantially only if governments have a democratic mandate to make the necessary policy changes, if demonstrably effective policies can be developed and if these policies are implemented on the scale needed to reach the overall targets.
For the foreseeable future, less ambitious aims, more focused approaches and more rigorous evaluation are needed.
References
Footnotes
See Commentary, p 594
This paper is based on the 2010 Pemberton lecture, held at the annual scientific meeting of the Society for Social Medicine in Belfast, 6 September 2010.
Competing interests None.
Patient consent Obtained.
Provenance and peer review Not commissioned; externally peer reviewed.
Linked Articles
- Feature section: interventions