Central overweight and obesity in British youth aged 11–16 years: cross sectional surveys of waist circumference
BMJ 2003; 326 doi: https://doi.org/10.1136/bmj.326.7390.624 (Published 22 March 2003) Cite this as: BMJ 2003;326:624
- H David McCarthy, senior lecturer (d.mccarthy{at}londonmet.ac.uk)a,
- Sandra M Ellis, research studenta,
- Tim J Cole, professor of medical statisticsb
- a Department of Health and Human Sciences, London Metropolitan University, London N7 8DB
- b Centre for Paediatric Epidemiology and Biostatistics, Institute of Child Health, London WC1N 1EH
- Correspondence to: H D McCarthy
- Accepted 22 January 2003
Abstract
Objective: To compare changes over time in waist circumference (a measure of central fatness) and body mass index (a measure of overall obesity) in British youth.
Design: Representative cross sectional surveys in 1977, 1987, and 1997.
Setting: Great Britain.
Participants: Young people aged 11–16 years surveyed in 1977 (boys) and 1987 (girls) for the British Standards Institute (n=3784) and in 1997 (both sexes) for the national diet and nutrition survey (n=776).
Main outcome measures: Waist circumference, expressed as a standard deviation score using the first survey as reference, and body mass index (weight(kg)/height(m)2), expressed as a standard deviation score against the British 1990 revised reference. Overweight and obesity were defined as the measurement exceeding the 91st and 98th centile, respectively.
Results: Waist circumference increased sharply over the period between surveys (mean increases for boys and girls, 6.9 and 6.2 cm, or 0.84 and 1.02 SD score units, P<0.0001). In centile terms, waist circumference increased more in girls than in boys. Increases in body mass index were smaller and similar by sex (means 1.5 and 1.6, or 0.47 and 0.53 SD score units, P<0.0001). Waist circumference in 1997 exceeded the 91st centile in 28% (n=110) of boys and 38% (n=147) of girls (against 9% for both sexes in 1977-87, P<0.0001), whereas 14% (n=54) and 17% (n=68), respectively, exceeded the 98th centile (3% in 1977-87, P<0.0001). The corresponding rates for body mass index in 1997 were 21% (n=80) of boys and 17% (n=67) of girls exceeding the 91st centile (8% and 6% in 1977-87) and 10% (n=39) and 8% (n=32) exceeding the 98th centile (3% and 2% in 1977-87).
Conclusions: Trends in waist circumference during the past 10–20 years have greatly exceeded those in body mass index, particularly in girls, showing that body mass index is a poor proxy for central fatness. Body mass index has therefore systematically underestimated the prevalence of obesity in young people.
What is already known on this topic
What is already known on this topic The prevalence of overweight and obesity in youth based on body mass index has increased over the past 10–20 years
Body mass index gives no indication of body fat distribution
Waist circumference is a marker for central body fat accumulation; a large waist circumference is linked to an increased risk of metabolic complications
What this study adds
What this study adds Waist circumference in British youth has increased over the past 10–20 years at a greater rate than body mass index, the increase being greatest in females
The accumulation of central body fat has risen more steeply than whole body fatness based on height and weight
Current and future morbidity in British youth may be seriously affected due to accumulation of excess central fat
Introduction
Recent studies have shown an increase in the prevalence of overweight and obesity in British children over the past 10–15 years. 1 2 These findings have been based on body mass index and recently standardised cut-off points. 3 4 But body mass index gives no indication of the distribution of body fat, and in children, as in adults, centralised or upper body fat carries an increased risk for metabolic complications. For example, visceral adipose tissue is significantly related to concentrations of plasma low density lipoprotein cholesterol and triglycerides in 11–15 year olds as well as to concentrations of basal insulin and high density lipoprotein cholesterol (inversely) in females aged 10–16 years. 5 6 Furthermore, abnormalities in lipid concentrations and insulin concentration correlate with waist circumference in young people. 7 8 Waist circumference is a highly sensitive and specific measure of upper body fat in young people and so should be valuable for identifying overweight and obese children at risk of developing metabolic complications. 9 10 To this end we have recently had published the first waist circumference centile curves for British children and adolescents.11
An examination of secular trends in waist circumference in British children would add valuable comparative data to the evidence of trends in body mass index. We compared data on waist circumference, together with body mass index, in the same young people, collected in surveys over the past 10–20 years in Great Britain.
Methods
Participants
We obtained data for height, weight, and waist circumference, previously collected from British youth in two large cross sectional surveys. The first was conducted for the British clothing industry by the Human Measurements, Anthropometry, and Growth Research Group at Loughborough University in several sweeps, in particular males aged 6–16 years (1977) and females aged 6–17 years (1987). The participants represented socioeconomic, ethnic, and urban or rural groups as they occurred in the British population.12 The second survey was the national diet and nutrition survey of young people aged 4–18 years carried out in 1997, where waist circumference was measured in young people aged 11 years and over.13 We selected for analysis data on 4560 young people aged 11-16.99 years.
Anthropometric measurements
In both surveys height was measured without shoes. In the British Standards Institute survey weight was measured with participants wearing minimal clothing, whereas in the national diet and nutrition survey heavy clothing, jewellery, and small change were removed before weighing (weight was recorded to the nearest 0.1 kg and corrected for clothing effects). In both surveys, waist circumference (cm) was measured midway between the 10th rib and the top of the iliac crest.14 In the British Standards Institute survey clothing did not significantly influence the measurement, whereas in the national diet and nutrition survey the effect of clothing on waist circumference was not reported. To verify the clothing effect, we obtained data on 23 young people aged 11–16 years from a local comprehensive school. We took duplicate measurements at the same site over a school shirt, T shirt, or vest, and again over skin. The correlation between pairs of measurements was 0.994. The regression equation for predicting y (waist over skin) from x (waist over clothing) was y=0.994x-0.42, equivalent to a mean difference of 0.4 cm. For convenience, we corrected for waist circumference in the national diet and nutrition survey by subtracting 0.5 cm. Five participants had data missing for either body mass index or waist circumference.
Statistical methods
We derived body mass index as weight(kg)/height(m)2 and converted it to a standard deviation score using the revised 1990 British reference.3 Waist circumference was expressed as a standard deviation score using the recently published reference based on the data from the British Standards Institute survey.11 For each survey we calculated means and standard deviations by sex, and we compared means with Student's t test. The secular change in waist circumference was adjusted for corresponding changes in body mass index and height with multiple regression. We used cut-off points corresponding to the 91st and 98th centiles (SD scores 1.33 and 2, respectively) to define overweight and obesity based on body mass index and waist circumference separately. We compared observed and expected numbers in each category using the χ2 test and logistic regression. Statistical analyses were performed with SPSS version 10.0 and Data Desk (Data Description, Ithaca, NY) version 6.1.1.
Results
The mean waist circumference and body mass index for females and males by age were appreciably greater in the national diet and nutrition survey than in the British Standards Institute survey (P<0.001 for all groups except body mass index in males aged 13, P<0.05), the differences being similar at all ages (figs 1 and 2). The mean increase in body mass index was 1.5 (SE 0.16) for males and 1.6 (SE 0.16) for females. The mean increase in waist circumference was 6.9 (SE 0.46) cm for males and 6.2 (SE 0.34) cm for females (all P<0.0001). The standard deviations were also larger in the national diet and nutrition survey than in the British Standards Institute survey.

Waist circumference in British youth aged 11–16 years. *P<0.0001
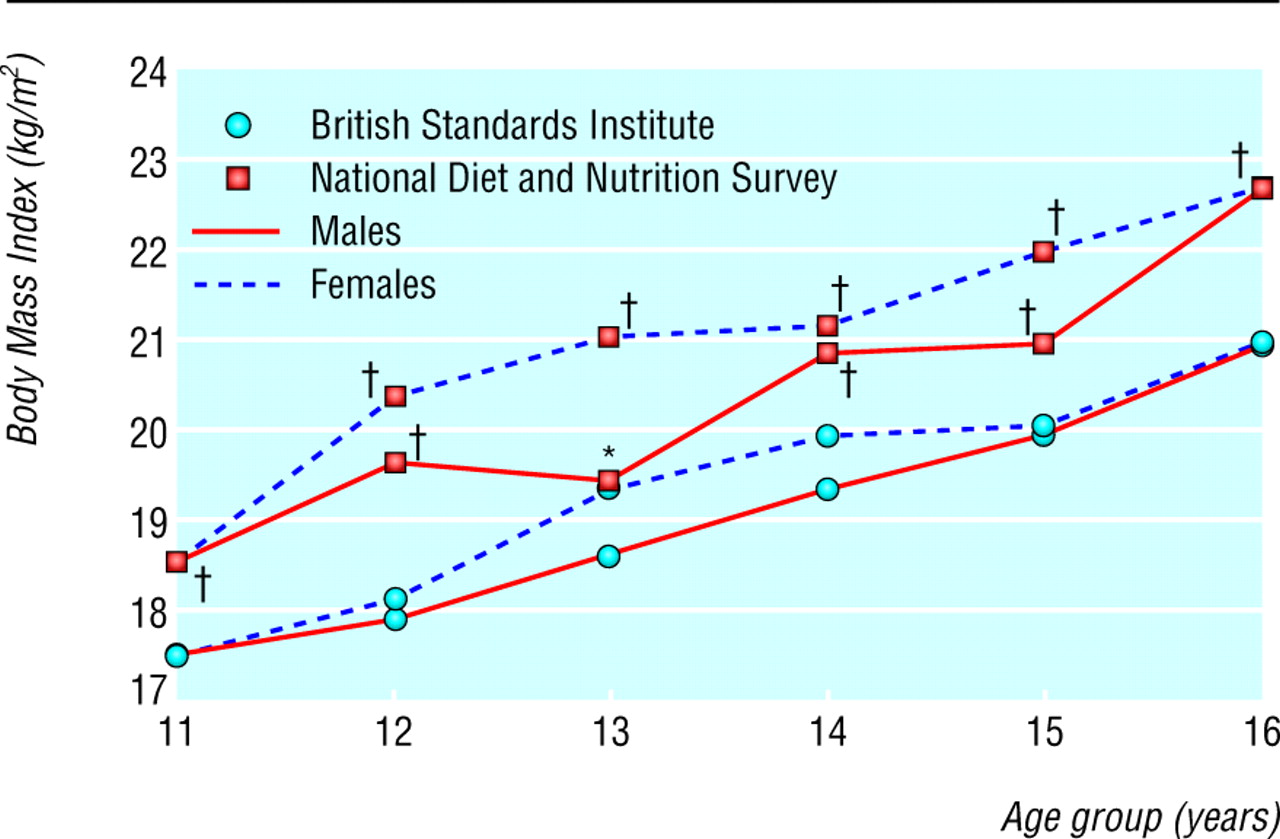
Body mass index in British youth aged 11–16 years. *P<0.05, †P<0.001
Standard deviation scores for waist circumference increased much more than for body mass index. The mean increase in waist circumference in males was 0.84 units versus 0.47 units for body mass index, whereas in females the contrast was even greater (1.02 units versus 0.53; table 1). Waist circumference increased by 0.18 (SE 0.08) units more in the females than in the males, and the variability in the females in 1997 was also significantly greater than that in the males. The changes in the females correspond to a shift from the 50th to the 85th centile for waist circumference and the 44th to the 70th centile for body mass index.
Changes over 10–20 years in mean body mass index and waist circumference in British youth aged 11–16 years by sex. Values are mean standard deviation scores (standard deviations) unless stated otherwise
The standard deviation scores for waist circumference were strongly correlated with body mass index (r=0.82 in males, 0.79 in females) and less with height (r=0.48 and 0.30). Adjusting for body mass index and height changes between surveys reduced the increase in mean waist circumference from 0.84 to 0.45 (SE 0.029) units in males and from 1.02 to 0.57 (SE 0.033) units in females. So less than half the increase in waist circumference was explained by increases in body mass index or height.
Table 2 shows the prevalence by sex of overweight and obesity based on body mass index and waist circumference in the two surveys. In all cases the prevalence increased over time—for example, for overweight from 6-9% in 1977 and 1987 to 17-38% in 1997 (P<0.0001). The increases were appreciably larger for waist circumference (20-29% overweight and 11-14% obese) than for body mass index (11-13% overweight and 7% obese) (P<0.001). Based on waist circumference, more than one third of females in 1997 were overweight and over one sixth were obese.
Changes over 10–20 years in overweight and obesity based on body mass index and waist circumference in British youth aged 11–16 years by sex. Values are percentage overweight exceeding 91st centile (percentage obese exceeding 98th centile) unless stated otherwise
Discussion
We examined two indices of fatness, body mass index and waist circumference, in British youth aged 11–16 years surveyed 10 years apart (1987 and 1997 for females) and 20 years apart (1977 and 1997 for males). We found large increases in both indices, substantially more for waist circumference than for body mass index, reflecting the widely documented trend to increased child obesity. This suggests a steeper rise in abdominal obesity than whole body obesity based on weight and height.
The definition of child overweight and obesity is arbitrary.4 The cut-off points used here, the 91st (overweight) and 98th (obese) centiles, were chosen because they are standard on the British charts; and because the 91st and 98th centiles for body mass index are similar to the recently described cut-off points for overweight and obesity determined by the International Obesity Task Force.4
The increased waist circumference is unlikely to be due to visceral adipose tissue alone; it probably reflects both visceral and subcutaneous fat and hence total fatness. In contrast the body mass index measures the sum of fat mass and fat free mass, and it is impossible to know the relative contributions of each.15 This suggests that body composition has changed over time, the increase in fat mass being obscured by a reduction in muscle mass. This has been shown by comparing contemporary children with Fomon's reference child.16 Monitoring trends in body mass index alone fails to identify this shift from muscle to fat.
In obese adolescents the accumulation of excess fat is known to occur predominantly in the upper body rather than in the peripheral region. 6 17 A similar trend to central fatness based on measurements of skinfold thickness has recently been observed in Spanish youth, showing that the phenomenon is not unique to Britain.18
Methodological differences may have accounted in part for these observations. However, in both surveys the site of the waist measurement was defined identically. Furthermore, with a low reported technical error of measurement,19 low intraobserver and interobserver error (unpublished data), and adjustment for clothing, it is likely that the increases in waist circumference are genuine.
It is not yet possible to guess the impact of these increases in waist circumference on current and future morbidity, but they should be a cause for concern. One US study found that young people above the 90th centile for waist circumference had higher concentrations of low density lipoprotein cholesterol, triglycerides, and insulin and lower concentrations of high density lipoprotein cholesterol than young people below the 10th centile.8 This may well be mirrored in British youth. It is not known how early in life the increases in waist circumference over the reference values from 1977 and 1987 are detectable in a contemporary population, although we have observed similar increases in children as young as 3 years (unpublished observations).
Another concern is the difference between the sexes. Males were followed over 20 years compared with 10 years for females, so the males ought to have shown a larger secular trend. Yet the increase was appreciably larger in the females than in the males, for reasons that are unclear. Energy intake has decreased to a similar extent in the sexes.13 It may be that levels of physical activity have decreased faster in females than in males. If so then central fatness may be related more to physical activity than to energy intake.
In conclusion, we found that in British youth aged 11–16 years, waist circumference, representing central fatness, has increased much faster than body mass index over 10–20 years. Further work is necessary to examine the link between waist circumference, body fatness, and morbidity in young people. Waist circumference should be routinely measured in schoolchildren. Urgent action is needed to reverse the trends and reduce the likely medical and psychological costs of the increase in obesity in young people.
Acknowledgments
We thank the referee Peter Betts for his comments on the paper and the University of Loughborough and the Data Archive, University of Essex, for supplying the data.
Contributors: HDM had the original idea and obtained the data. HDM and TJC did the analyses. HDM, SME, and TJC wrote the paper. HDM will act as guarantor for the paper.
Footnotes
-
Funding HDM and SME were supported by the University of North London diversity and development fund. TJC was supported by Medical Research Council programme grant G9827821.
-
Competing interests None declared.