Article Text

Abstract
Background: Considerable debate exists on the epidemiology of genital anomalies.
Methods: All genital anomalies, excluding undescended testes, were identified from neonatal returns, stillbirth and infant death survey records, and returns relating to hospital admissions and linked to form infant profiles on a cohort of singleton births between 1988 and 1997 with follow up for a minimum of three years.
Findings: The mean genital anomaly prevalence rate in Scotland was calculated at 4.6 per 1000 births varying from 4.0 per 1000 births in 1988 to 5.9 per 1000 births in 1996. However, there was no evidence of a clear trend to an increasing prevalence of hypospadias, which constituted 73% of the anomalies studied. Logistic regression analysis of the data also showed this rate to be independently associated with being relatively small for gestational age (odds ratio (OR) 1.43, p < 0.001) and increasing maternal age (OR 1.2, p < 0.05). Infants born in deprived areas, as judged by the Carstairs deprivation score, were least likely to have a genital anomaly (OR 0.73, p < 0.01).
Interpretation: A new linked register of congenital genital anomalies in Scotland suggests that over a decade, the birth prevalence of genital anomalies has changed little. The associations between genital anomalies, maternal age, and socioeconomic deprivation require further study.
- congenital anomalies
- ambiguous genitalia
- prevalence
- trends
Statistics from Altmetric.com
Genital malformations are associated with a large spectrum of disorders and can be broadly classified into XX masculinisation and XY undermasculinisation. Whereas most cases of XX masculinisation are due to congenital adrenal hyperplasia (approximate occurrence rate of 1 in 12 000 live female births), XY undermasculinisation is due to a more heterogeneous group of conditions.1 As hypospadias is associated with a single identifiable genital defect, its prevalence has been widely studied and some recent studies suggest that its prevalence is rising.2–5 The aim of this study was to explore temporal, geographical, and socioeconomic trends in the occurrence of genital anomalies in a geographically defined part of the United Kingdom using a group of databases that collect standardised information on all births.
METHODS AND SUBJECTS
Using probability matching and linking data to facilitate the identification of duplicates and analysis of incident cases,6 a retrospective register of genital anomalies was created for singleton births between 1988 and 1997. Data were collected retrospectively from the existing sources of neonatal returns, stillbirth and infant death survey records, and returns relating to acute hospital admissions (SMR1). Cases were identified by ICD-9 or ICD-10 coding in diagnostic fields. The abolition of the standard neonatal form (SMR11) in 1996 as a routine return for all live births was compensated for by identification of the anomaly in the first three years of life by hospital admission diagnostic summary data. Regional and temporal variations were studied over the period using fields derived from postcode of maternal residence. The postcode was also used to assess the Carstairs and Morris deprivation score.7
Statistical analysis
Singleton birth rates by year of birth and health board of residence/deprivation quintile were calculated using maternal delivery obstetric records. Odds ratios were calculated for the probability of a genital anomaly birth outcome using multiple logistic regression analysis. This examined the association with birth weight and maternal age (adjusted for gestational age and sex of baby). Significance values in the model were calculated using the regression coefficients (b) and their standard errors (se(b)). The model treats b/se(b) as a standard normal deviate to calculate the significance. For comparison of birth prevalence data for each region, and deprivation category in comparison with the Scottish average, normal approximation to the binomial distribution was used, obtaining a standard error for each observed proportion. Comparison was made between the observed Scottish rate and each respective 95% confidence interval, so testing at the 5% level. Cases with missing values were excluded from the analysis, which was performed using the SPSS software package release 10.1.3.
RESULTS
Temporal and regional trends
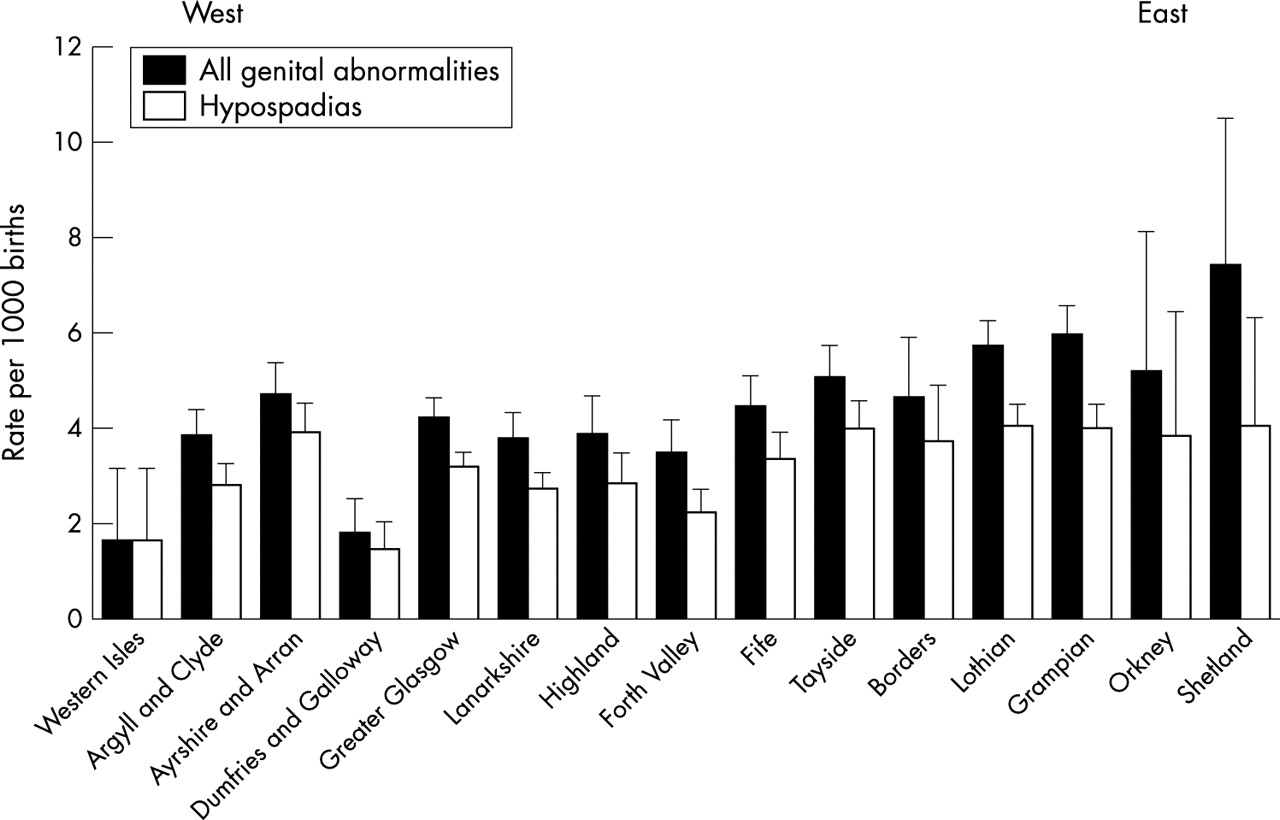
Over the study period, the birth prevalence of genital anomaly was calculated at 4.6 per 1000 births based on 2816 cases out of 611 849 births. The group of children with hypospadias accounted for about 73% of all cases. Although a significant increase in cases of all genital anomalies was reported over this period, rising from 4.0 per 1000 births in 1988 to a maximum of 5.8 per 1000 births in 1996 (p < 0.05), this rise was not maintained in 1997 (fig 1). In addition, there was no significant increase in the birth prevalence of hypospadias. The highest and lowest prevalence rates of genital anomalies (excluding the Island boards) were found in Grampian and Dumfries & Galloway health boards respectively (fig 2). Compared with the national average, significantly higher rates were found in eastern health board areas, and lower rates were found in those areas towards the west of Scotland.
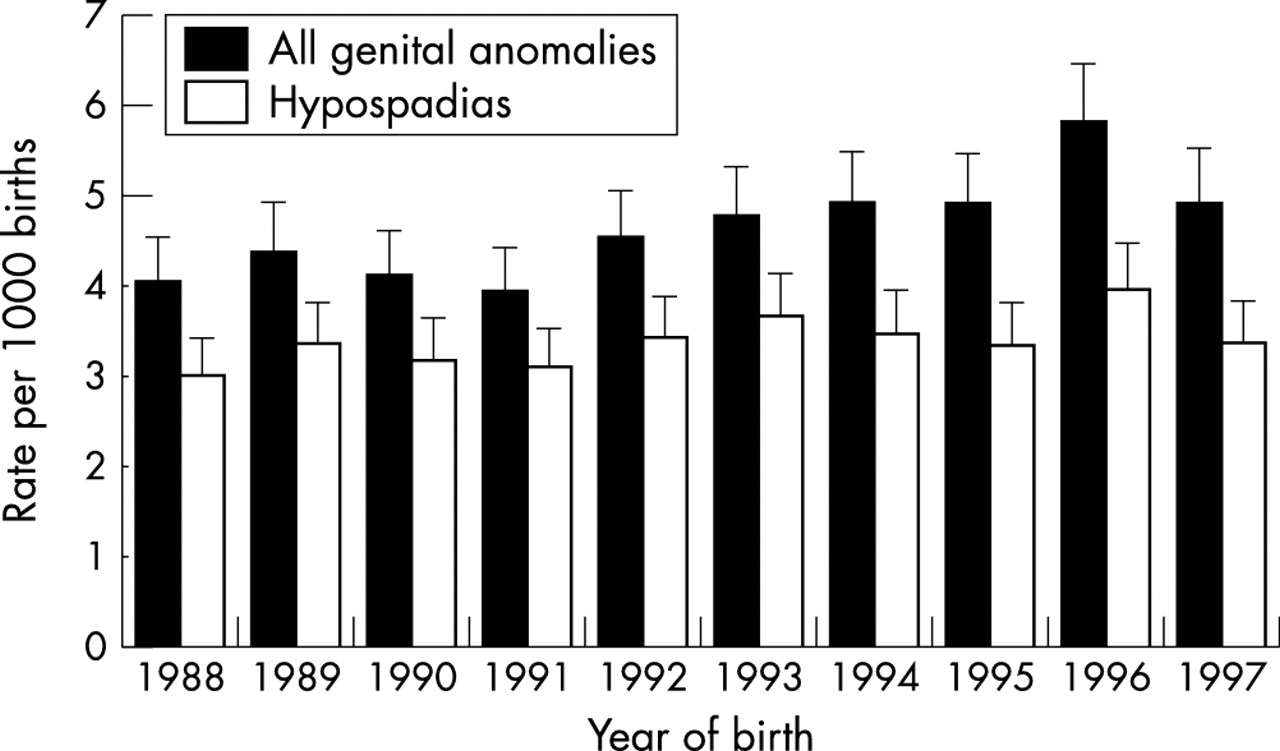
Prevalence rates (per 1000 births) for all genital anomalies and hypospadias between 1988 and 1997. Error bars denote 95% confidence interval.

Prevalence rates (per 1000 births) between 1988 and 1997 for all genital anomalies and hypospadias in the 15 health boards of Scotland. The health boards on the left are located on the western side of Scotland and those on the right are located on the eastern side. Error bars denote 95% confidence interval.
Socioeconomic status, maternal age, birth weight, and previous history of congenital anomaly
Using Carstairs deprivation scores, the highest prevalence rates were found in the least deprived category for all genital anomalies as well as the main subset, hypospadias, with prevalence rates per 1000 births of 5.6 and 4.1 respectively. However, multivariate analysis that adjusted for covariables did not show a consistent association with socioeconomic status (table 1). Compared with the Scottish average, the genital anomaly rate was higher in the higher maternal age band than the lower age band (table 1). Babies born within the lowest birthweight quintile (adjusted for gestational age) had a 40% increased likelihood of a genital anomaly. Furthermore, a 20% increased likelihood of a genital anomaly was found in mothers with a previous pregnancy resulting in any congenital anomaly (table 1).
Logistic regression analysis: genital anomalies in Scotland, 1988–1997
DISCUSSION
This study has created and tested a new linked register for the study of congenital anomalies. Although there are existing concerns about data collection from population based registers, by linking data from a number of existing sources of neonatal returns (SMR11), stillbirth and infant death survey records, and returns relating to hospital admissions (SMR1) in the first three years of life, we are confident that the problem of ascertainment bias from any one data source has been countered. This new linked register allows the study of rarer forms of genital anomalies. Our study reports a genital anomaly rate similar to that reported by previous investigators,3–5 suggesting that the prevalence of genital anomalies has changed little. However, between 1988 and 1997, a rise in prevalence was observed in the non-hypospadias form of genital anomalies, which needs further analysis. It is unclear whether an apparent reduction in hypospadias prevalence seen between 1996 and 1997 is real or an artefact resulting from changes in the neonatal notification system that were introduced in 1996 and will require future prospective evaluation.
Vrijheid et al8 reported that non-chromosomal congenital anomalies are more likely to occur in the most socioeconomic deprived quintile, but they did not report on genital anomalies. This study shows that there may be a relation between genital anomalies and socioeconomic status, as determined by the Carstairs index, but the relation is the opposite to that found with most other anomalies. The Carstairs deprivation score is area based, such that, everyone in a postcode sector is assumed to have the same level of “deprivation”. Its use is likely to be most reliable in larger urban areas. In rural areas where only a smaller population is considered, variations within the population cohort may be problematic, leading to an apparently reduced association with deprivation. Fisch et al9 have recently reported that the risk of genital anomaly increases with increasing maternal age. Our data suggest that this risk may be independent of socioeconomic status. The lack of a relation between the oldest group of mothers and prevalence of genital anomaly may be due to the lower number of births in that age group as well as the possible confounding effects of parity. Our data also show that there is an independent association between birth weight and genital anomaly. Although it is possible that in some cases this association may be due to offspring with low birth weight as part of a combination of congenital anomalies, previous reports of this association suggest that this is unlikely to be a common event.10–12
In summary, we have created a new linked register of congenital genital anomalies in Scotland that shows that, over a decade, the birth prevalence of genital anomalies has changed little. The association between genital anomalies, maternal age, and socioeconomic deprivation require further study.
Acknowledgments
We are grateful for the funding and commitment received from the Chief Scientist Office of the Scottish Executive Health Department.