Article Text

Abstract
BACKGROUND/AIMS The advantages of logMAR acuity data over the Snellen fraction are well known, and yet existing logMAR charts have not been adopted into routine ophthalmic clinical use. As this may be due in part to the time required for a logMAR measurement, this study was performed to determine whether an abbreviated logMAR chart design could combine the advantages of existing charts with a clinically acceptable measurement time.
METHODS The test-retest variability, agreement (with the gold standard), and time taken for “single letter” (interpolated) acuity measurements taken using three prototype “reduced logMAR” (RLM) charts and the Snellen chart were compared with those of the ETDRS chart which acted as the gold standard. The Snellen chart was also scored with the more familiar “line assignment” method. The subjects undergoing these measurements were drawn from a typical clinical outpatient population exhibiting a range of acuities.
RESULTS The RLM A prototype chart achieved a test-retest variability of +/−0.24 logMAR compared with +/−0.18 for the ETDRS chart. Test-retest variability for the Snellen chart was +/−0.24 logMAR using clinically prohibitive “single letter” scoring increasing to +/−0.33 with the more usual “line assignment” method. All charts produced acuity data which agreed well with those of the ETDRS chart. “Single letter” acuity measurements using the prototype RLM charts were completed in approximately half the time of those taken using the ETDRS and Snellen charts. The duration of a Snellen “line assignment” measurement was not evaluated.
CONCLUSION The RLM A chart offers an acceptable level of test-retest variability when compared with the gold standard ETDRS chart, while reducing the measurement time by half. Also, by allowing a faster, less variable acuity measurement than the Snellen chart, the RLM A chart can bring the benefits of logMAR acuity to routine clinical practice.
- visual acuity
- logMAR
- Snellen
- vision test
Statistics from Altmetric.com
The most common clinical measurement of visual function is visual acuity. It is used to determine the need for, and outcome of, many interventions as well as to monitor the course of eye disease. It is therefore desirable that for clinical use, the measurement error (test-retest variability or TRV) of acuity should be both consistent across the acuity range and quantifiable in terms of lines or letters of change. The Snellen chart,1 although being the commonest tool for the measurement of visual acuity in ophthalmic practice, exhibits certain well documented design flaws2-6 which may compromise its usefulness in this respect. Firstly, the non-geometric progression of letter sizes and the variable number of letters per line prevents TRV from being specified in terms of letters or lines of change.
Also, the lack of a systematic approach to letter legibility and crowding may compromise the reliability of Snellen measurements as letter size is not the sole determinant of the difficulty of a given line of letters. Furthermore, in being ordinal data rather than interval data, the Snellen fraction notation is not easily subjected to statistical analysis, and does not lend itself to an interpolated method of acuity scoring which is known to provide lower TRV than the “line assignment” method more usually employed with the Snellen chart78 (see “Scoring” in the “Materials and methods” section for definitions of scoring methods).
These theoretical design problems were addressed with the development of logMAR acuity charts2910 which are now frequently employed in prospective clinical research. LogMAR charts, however, have not been widely adopted into routine clinical practice. This may be due to the unfamiliar scoring system, the chart's size, and the perception of a logMAR measurement as being time consuming.
We hypothesise that a logMAR chart with a reduced number of letters per line would allow measurements to be made in a clinically acceptable period of time, and with greater precision and reliability than is possible with Snellen charts. The performance of three different prototype charts (“reduced logMAR” or “RLM” charts A, B, and C) was compared, in terms of TRV and measurement time, with that of the Snellen chart, as well as the ETDRS (Early Treatment Diabetic Retinopathy Study) logMAR chart,10 which acted as the gold standard.
Materials and methods
SUBJECTS
Patients who fulfilled the following inclusion criteria were recruited from the primary care and cataract clinics of Moorfields Eye Hospital:
- (a)
Snellen acuity of between 6/5 and 6/60
- (b)
a diagnosis of cataract, pseudophakia, or early glaucoma (no visual field defects in the central 20°)
- (c)
able to understand and comply with the testing protocol.
One eye of each subject was assessed. Where both eyes met the criteria, the eye with the poorest acuity was used as the study eye.
A total of 16 male and 25 female subjects aged 49–89 years were recruited: 30 subjects had cataract, seven were pseudophakic, and four had primary open angle glaucoma. Acuities ranged from +0.82 to −0.14 (median +0.34) logMAR.
THE CHARTS
Two versions of each of the five different chart designs were used in the study. The chart design parameters and the acuity range at a 6 metre testing distance are summarised in Table 1.
Summary of chart design
Reduced logMAR (RLM) charts
These prototype charts conformed to the design principles used in the ETDRS chart10 in terms of logarithmic letter size progression, interletter spacing, interline spacing, the avoidance of words or acronyms, and the use of the Sloan set of letters.9 In view of the fact that letter recognition measurements in both normals and abnormals can be influenced by the proximity of the letter to any surrounding contours,11 all the RLM charts were surrounded by a continuous “crowding bar” (see Fig 1). This was employed to compensate for the reduction in the proportion of letters crowded from both sides produced by reducing the number of letters per line. The bar was positioned 2.5 stroke widths (half a letter) from the edge of the letters as the difficulty of letters crowded in this way has been shown to equate well to that of letters in a linear arrangement.12

The RLM A chart.
ETDRS charts (Lighthouse Low Vision Products)
ETDRS charts 1 and 2 were used. The refraction chart was used for patient demonstration purposes.
The Snellen Charts (Clement Clarke UK)
The two Snellen charts used were selected to be as similar as possible and, in order to reduce truncation effects, included a 6/4 line.
CHART DISPLAY
The RLM charts and the ETDRS charts were displayed in the standard Lighthouse light box. The Snellen charts were displayed in the standard Clement Clark light box. All charts were backlit in the appropriate light boxes.
TESTING PROTOCOL
Timed acuity measurements were taken on one eye of each subject, one measurement being taken using both versions of each of the five chart types. The time was measured from the subject starting to read the letters until they had made a complete line of errors. Calculation of acuity scores was performed separately to avoid influencing the time measurements. The charts were viewed in random order and responses were recorded on specially designed data proformas.
All measurements were conducted by a single examiner using a forced choice paradigm under consistent lighting conditions. All subjects wore their habitual spectacle correction. All charts were read from a distance of 6 metres unless the subject misnamed any letters on the top line of a given chart. In this event, the subject was moved to 1.5 metres and the remainder of the measurements were taken at this distance. The end point for each chart was defined as an entire line of letters being misread or, in the case of some letters being read on the bottom line, all the letters on the chart having been attempted.
SCORING
The Snellen acuity data (from 6/4 to 6/60) were converted to the logMAR format. This is done by taking the log to the base 10 of the reciprocal of the Snellen acuity fraction. This transform can be performed regardless of the denominator or numerator.
eg, 6/9 → 9/6 = 1.5 then log (1.5) = +0.18 logMAR
An interpolated logMAR acuity score (“single letter” score) was produced for each chart using the formula
1.10 − TCLV
where TC is the total number of correctly named letters and LV is the logMAR value of each letter on the chart. The individual letter values are produced by dividing the logMAR interval between a given line and the line below by the number of letters on that line.10 Each letter on the ETDRS and reduced logMAR charts therefore has an equal value, whereas the value of a Snellen letter will depend on which line it is presented.
The Snellen charts were also scored using a “line assignment” method, this being the most common method by which Snellen acuity data are produced in clinical practice. The acuity score was defined as the value of the lowest line on which at least half of the letters were named correctly.
All acuity scores were adjusted for testing distance before analysis.
METHOD OF ANALYSIS
Our objectives were as follows:
- (a)
to determine in terms of mean difference and 95% confidence intervals, the TRV of single letter acuity data using each of the five chart designs, as well as the TRV of a Snellen line assignment measurement
- (b)
to determine in terms of mean difference and 95% confidence intervals, the extent to which measurements taken using the reduced logMAR and Snellen charts agreed with the gold standard ETDRS chart and
- (c)
to compare the time taken to perform a “single letter” measurement on each chart.
The methods of Bland and Altman13 were used to determine (a) and (b) above.
Results
Histograms of the distribution of the test-retest and interchart acuity variability data suggested that these data conformed to a normal distribution. Scatter plots of difference in acuity verses mean acuity13 suggested that there were no systematic associations within any of these data sets between the extent of the agreement or TRV and the underlying acuities.
Table 2 shows the ETDRS chart to produce acuities with the lowest (best) TRV with 95% confidence limits for agreement of +/−0.18 logMAR. The RLM A and Snellen “single letter” measurements were more variable, both with figures of +/−0.24 logMAR; and the TRV for the RLM C, RLM B, and Snellen “line assignment” acuities were higher still (+/−0.27, +/−0.31, and +/−0.33 respectively).
Test-retest variability of the five chart designs
Table 3 shows that the acuities recorded using the RLM charts did not exhibit any systematic bias when compared with the ETDRS chart. Good agreement is indicated by the 95% confidence intervals for the mean including zero. Snellen acuities showed no systematic bias providing they were scored with the “single letter” scoring method.
Agreement with ETDRS measurements
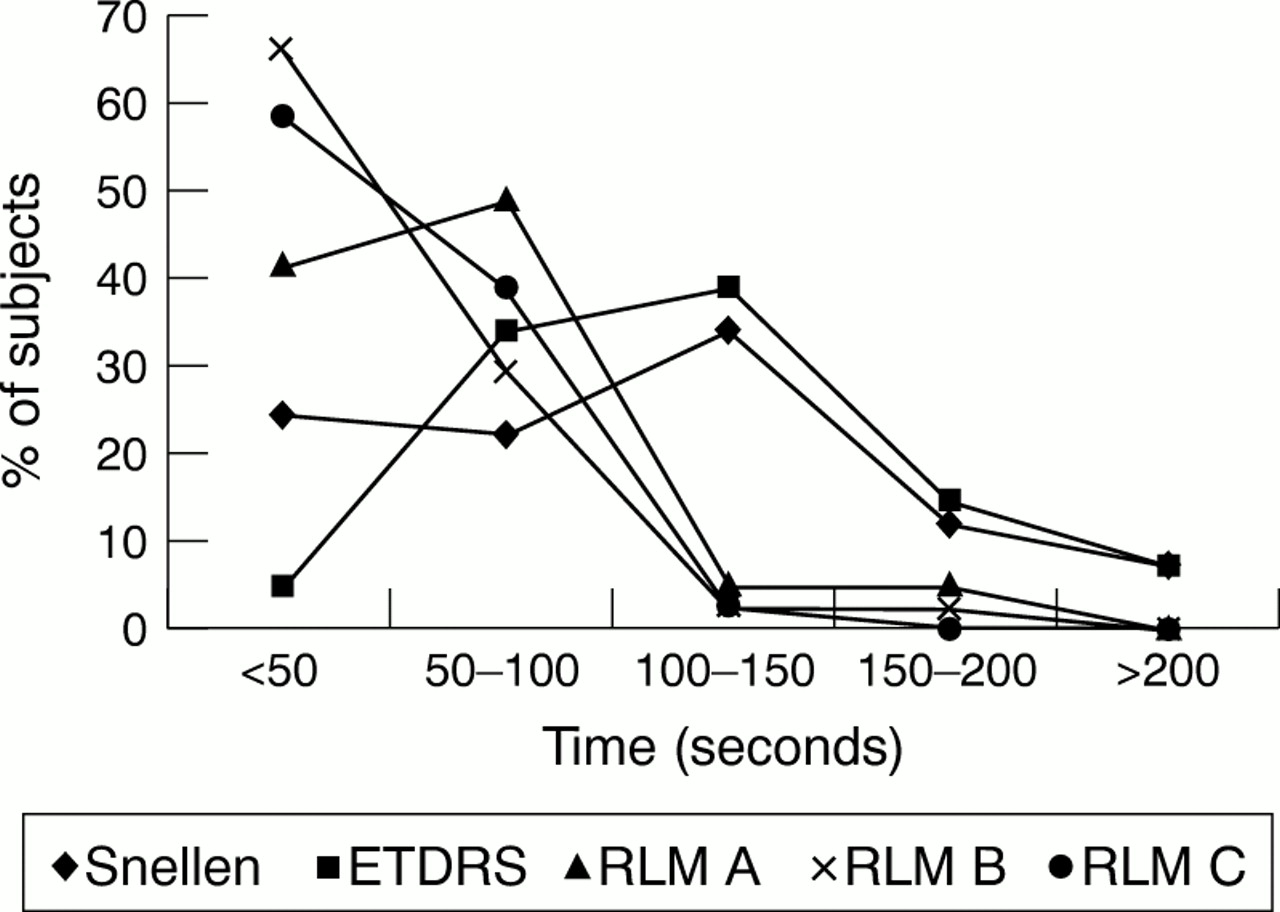
Figure 2 is a graphical representation of the chart reading times. It can be seen that a high proportion of chart readings using the RLM A, B, and C charts were completed in less than 50 seconds (41%, 66%, and 59% respectively), while very few require more than 100 seconds (10%, 4%, and 2%). Conversely for the ETDRS and Snellen charts, fewer chart readings are completed in under 50 seconds (5% and 24% respectively), a high proportion require between 100 and 150 seconds (39% and 34%), and some more than 200 seconds (7% and 7%). Table 4 shows the chart reading times for the RLM charts to be approximately half to a third of those for the ETDRS and Snellen charts across the distribution; the only exception being where the very shortest times were similar for both the RLM and Snellen charts.
“Single letter” chart reading times.
Reading time for each of the five chart designs
Discussion
Our aim was to develop a logMAR chart which:
- (a)
produced a consistent and acceptable level of TRV across a range of acuities
- (b)
produced acuity data which agreed well with those of the ETDRS chart
- (c)
could be used in a clinically acceptable period of time and
- (d)
produced interval acuity data.
The Bland and Altman scatter plots of difference versus mean referred to in the results section demonstrated that for all the charts, agreement and TRV were consistent across the range of acuities featured in this study.
The ETDRS TRV found in this study (+/−0.18 logMAR) is in keeping with previously reported data using the ETDRS or Bailey-Lovie charts which range from +/−0.09 to +/−0.20 logMAR.6714-17 Cataract, uncorrected refractive error, and the use of non-practised observers are known to have a detrimental effect on TRV615 and may account for the higher variability in our study (which used habitual spectacle correction) compared with some of those shown above. The results allow us to compare the performance of the different charts within the same population. Table 2 shows the test-retest variability of the RLM A chart (+/−0.24 log units) to compare favourably with that of the ETDRS chart (+/−0.18 log units); while the TRV of the RLM B and C charts was larger still (+/−0.31 and +/−0.27 log units respectively). The increased variability obtained with the prototype charts can be accounted for by the larger scale interval (single letter value) compared with that of the ETDRS chart7 (see Table1). Scoring the Snellen chart with the “line assignment” method produces the largest scale intervals and hence the highest TRV (+/−0.33 log units). The Snellen single letter method produced the same TRV as the RLM A chart, but is too time consuming for clinical use, as will be discussed later.
Table 3 shows that the acuities recorded using the RLM charts showed good agreement with those recorded using the ETDRS chart suggesting that none of our modifications to the ETDRS format had introduced any systematic bias to the data. Snellen acuities also showed good agreement with ETDRS acuities when scored with the “single letter” scoring method.
In interpreting the chart reading time data, it should be remembered that all times refer to “single letter” acuity measurements. The line assignment method commonly used with the Snellen chart in clinical practice may allow quicker measurements. This would be expected because, unlike the single letter method, the line assignment method does not require that the patient continues to attempt letters until they have misnamed all of the letters on one line (a forced choice testing paradigm). Instead, the test is terminated either when half or more of the letters are misread or, more typically, when the patient states that (in their opinion) they cannot read any letters on the next line, which is then not attempted. Hence, not only is the single letter measurement likely to require more letters to be attempted but, also, the additional letters are of a size close to the patients threshold which are typically more time consuming to attempt. The study design did not allow for the duration of a Snellen “line assignment” measurement to be assessed because to note measurement time at two separate end points was deemed excessively complicated.
The data displayed in Figure 2 clearly show a tendency for “single letter” measurements taken using the RLM charts to be less time consuming than those taken using the ETDRS and Snellen charts. The likely explanation for this is, firstly, the reduced total number of letters, but also that fewer letters per line will reduce the number of letters at or around threshold which are typically more time consuming to attempt. A slowing of responses at threshold may account for the shorter measurement times for RLM B compared with RLM C, these two charts having an almost identical total number of letters (see Table 1) but the former having only two letters per line. RLM A measurements are slightly more time consuming than RLM B and RLM C, as the total number of letters and/or number of letters per line is higher.
The median “single letter” chart reading times for the RLM A chart were approximately half of the corresponding times for both the ETDRS chart and the Snellen chart (see Table 4). The only exceptions to this were the shortest Snellen chart reading times, which were almost as short as those for the RLM A chart. A plot of chart reading time against acuity for the Snellen chart showed the shortest measurement times to be those related to the poorest acuities where only a small number of letters at the top of the Snellen chart had been attempted.
The time data in Figure 2 and Table 4 represent the duration of “single letter”, forced choice measurement times exclusive of score calculation—that is, chart reading timeonly. Score calculation was carried out separately so as to prevent this acting as a confounding variable. It should be noted that the calculation of a Snellen “single letter” score requires approximately 1 minute in addition to the time required for the subject to read the chart. It also requires reference to be made to a set of tables and/or the use of a calculator. This would clearly be impractical in a clinical setting. For the ETDRS and RLM charts, calculation of a single letter score takes approximately 10 seconds.
Conclusion
Snellen line assignment measurements are very variable, whereas Snellen single letter measurements are slow and clinically impractical. Although measurements taken using contemporary logMAR charts such as the ETDRS are subject to a low level of TRV, they are time consuming. This may explain why, more than 20 years after their development, these superior charts have still not been widely adopted into routine clinical practice. An abbreviated design of logMAR chart can offer the format of the pre-existing logMAR charts with the inherent benefits concerning scoring and analyses as well as consistent TRV with which to identify clinically significant change. Measurements taken using the RLM A chart design were found to be slightly more variable (TRV +/−0.24 logMAR) than the gold standard ETDRS (TRV +/−0.18 logMAR), but considerably less variable than the Snellen line assignment measurement used in clinical practice (TRV +/−0.33 logMAR). Even when used with a rigorous forced choice testing paradigm, “single letter” measurements using the RLM A chart were completed quite quickly, with a median chart reading time of approximately half that of the equivalent measurements using the ETDRS and Snellen charts. The RLM B and RLM C charts, while quicker still, were more variable. For routine clinical use, the RLM A chart appears to offer a pragmatic compromise trading off TRV against measurement duration. Evidently, the ubiquitous Snellen line assignment method is presently deemed acceptable for clinical use. The RLMA chart offers a lower level of TRV in an average of under 1 minute and the benefits of contemporary logMAR chart designs. It therefore has great potential for use in routine clinical practice. Having established the potential of this design, further investigations are optimising the chart design in terms of letter spacing, line spacing, and the presence of crowding bars.