Article Text

Statistics from Altmetric.com
Visual impairment in childhood has important effects on development and can have serious economic implications for both the family and society.1 In the long term it affects employment and many other opportunities in life. In developed countries most visual impairments in children are present from birth or early childhood and a substantial proportion of these children have other impairments and disabilities as well.2 3
The prevention of avoidable visual impairment in children is one of the goals of the World Health Organization’s (WHO) Global initiative for the elimination of avoidable blindness by 2020, known as VISION 2020.4 Comparative data are needed to assess progress towards this goal,5 but with a few exceptions such information is scarce worldwide.3 6–8 In the UK the most recent data come from the study of severe visual impairment and blindness newly diagnosed in 2000, conducted through the British Ophthalmological and British Paediatric Surveillance Units.3 The latter found a higher incidence of severe visual impairment/blindness than expected based on rates from blindness registers.3 6
We report trends in the incidence of visual impairment in children born over a 15-year period from 1984, the relationship with birth weight and gestational age, the distribution of specific and potentially preventable or treatable visual impairment, and the risk of death.
METHODS
Data source
The data used came from 4Child – Four Counties Database of Cerebral Palsy, Vision Loss and Hearing Loss in Children originally established in 1984 as the Oxford Register of Early Childhood Impairments.8 4Child is a population-based register which aims to monitor the incidence of cerebral palsy, visual impairment and hearing loss in children resident in the four English counties of Berkshire, Buckinghamshire, Oxfordshire and Northamptonshire, and to provide a platform for research relating to the three impairments.9 Multiple source notifications to the register are actively sought and collection of personal identifiers enables detection of duplicate cases. Notification to the register is not mandatory and there is no direct benefit of notification to individual children in terms of receipt of developmental or rehabilitation services, although the data are used for service planning.
The definition of visual impairment used for inclusion of cases on the register is visual acuity in the better eye of 6/18 or less with spectacles or aids if worn. If visual acuity cannot be measured, a clinical assessment of the degree of visual impairment is made. Although the definition does not correspond directly with the WHO classification9 10 of visual impairment (<6/18 to 6/60), children with a corrected visual acuity of 6/18 to 6/60 in the better eye are for these purposes defined as having visual impairment (VI) and informally referred to as having a “moderate” impairment. Children with corrected visual acuity in the better eye of less than 6/60 or no useful vision are defined as having severe visual impairment or blindness (SVI/BL).9 Unilateral visual impairment is excluded. Following initial notification, information about birth weight, gestational age and plurality is collected. Further clinical information including diagnostic confirmation and the presence of other impairments is sought when the child is 3 years old and again at 5 years old. Where children are notified after the age of 5, clinical information is sought immediately. Because the 4Child register also collects notifications of children with cerebral palsy and children with hearing loss, information about these impairments is systematically recorded in more detail compared with other impairments. However, information about other impairments which affect independent living, such as specific congenital anomalies, is also recorded when provided by clinicians. The children on 4Child are ”flagged” for mortality with the National Health Services Central Register.
A dataset of all children with visual impairment born in the 4Child catchment area from January 1984 to December 1998 inclusive was extracted in May 2005; current residents born outside the catchment area were excluded. About half (52%) of the children were notified to 4Child by at least two sources and 16% by three or more; 89% were notified by age 5 and the oldest was notified at age 12. Visual acuity could not be measured for 27 children of whom 23 died before age 5. We included all 27 in the SVI/BL group on the basis of clinical or death certification information.
The diagnosis and anatomical site of the cause of the visual impairment are collected as a text description rather than pre-specified categories. We used the WHO classification to categorise the anatomical site affected and the cause according to the timing or likely timing of the visual insult.10 We extended the latter classification to include a separate category for children with cerebral palsy, global developmental delay and microcephaly since the aetiology in most of these cases is unknown and, in particular, cerebral palsy should not be ascribed to the perinatal period without clear evidence11; where there was clear evidence of a cause this was included in the appropriate category. Of note, some children had multiple causes and multiple anatomical sites affected. Using the categorisation described by Rahi and Cable,3 we attempted to identify cases with potentially preventable and treatable visual impairment.
Analysis
Total and birth weight-specific cumulative incidence (risk) were calculated using annual live birth statistics provided by the Office for National Statistics (ONS) as the denominator; 95% confidence intervals (95% CIs) were estimated using the exact binomial distribution. We estimated gestational age-specific cumulative incidence using denominators provided by local child health systems since gestational age is not included in ONS data.8 The two-sided Cochran-Armitage test for trend was used to assess temporal trends and the χ2 test was used to compare frequencies; p<0.05 was taken as statistically significant. Risk ratios (RR) and 95% CIs were calculated using the method of Clayton and Hills.12
Ethics approval
4Child operates under approvals from the Thames Valley Multicentre Research Ethics Committee and the Patient Information Advisory Group.
RESULTS
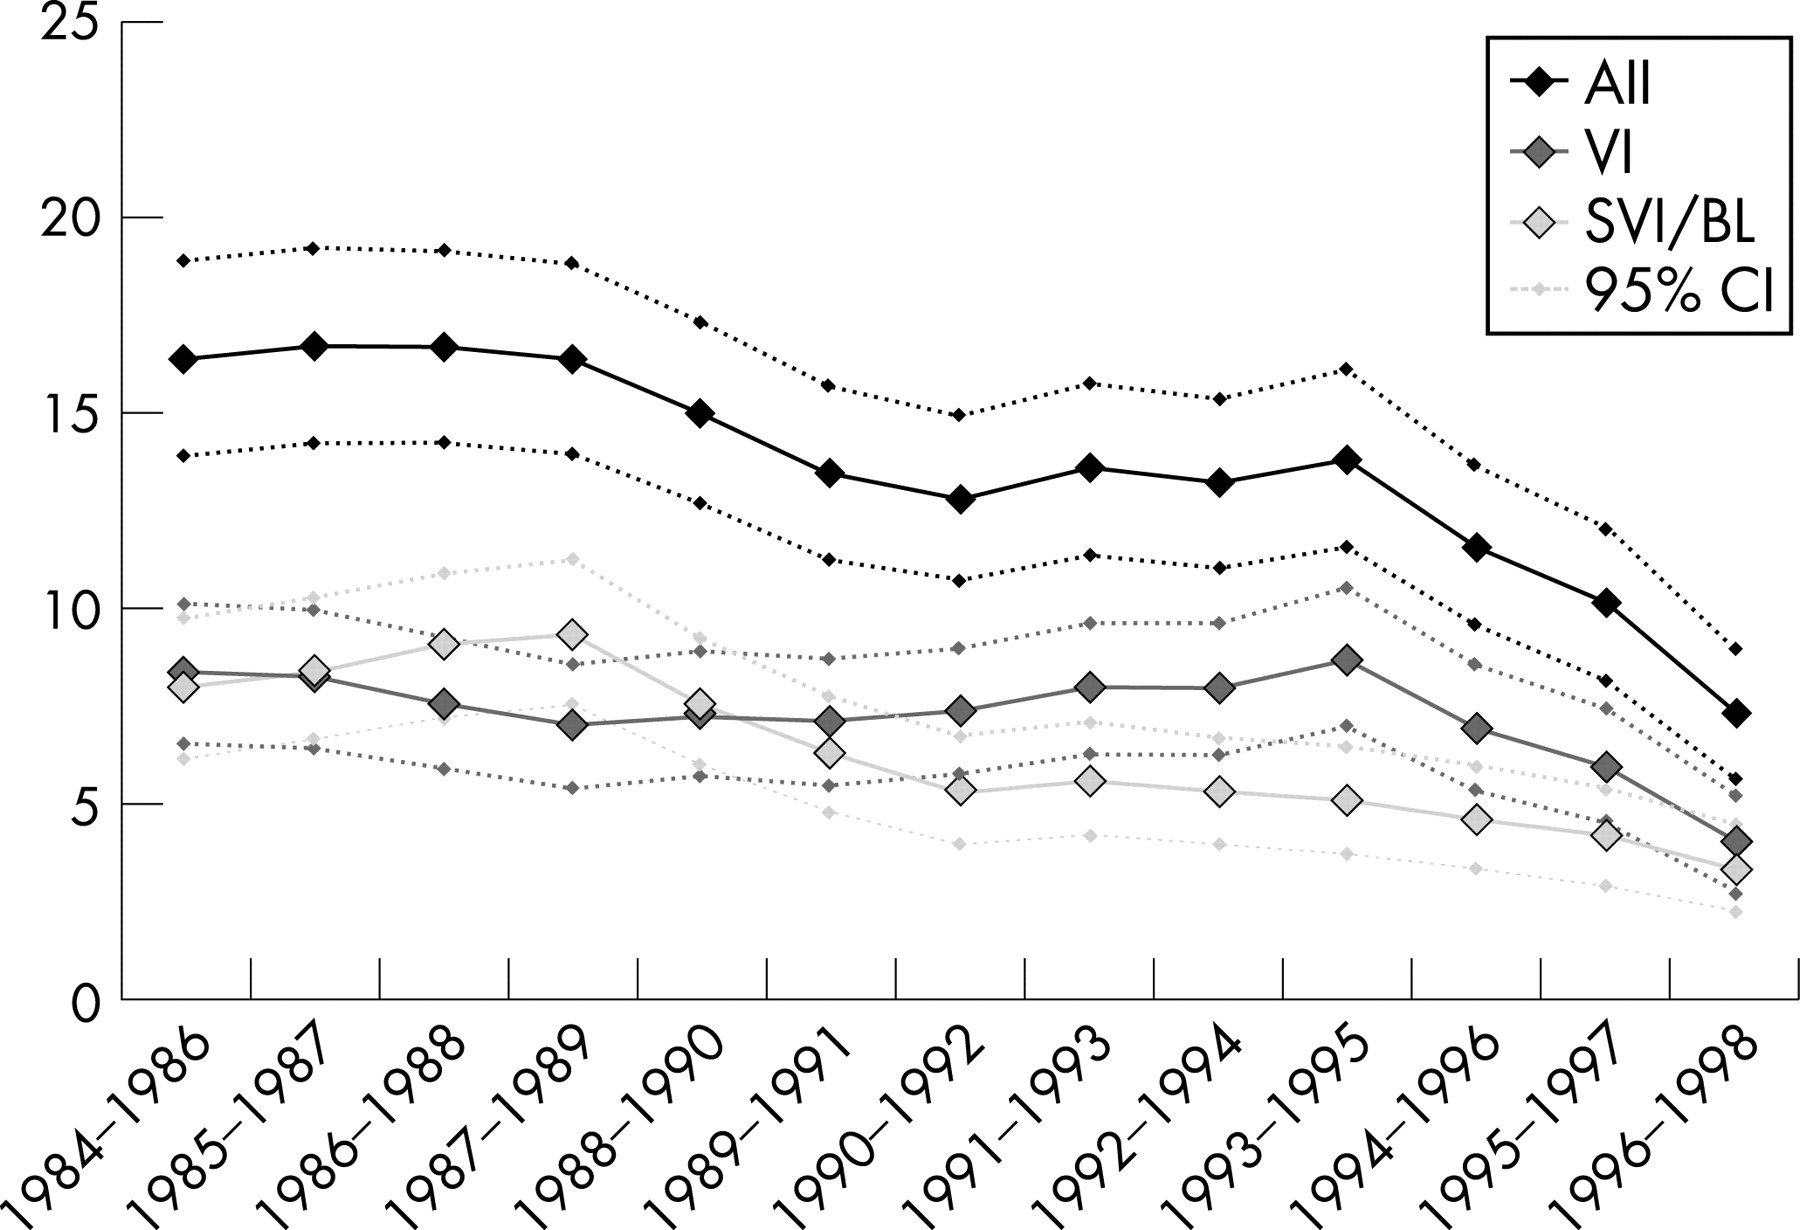
Between 1984 and 1998, there were 520 240 live births and 518 140 neonatal survivors born to the 4Child catchment population. A total of 691 eligible children with visual impairment were notified to 4Child. Of these, 358 (53%) had VI and 323 (47%) had SVI/BL. The total period cumulative incidence of all cases of visual impairment to 12 years of age was 13.3 (95% CI 12.3 to 14.3) per 10 000 live births; for VI it was 7.1 (95% CI 6.4 to 7.8) per 10 000, and for SVI/BL 6.2 (95% CI 5.6 to 6.9). The cumulative incidence of both VI (p = 0.04) and SVI/BL (p<0.01) decreased significantly over time (fig 1). The proportion of children with SVI/BL decreased significantly over time (p = 0.007) (table 1), whereas the male:female ratio of 1.5:1 did not vary significantly over time. The risk of visual impairment in multiples was twice that of singletons (RR 2.1; 95% CI 1.5 to 2.9) and did not differ by severity. The incidence of both VI and SVI/BL was inversely associated with gestational age (fig 2) and birth weight. Compared with the most recent (1994–1998), the two earlier birth cohorts (1984–1988 and 1989–1993) had higher rates of visual impairments at all gestational ages. Although the proportion of all cases who were preterm was relatively stable at around 30% over time, the incidence of visual impairment overall decreased dramatically over time in this group.

Overall, 45% of children with VI had isolated visual impairment which varied significantly over time from 39% in the early period to 56% in the later period (p = 0.01) (table 2). There was no significant variation over time in the proportion (23%) of children with isolated SVI/BL (p = 0.60). Of note, the proportion with cerebral palsy decreased significantly from 39% to 21% among the VI cases (p = 0.003) but not among the SVI/BL group (45% overall) (p = 0.86).
The timing of the insult was ascribed to a single category of cause in 89% of all visual impairment cases, while 9% had two causes and 2% had three. The cumulative incidence of both the prenatal causes and the unknown causes associated with cerebral palsy, developmental delay and microcephaly decreased significantly over time (p<0.001) (table 3). Prenatal causes were the commonest single categories for both VI (65%) and SVI/BL (52%) cases. Most of the children (68%) had only one anatomical site involved, 27% had two sites involved and 5% three sites. Cerebral/visual pathways were the most common sites of involvement, affecting 51% of VI cases and 87% of SVI/BL cases. Of the affected very preterm (<33 weeks) infants in the register, 30% had retinopathy of prematurity (ROP) and 80% had impairment of the cerebral/visual pathways. The cumulative incidences in very preterm births were 46.8 (95% CI 32.3 to 65.7) and 126.3 (95% CI 100.2 to 152.4) per 10 000 live births born at <33 weeks, respectively.
The overall incidence of both ROP and cerebral/visual pathway involvement decreased significantly over the three periods (table 4). The cumulative incidence of potentially preventable or treatable visual impairments among all births decreased over time.
A total of 130 of the 691 children have subsequently died, with the case fatality being 19% (95% CI 16% to 22%). Their age at death ranged from 4 months to 20 years (median 4 years) and 58% died before reaching their fifth birthday.
DISCUSSION
The most striking finding from our analysis is the downward temporal trend in the incidence of visual impairment. Our results suggest that the incidence of any degree of visual impairment roughly halved for births between the mid-1980s and the late 1990s with both potentially preventable and non-preventable causes having decreased over time. Our data also indicate the risk of visual impairment associated with prematurity and low birth weight, especially in the extreme, decreased substantially over this period. Of note, a fifth of the children subsequently died, with over half dying before their fifth birthday. From our data we estimate that at least 13 in every 10 000 children born in the UK will be diagnosed with visual impairment by their 12th birthday, about six of them will be severely visually impaired or blind and many will be affected by other serious impairments. With the present number of births at approximately 720 000 per year, this represents about 950 new cases each year in the UK.
Strengths and limitations
A decline in reporting to the register might explain the decrease in incidence over time, although we think this is unlikely. Whilst always dependent on the receipt of case notifications from clinicians, 4Child is well known to the relevant services and the notification procedures were well established and remained unchanged with respect to requirements for notifications or resources used to ascertain cases during this period. Furthermore, had cases not been notified we would anticipate that these would, in the first instance, be the less severe, isolated cases. However, we found the incidence of both VI and SVI/BL had declined and in fact the proportion of isolated cases had increased rather than decreased over time. We do expect to receive some further notifications for children born in the later period, however, since about 90% of children are notified to the register by age 5, any underestimate is likely to be quite small. Recent comparative data come from the study by Rahi and Cable3 in 2000 and most of the children in that study were born in the same period as the children reported here. We were therefore reassured to find our cumulative incidence estimates of SVI/BL for both 5 (5.8 per 10 000) and 12 years (6.2) were highly consistent with the results of Rahi and Cable (5.3 and 5.9, respectively) and the proportion of SVI/BL cases with associated impairments (77%) was also in agreement with their findings (78%).3
We used the classification developed by Rahi and Cable3 to try to describe the children and their visual impairment in terms of potential preventability and treatability for comparison purposes and to assess the attainability of the VISION 2020 goal for a developed population. We must acknowledge that our capacity to accurately classify children is, however, limited by the extent of the clinical information available to us. Clinical data from population registers are necessarily more limited than clinical data collected in specific time-limited studies and as a consequence some misclassification is likely to have occurred when detailed information, for example whether or not a case of bilateral congenital cataract was autosomal dominant in origin, was not provided. When uncertain we took a conservative approach and designated cases with too little information as not preventable or treatable. We take some reassurance about our data from the fact that our overall estimate of the proportion of potentially avoidable cases of visual impairment was broadly in line with that found by Rahi and Cable.3
Comparison with other studies
We have been unable to identify any other reliable source of incidence trend data in the UK for this period. Our results appear consistent with historical prevalence estimates, although differences in the definitions of visual impairment used and the high early case fatality in our population make direct comparisons difficult.14–17 Elsewhere the number of registers of visual impairment is limited and we have been unable to identify published incidence trend data from them for this period.7 18–20 A Swedish study comparing births in 1962–76 and 1981–95 found a prevalence of VI and SVI/BL combined of 11.7 and 12.3 per 10 000, respectively, although both estimates excluded children diagnosed under the age of 4 years.7 Similarly in France, Arnaud et al found no change in prevalence in births from 1976 to 1985.21 In contrast, in the US Robinson et al found a decrease in the prevalence of congenital blindness from 1945 to 1984.22 More recently, a study in Atlanta, Georgia found a prevalence of visual impairment of 14 per 10 000 for children born in 1988 and 12 per 10 000 for children born in 1992.23
Implications of the findings
Given the relatively affluent population under surveillance, the generalisability of our findings to the whole UK population merits critical consideration. Since Rahi and Cable found that children from the most deprived socioeconomic group were over-represented in their study population,3 it seems probable that our results would under-estimate the UK population incidence to some extent. Whilst we are unable to investigate this possibility, the consistency of our findings for SVI/BL with those of Rahi and Cable3 provide some reassurance that any under-estimate is likely to be quite small. Furthermore, temporal trends in absolute risk are unlikely to be area specific, unless our population suffers from a substantially different range of causes of visual impairment than the rest of the UK. Again this seems unlikely as the distribution of causes, anatomical sites affected (data not shown) and the proportion of isolated cases were broadly similar to those found by Rahi and Cable3 in the UK and other researchers in Scandinavia.20 24 The longitudinal nature of our data collection and mortality information allowed us to document the risk of death associated with visual impairment. Our estimate of case fatality of one in five is probably higher than previously anticipated for an industrialised population.3 25
Our findings raise the question: what has caused this decline in incidence? The combination of the wide range of anatomical sites involved and the relatively small number of cases in each diagnostic category make specific changes difficult to detect. Whilst a decrease in preventable and potentially preventable visual impairment might be expected, we also found a decrease in visual impairment associated with causes that are not at present specifically preventable. This suggests that the decrease in incidence is related to general improvements in health and health care together with the prevention and treatment of specific conditions, for example, congenital rubella, Reye syndrome and retinopathy of prematurity.26 There have been substantial specific changes in perinatal practices during this period, including the widespread introduction of antenatal steroids and surfactant, and changes in ventilation practices, which might also have had an impact, particularly on the risk of visual impairment associated with, for example, insult to the cerebral/visual pathways, especially in infants born preterm.27 At the same time it should be noted that one of the largest groups showing a decline is the cerebral/visual pathway group. This group of children presents the greatest diagnostic challenge and vision testing is often limited by the children’s inability to respond to vision tests, so under-notification over time must therefore remain a possibility for this group.
What is already known on this topic
In the UK the cumulative incidence of severe visual impairment/blindness is estimated to be 5.9 per 10 000.
The prevention of visual impairment is a priority within the World Health Organization’s VISION 2020 programme.
What this study adds
There is evidence of a temporal decline in incidence of visual impairment and severe visual impairment/blindness between the mid-1980s and the late 1990s.
Thirteen in every 10 000 children born in the UK will be diagnosed with a visual impairment by their 12th birthday, about six of them will be severely visual impaired or blind, two thirds will be affected by other serious impairments and one in five will die during childhood.
Despite the wide and complex range of underlying causes, the decrease in the incidence of all causes of visual impairment suggests that the goal of VISION 2020 may yet be realised for children in the developed world.
Conclusions
For the majority of visually impaired children in the UK, visual impairment is part of a wider picture of sensory, cognitive and/or structural impairments3 associated with limited life expectancy for a substantial proportion. Despite the wide and complex range of underlying causes and the high proportion of cases which are not potentially preventable at present, the decline in incidence we have observed provides some hope that the goal of VISION 2020 may yet be realised for children living in the industrialised world.
Acknowledgments
We are grateful to the notifiers to 4Child since without their contribution it would not be possible to run the register. Our thanks also go to the 4Child Advisory Group and Andy King, Helen Newdick and Madelana Gallagher who are involved in running the register. The 4Child register was established by a group under the leadership of Dr Ann Johnson and without their foresight this work would not have been possible.
REFERENCES
Footnotes
Funding: This work was carried out at the National Perinatal Epidemiology Unit which is funded by a grant from the Department of Health, England. 4Child is funded by the Department of Health Policy Research Programme under the Research Active Disease Registers Funding Initiative. JJ Kurinczuk was partially funded by a National Public Health Career Scientist Award from the Department of Health NCC RCD (PHCS02). F Bodeau-Livinec was funded by the French Ministry of Foreign Affairs, the French Society of Perinatal Medicine and GlaxoSmithKline. The various funding sources had no involvement in the design or conduct of any stage of this work, or in the decision to submit for publication. The views expressed in this paper are those of the authors and not necessarily those of the Department of Health.
Competing interests: None.
- Abbreviations:
- ONS
- Office for National Statistics
- SVI/BL
- severe visual impairment/blindness
- VI
- visual impairment