Article Text

Abstract
Background: Clinical vital signs in children (temperature, heart rate, respiration rate, and blood pressure) are an integral part of clinical assessment of degree of illness or normality. Despite this, only blood pressure and temperature have a reliable evidence base. The accepted ranges of heart and respiration rate vary widely.
Methods: This study examined 1109 children aged 4–16 years in their own schools. Age, sex, height, weight, and resting respiration rate and heart rate were recorded. The data were used to produce age related reference ranges for everyday clinical use.
Results: Reference intervals are presented for the range of heart rate and respiration rate of healthy resting children aged 4–16 years. The recorded values are at variance with standard quoted ranges in currently available texts.
- HR, heart rate
- RR, respiration rate
- respiratory rate
- heart rate
- reference range
Statistics from Altmetric.com
Clinical decision making relies on the history, examination, and results of selected investigations. As part of the general clinical examination, four vital signs are routinely recorded: heart rate, respiration rate, blood pressure, and temperature.
In order to derive clinically meaningful information for the paediatric patient, we must compare the vital signs recorded against a normal or reference range. Normal values for temperature are well established1 and there is good evidence for normal values of blood pressure at various ages.2–,4 With regard to respiration rate (RR) and heart rate (HR), however, there is little evidence on which to base our “normal” values. Despite this, textbooks produce tables of reference values for various age groups, based on small numbers of patients. Bates’ guide to physical examination and history taking5 states that the normal values for RR in a newborn “should be 30–60, reducing to 20–40 in early childhood and 15–25 in older children”. The same book states that the normal HR for a newborn should be 140, reducing to 115 between 6 months and 1 year, 110 between 1 and 2 years, 103 between 2 and 6, 95 aged 6 to 10, and 85 between 10 and 14 years. Both the Forfar and Arneill6 and Nelson7 textbooks also quote ranges of values.
These values produce widely differing ranges of what may be termed normal for healthy children. In a 1 year old, for instance, the range of RR values is from 25 to 60: a rate of 30 would be considered normal in some of these texts, while others consider this bradypnoea and recommend intervention.
In view of the lack of evidence behind the values that are commonly quoted, we undertook a study in Plymouth, UK, to investigate the reference ranges of heart rate and respiration rate in healthy, resting schoolchildren.
The aim of this study was to produce up to date reference ranges of heart rate and respiration rate for healthy resting children aged 4–16 years.
METHODS
Plymouth was chosen as the site of the study as it is a fairly typical medium sized town, situated at sea level in the southwest of the UK. It has a population of 240 000 and a fairly typical socioeconomic mix.8
Ethical approval was obtained through the South Devon Local Regional Ethics Committee. Following sample size calculations and estimates of likely consent rates, eight schools in Plymouth, Devon were approached; six agreed to take part in the study. The schools were chosen at random from lists of primary and secondary schools supplied by the local education board: four primary and four secondary schools were selected. Random number generation of subjects was undertaken by computer.
All children aged 4–16 years were asked to participate. After explanation to the children and their parents (in the form of a letter, and a presentation at the schools’ assemblies), parental consent was sought for each child; in addition, children over 12 were asked to give their own consent. Children were excluded from the study if consent was refused or the form was not returned.
All children were seen in their school by a single investigator (LAW), in the presence of a female nurse chaperone. Children were brought out of their classrooms and left to sit quietly in a warm waiting area for 10 minutes.
The children then sat quietly in a warm, well lit classroom while their RR was measured by 60 seconds of direct observation of the clothed chest wall (by LAW). A partially completed breath in the 60 second time period was counted as a whole breath.
Each child then had their HR measured for 60 seconds using a Datex S5 Lite monitor. A finger probe was used in all cases. Recording did not commence until a suitable trace with a regular, pulsatile waveform was achieved continuously for 20 seconds. Data were transferred real time to a computer, using Datex software: recordings were made at 5 second intervals for 60 seconds. The mean of these recordings was registered as the child’s HR.
Height and weight were recorded. Height was measured barefoot using a Leicester height measure: weight was also taken barefoot, with scales calibrated by the Department of Medical Physics at Derriford Hospital, Plymouth.
Children who were unwell on the day of the study (but were well enough to attend school) were still included in the sample, as were children with diagnosed or undiagnosed medical conditions. No attempt was made to identify these children in the database.
Statistical methods
Age was recorded as the age in years at the preceding birthday. The data were therefore treated as 13 separate frequency distributions, one for each year of age from 4 to 16. Preliminary analyses showed only small differences between the boys and girls in either HR or RR, and the data have been analysed for the two sexes together.
Calculation of the cumulant ratios27 showed that the HR distributions were slightly skewed to the right. This was corrected for by logarithmic transformation. The means and standard deviations of the transformed data were calculated and smoothed by cubic and linear polynomials respectively. Upper and lower reference limits were calculated as mean ±1.96 SD and back transformed.
The RR distributions were more irregular in shape, especially at the older ages where a “floor” effect at 10–11 bpm was evident. The empirical 2½ and 97½ centiles were calculated and smoothed by linear fits.
Details of the smoothing equations are provided in the Appendix.
RESULTS
Demographics
Six schools took part in the study, with a total of 3592 pupils. A total of 1153 children agreed to participate, but 44 failed to show to have their data collected. A total of 1109 children aged from 4 to 16 years were assessed.
The numbers of subjects and the spread of their ages are shown in table 1⇓ (throughout these results, each year group refers to the period from the day of that birthday to the day prior to the next birthday).
Distribution of sex and age
Height and weight
The mean heights and median weights of the population studied were plotted between the 50th and 75th centiles on the UK 90 Growth Charts for the United Kingdom.9
Respiratory and heart rate related to age
Using the methods described in the Appendix, the fitted reference values are shown in table 2⇓. The values are shown as integers, rounded towards the median, with 95% reference interval (2½, 97½ centiles). The 2½ and 97½ centiles of HR and RR are shown plotted in figs 1⇓ and 2⇓.
Respiration rate and heart rate; median and 2½, 97½ centiles by age
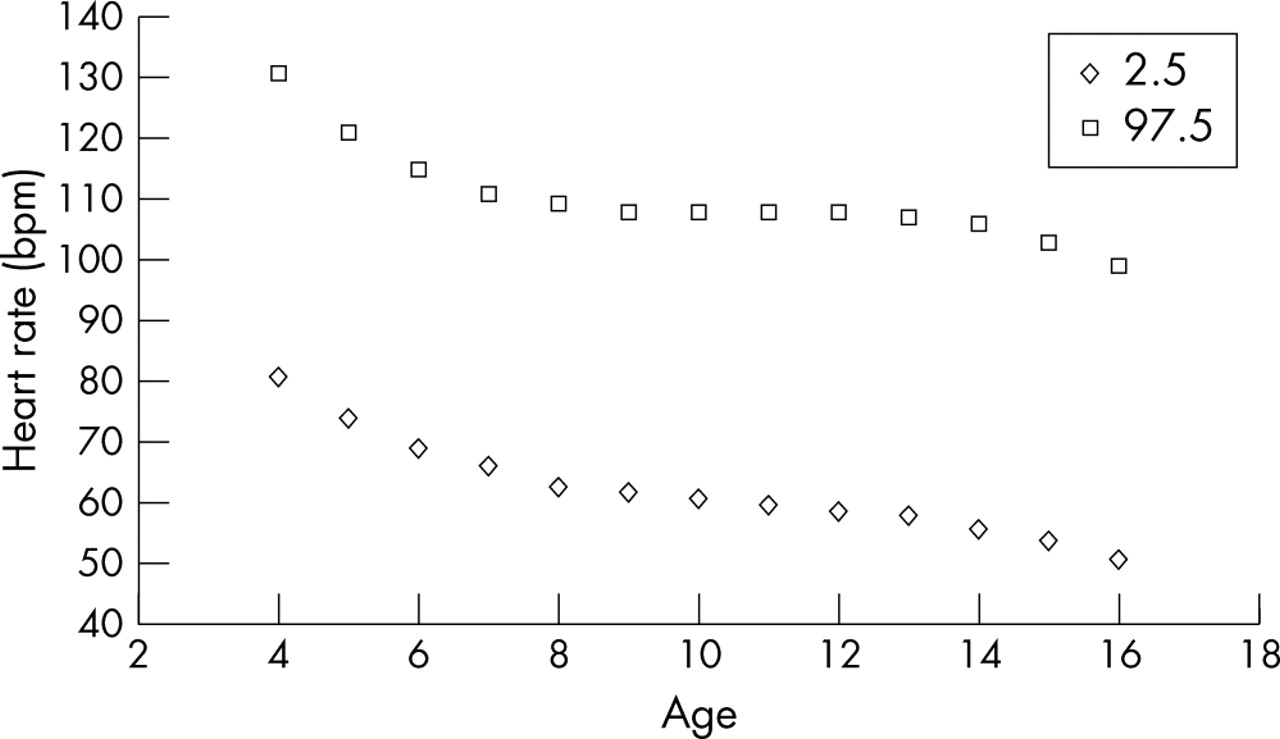
Heart rate by age (years) (2½, 97½ centiles). bpm, beats per minute.

Respiratory rate by age (2½, 97½ centiles). bpm, breathes per minute.
Respiratory and heart rate related to height and weight
The correlations of HR and RR with height and weight in each age group were calculated. All were small; the average correlations with height were −0.10 for HR and −0.03 for RR, while those for weight were −0.22 for RR and −0.15 for HR. The tendency towards negative values may reflect the negative trend of HR and RR as against the positive trend of height and weight with age within the age groups. There appears to be no case for considering height and weight in assessing HR and RR.
DISCUSSION
Evidence base
Most (although not all) clinicians agree that RR is a useful and important sign to measure.10 However, there are little data to support the values that are given as “normal”, and most cannot be considered applicable to healthy children in the developed world of the 21st century. Available studies fall into two groups: those looking at children who are ill or are attending an emergency department (ED), and those looking at RR of healthy children at rest.
There have been a number of studies in the first group. These give useful information, but none can be applied to healthy resting children. Morley and colleagues11 studied babies up to 6 months of age who had signs of respiratory infection: data on older children with respiratory problems are in plentiful supply.12–,14
In 1992, Hooker et al presented a series of 434 children presenting to an ED, concluding that RR was inversely proportional to age:15 the data provided mean, standard deviation, and range values for each year from birth to 18 years. However, although children presenting with fever or primary cardiorespiratory symptoms were excluded, the study made no allowance for changes in RR due to pain, symptoms unrelated to the cardiorespiratory system, or simply the anxiety of being in a hospital ED. Furthermore, rates were recorded by different duty triage nurses, introducing an unquantifiable element of interobserver variability: this reduces the reliability of these measurements.16
The first available data on breathing rates in resting children came from Quetelet,17 who studied the RR of 300 patients, including an unknown number of children at birth, 5 years, and 15–20 years. However, this was in 1835 and the data cannot be generalised to a modern setting: we do not know the sample size, their state of health, or where they came from. In 1952, Iliff and Lee18 produced reference ranges for RR, but they measured only 188 children in total (birth to 18 years) and the children were either awake or sleeping, which leads to difficulties in interpreting the data. Furthermore, these children lived in Denver, Colorado at one mile altitude where the lower partial pressure of oxygen could have significantly influenced the results.
Cook and colleagues19 and Nelson and colleagues20 both published small data series (25–38 children) on children up to 1 month of age, but had no data on older children. In 1993, Marks and colleagues21 published a data set of 416 children from 1 to 7 years of age (293 awake, 123 sleeping). From these data, reference centiles were produced for RR both awake and asleep. There are two major limitations in their data. Firstly, although the children were at rest when they had their data recorded they were made to wear a nasal thermocouple to undertake the reading—there is good evidence that applying any form of mechanical device to measure respiratory parameters induces changes in the value recorded.22 Secondly, although nasal thermocouples have been shown to be accurate in measuring RR,23 this is not the method that is used in everyday clinical practice: we use direct observation, with or without a stethoscope.
The most reliable data on resting RR in children comes from Rusconi and colleagues,24 who reported 618 children aged 15 days to 3 years, quietly resting or asleep. They had their RR measured by direct auscultation with a stethoscope for one minute. This data was used to produce age related centile curves. They found that:
Respiration rate drops rapidly from birth to 3 months of age
Respiration rate norms are widely spread for a given age, with most variation in the first three months of life.
From the available research, therefore, reference values for RR that are reliable and are of use in well children are only available up to 3 years of age.25
With regard to HR, once again there is scant evidence in support of the values that we accept for our day-to-day practice as “normal”. Available data regarding resting heart rates in children come from four main sources. All have limitations that prevent us extrapolating their data to healthy resting children in the UK of the 21st century.
In 1944 Shock produced data on resting HR in five boys and 50 girls aged between 11 and 17 years.26 However, the children were examined in a laboratory while fasting: furthermore, the data represent only a small sample of a restricted age group, and measurements were made 60 years ago.
Iliff and Lee undertook measurement of HR in children aged between 1 and 18 years of age, both awake and asleep.18 The sample size was only 197, with small numbers in each year group, and the data are now 50 years old. Furthermore, as previously mentioned, these children’s recorded values are likely to have been affected by the one-mile altitude at which they lived.
Data were collected in 1978 by Voors et al in Bolagusa, New Orleans, on 3590 resting schoolchildren aged 5–17 years, as part of a bigger epidemiological study.2 These data were recorded in a hospital laboratory environment, which may have an unquantified effect on the HR recorded.22 Their research efforts were concentrated on the epidemiology of hypertension, and the data on resting HR were only presented as unsmoothed centile charts: age ranges are not provided.
What is already known on this topic
Heart rate and respiratory rate vary in children in relation to age
Age related ranges for respiratory rate are available up to 36 months of age
Dark and colleagues4 have recently produced data on HR in 10 600 children of all ages: however, the study was aimed at producing reference ranges for injured and sick children, not a healthy population. Furthermore, data were taken from multiple hospitals over a period of ten years: this may introduce an unquantifiable degree of interobserver variation into the data collected.16
There is no reliable, contemporary evidence for resting heart rate in healthy children. These papers are summarised in table 3⇓.
Evidence base for heart and respiration rate values
Location of study
There is recent evidence that young Plymouth children (born in 1996–97, measured at age 24 months) are heavier than the standard UK centiles:27 the mean difference from the centile chart was 0.33 standard deviations (460 g). These results may not necessarily be applicable to older Plymouth children (born pre-1996), who form the bulk of this study (the youngest children were aged 4 years, born in 1997). Furthermore, the absence of similar data from other UK towns does not mean that Plymouth is abnormal—these data may be fairly typical, but in the absence of further evidence this is not yet clear. However, population data suggest that Plymouth children may be considered fairly representative of children in the UK, albeit from a limited ethnic mix.
Measurement technique
With regard to measurement of the physiological parameters, the method that was chosen was the one that most closely reflects our day-to-day practice.
Respiration rate
Some authors have suggested that the most accurate way of recording RR is through the use of machinery such as a pneumogram.23 However, this clearly does not reflect our day-to-day clinical practice. Furthermore, there is good evidence that the application of machinery to the child produces and increase in the RR.22 This idea was therefore discounted.
The time period for measurement of the RR has been shown to be accurate28 and is recommended by many sources, including Bates’ guide to physical examination and history taking,5 and the World Health Organisation.29 Simoes and colleagues28 showed that direct observation provides an accurate measurement of paediatric RR: they found a mean of 1.79 breaths per minute variation from the values recorded by pneumogram. Rusconi and colleagues24 compared direct observation for 60 seconds with auscultation by stethoscope for the same time period. They found that the observed rate was a mean 1.8–2.6 breaths per minute lower than the auscultated rate. However, most practitioners routinely undertake RR measurement by direct observation, not auscultation- and so this method was employed in this study. Previous data have shown this method to be accurately repeatable.24
Heart rate
In everyday practice, two methods are used to measure HR. The first is direct palpation of the radial artery at the wrist, a method that is widely practiced throughout the country. The second method that is commonly employed is through electronic means of recording HR: this is now standard practice in EDs and wards (although not as common in primary care settings). The HR is often recorded at the same time as blood pressure and peripheral cutaneous oxygen saturations using a monitor. Previous research has shown that the rate recorded by this means correlates very closely with that recorded at the radial artery at the same time.30
What this study adds
Data for heart rate and respiratory rate are provided for children who may be considered fairly typical of British schoolchildren
Evidence based reference ranges of heart rate and respiratory rate for schoolchildren aged 4–16 years are provided
There is good evidence that applying machinery to record RR alters the recorded rate:22 there is no evidence of the presence or magnitude of a similar effect on HR. Although it is logical to extrapolate from Gilbert’s work that an effect may be expected with regard to heart rate, there is a significant difference between the use of a device applied tightly to the face and an oxygen saturation probe applied to the finger. While we accept that this may have an effect on the HR recorded we believe that this will be no more significant than the effect of taking a pulse by palpation.
Electronic means (using a Datex S5 Lite monitor) were chosen to record this parameter, for ease of measurement, reliability, accuracy, and clinical relevance.
Bias
Of 1153 children who agreed to participate in the study, only 44 did not attend the sessions: they either did not want to take part at the last minute (28), or were not at school on the day in question due to illness (n = 9) or other reasons (n = 7). It is accepted that children with chronic illness may have been deliberately withheld from the study, although what magnitude of effect this would have on the results, if any, is unclear.
No attempt was made to identify those children with minor illness on the day of study: the fact that they were well enough to attend school should allow them to be considered as part of a normal, healthy population. Marks et al identified children with upper respiratory infections in their study, and found that although up to 49% of their patients had minor respiratory symptoms (most of their subjects were in childcare centres and kindergartens) this had no apparent effect on the respiration rate.21
The reference ranges
The data are presented in table form (for simplicity of reference) as median and 95% reference interval (whole integers rounded towards the median). These figures differ significantly from the values quoted in common medical texts. This study provides evidence based reference ranges of HR and RR in healthy children, for day-to-day clinical use throughout the UK. However, we have not provided any data on children aged under 4 years, and there is a need for such ranges to be determined.
Conclusion
This study has shown that the range of published “normal” values for heart rate and respiration rate varies widely depending on the source referred to, and has shown the lack of evidence behind these values.
Reference ranges have been presented for respiration rates and heart rates in healthy schoolchildren aged between 4 and 16 years, at rest. Information regarding the relation of heart rate and respiration rate with height and weight has been presented. These children’s height and weight fit closely to modern centile growth charts and they can therefore be taken as representative of “normal” schoolchildren.
There is a need for similar information to be made available from children aged under 4 years, although Rusconi et al have produced good data on respiration rates in this age group.24 Data on heart rates in this age group are poor.
APPENDIX
Heart rate
The fitted equations for the mean and SD of HR were:
Mean log10(HR) = 1.941 − 0.003293*age + 0.000652*(age−10)2 − 0.0002861*(age−10)3
SD log10(HR) = 0.04745 + 0.001709 × age
(where “age” denotes age in years at last birthday).
The observed means and SDs with the fitted equations are shown in fig 3⇓. If required, HR can be expressed as a z-score in the usual way by calculating (log10(HR) − mean)/SD).

(A) Mean log10 (heart rate) against age. (B) Standard deviation log10 (heart rate) against age.
Respiratory rate
The fitted equations for the 2½ and 97½ centiles of RR were:
2½ centile = 21.95 − 0.7239 × age
97½ centile = 28.56 − 0.6051 × age
Acknowledgments
We are indebted to the pupils and staff of the following Plymouth schools, without whom the study could not have taken place: Devonport High School for Girls, John Kitto Community College, Plymouth College, Widey Court Junior, Chaddlewood Primary, Chaddlewood Junior. We would also like to thank the nurses who gave their time to help with the study.
REFERENCES
Footnotes
Competing interests: none