Article Text

Abstract
Background This study used national data to determine if violent child death rates fell between 1974 and 2008.
Design Using mortality data from the Office of National Statistics, categories potentially containing violent child deaths were analysed for children aged <1, 1–14 and 15–19 years. These data were compared with Home Office data on recorded homicides in children aged <1 and 1–15 years.
Results Annual rates of infant deaths registered as due to assault fell between 1974 and 2008 from 5.6 to 0.7 per 100 000 infants; those in children (1–14 years) fell from 0.6 to 0.2 per 100 000. When these deaths are combined with those registered as undetermined intent, rates are higher but still show a decline in both groups. There is a slight fall in the rates of police recorded homicides in infants, but no observable change in childhood rates. In adolescents, the rates of death from assault fell during the 1970s and have since remained static in females but have risen in males. When these deaths are combined with those registered as undetermined intent, the rates for adolescent women have remained static at 2.0 per 100 000, while for young men they increased from 3.3 to 5.7 per 100 000 before declining to 4.2 per 100 000.
Conclusion These data provide evidence that rates of violent death in infancy and middle childhood have fallen over the past 30 years. In contrast, rates in adolescence have remained static or risen over the same period.
Statistics from Altmetric.com
Introduction
Worldwide it has been estimated that as many as 53 000 children each year die through homicide,1 however, as with most measures of child maltreatment, there may be under-reporting of abuse related deaths. The deaths of Victoria Climbié in 2000, Holly Wells and Jessica Chapman in 2002 and Peter Connelly in 2007 and the subsequent public inquiries2,–,4 were highly publicised amidst much criticism of the ‘failure’ of child protection services in this country to actually protect children. The nature of these cases, the strong sentiment they evoke and the endless reviews and reforms which follow them mean that cases of violent child death are rarely out of the media spotlight.
Despite the media coverage and public perception which suggest this problem is increasing, a review of WHO data claimed that violent child deaths in England and Wales had actually fallen by 70% between 1974 and 2002, and that this decline was greater than in almost all other major developed countries.5 6 In order to clarify and describe any changes in rates of violent child deaths in England and Wales, we reviewed available source data on causes of child death published by the Office for National Statistics (ONS) and on recorded homicides published by the Home Office from 1974 to 2008.
What is already known on this topic
▶ The number of violent child deaths in England and Wales is not known.
▶ It has been suggested that rates of violent death have fallen over the past 30 years.
What this study adds
▶ Rates of violent death in infancy and middle childhood have fallen over the past 30 years, while rates in adolescence have remained static or risen.
▶ Each year 5–15 infants, 15–45 children and 32–117 adolescents die violent deaths.
▶ Rates are higher in adolescent males than females.
Methods
Data were drawn from the Registrar General's national mortality statistics series showing cause of death (DH2), which have been published annually by the ONS since 1974, and the more recent mortality statistics (DR). Data on homicides were taken from the Home Office crime statistics for England and Wales, supplementary volumes on homicides, firearm offences and intimate violence (available at http://www.homeoffice.gov.uk/rds/).7,–,11 These publications provide data on numbers and rates of different causes of death broken down by age categories, and of offences initially recorded by the police as homicide broken down by age and sex of the victim, and relate to England and Wales.
The mortality statistics from the ONS use the International Classification of Disease (ICD). Between 1974 and 2007 three different editions have been used: ICD-8 was used from 1974 to 1978, ICD-9 was used from 1979 to 2000, and ICD-10 has been used since 2001.12,–,14 The categories which potentially contained violent deaths and their corresponding classification codes are listed in table 1 (further details of the specific ICD codes used are available from the authors or at http://www.who.int/classifications/icd/en/).
International Classification of Disease (ICD) categories for homicide and other external causes of child death
Data from the Registrar General's reports from 1974 and the Home Office Crime Statistics reports from 1975 to 2008 were entered into an Excel database and double checked for accuracy prior to analysis. Rates of child death (deaths per 100 000 population) were calculated from the numbers of child deaths and the overall population for each age group. Infant mortalities were expressed as deaths per 100 000 population rather than per 1000 live births to allow comparison with other age groups. Changes in death rates over time were modelled using logistic regression. Secular change was investigated using calendar year, with quadratic and cubic terms used to capture changing decreases or increases. The effect of changes in ICD coding was assessed by indicator variables, as were anomalous results. Changes in deviance were used to select covariates for inclusion, using a 5% significance level. Rather than presenting individual regression coefficients, fitted curves have been used to present the data visually as this gives more meaningful results in this context. Rates quoted in the text are those estimated from the fitted curves rather than absolute rates for the first and final years, to account for year-on-year fluctuations.
As this was a study using publicly available and anonymous secondary data, ethics approval was not required.
Results
Between 1974 and 2008, total infant, child and adolescent mortality in England and Wales fell from 113 to 26 per 100 000, an overall 77% drop in mortality over this period. Mortality is highest in infancy, dropping to very low levels in the middle childhood years and rising to intermediate levels in adolescence. At all ages, rates are higher in males than in females for all causes of death combined and for all external causes of death.
Infants (<1 year)
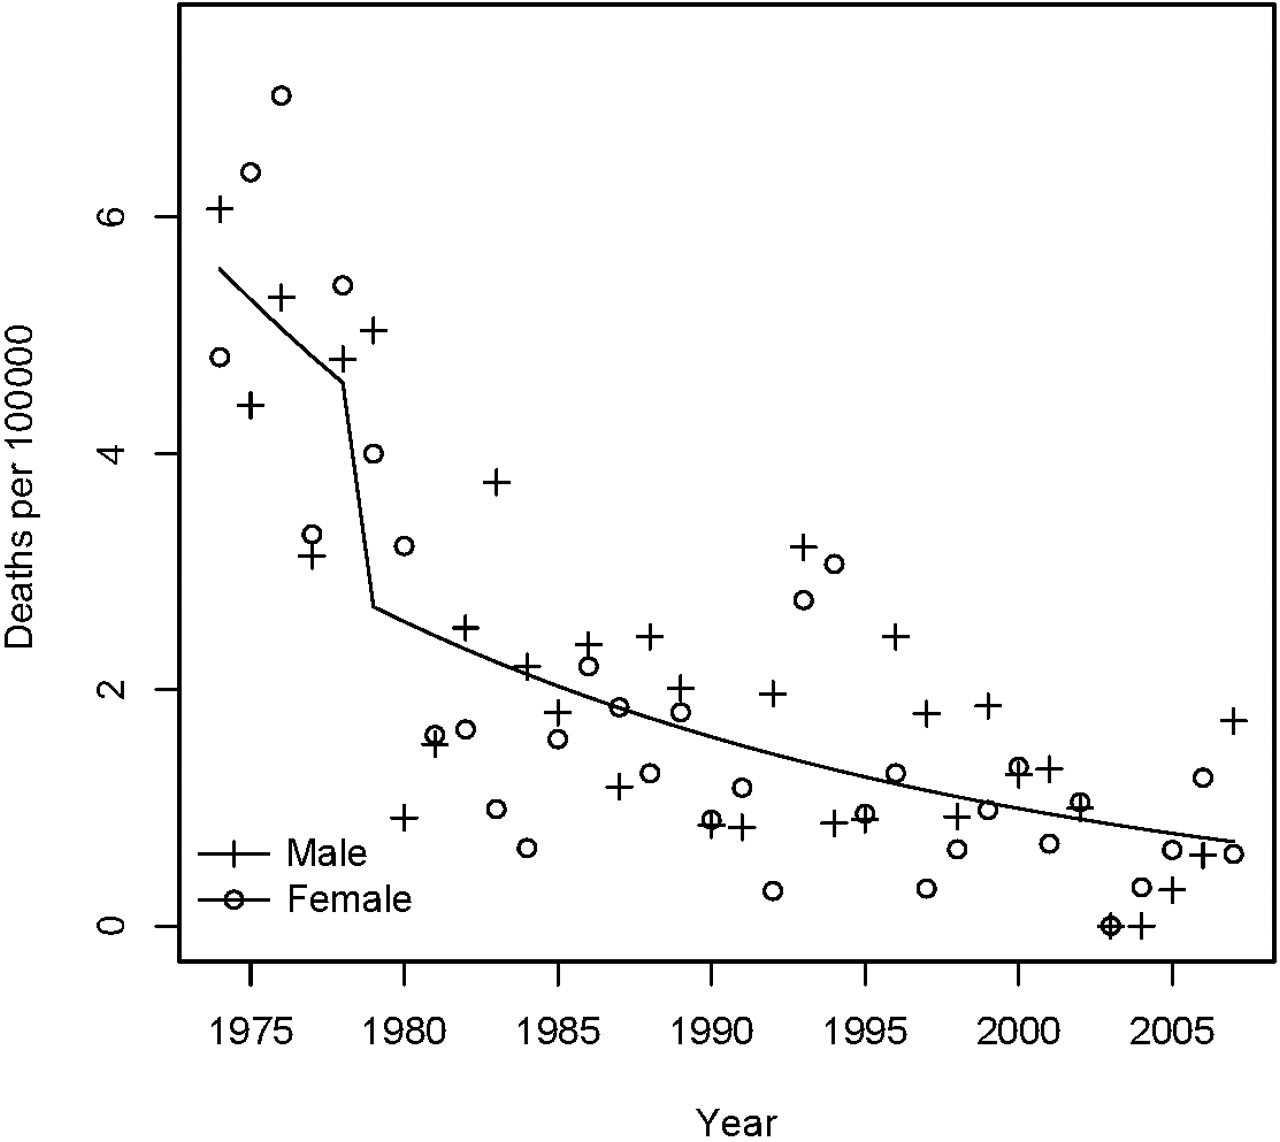
The death rate from assault for infants decreased by 5% per year from 1974 (5.6 per 100 000 population; 0.056 per 1000 live births) to 2008 (0.7 per 100 000 population; 0.007 per 1000 live births), with no difference between girls and boys (appendix 1 and figure 1). This equated to absolute numbers of 33–36 in the mid 1970s falling to 6–8 in 2006–2008. The change to ICD-9 in 1979 was associated with a drop in mortality attributed to assault. Among infants, the combined death rate for all assault, undetermined intent and unknown causes was dominated by the large numbers of deaths from unknown causes (including sudden infant death syndrome, SIDS), rising to a peak in the late 1980s followed by a very rapid decline to 1992 and a steady decline thereafter (figure 2).

Infant death rates from assault per 100 000.
Infant death rates from all assault, undetermined intent and unknown causes per 100 000.
Infant (0 to <1 year) deaths
In 1986 new stillbirth and neonatal death certificates were introduced in the UK. These use a different method of classifying the cause of death, as a result of which it is not possible to directly compare neonatal and postneonatal causes of death. The data from 1986 onwards therefore exclude deaths before 28 days of age. In order to ascertain the impact of this change on the data, we examined ONS data on infant death from 1999 to 2007. Neonatal (under 28 days) deaths classified as assault or undetermined causes averaged 0.47 and 0.46 deaths per 100 000 per year (male and female combined), respectively, during the period 1999–2007. Neonatal deaths classified as unknown (including SIDS) during this period averaged 7.8 and 7.6 per 100 000 per year for males and females. Thus our calculated rates for infant deaths from assault and undetermined causes from 1986 onwards will be lower than the actual rates, by up to 28%, but the trends are unchanged.
Numbers and rates of recorded infant homicides showed considerable year-on-year variation (figure 3). Rates of infant homicides were in the range of 4–6 per 100 000 for boys and 3–5 per 100 000 for girls, with an apparent drop in both over the most recent years. Numbers of recorded infant homicides were 31–49 in 1974–1976 and 16–24 in 2006–2008.

Rates of recorded homicide per 100 000 infants and children.
Children (1–14 years)
For children (1–14 years), the death rate from assault decreased by 2% per year from 0.6 per 100 000 in 1974 to 0.2 per 100 000 in 2008 (appendix 2 and figure 4). There was no gender difference. Numbers fell from 49–71 in the mid 1970s to 16–19 in 2006–2008. The changes to ICD-9 and ICD-10 are both associated with further drops in mortality attributed to assault. The combined rate for all assault, undetermined and unknown causes rose to a peak in the 1980s of 1.3 per 100 000 in boys and 1.1 per 100 000 in girls before decreasing to 0.9 per 100 000 in boys and 0.75 per 100 000 in girls by 2008 (figure 4).

Child (1–14 years) death rates from assault, and combined (all assault, unknown causes and undetermined intent) per 100 000.
Child (1–14 years) deaths
Rates of recorded homicides in children (1–15 years) were much lower than those in infants and did not show any evidence of decline (figure 3). For 1–15-year-old boys, rates were stable between 0.47 and 0.58 per 100 000. In girls, there was an increase from 0.35 to 0.58 per 100 000 by the mid 1980s before falling to 0.35 again. Although there was no evidence of a decline in rates, absolute numbers fell from 49–77 in 1974–1976 to 31–52 in 2006–2008.
Adolescents (15–19 years)
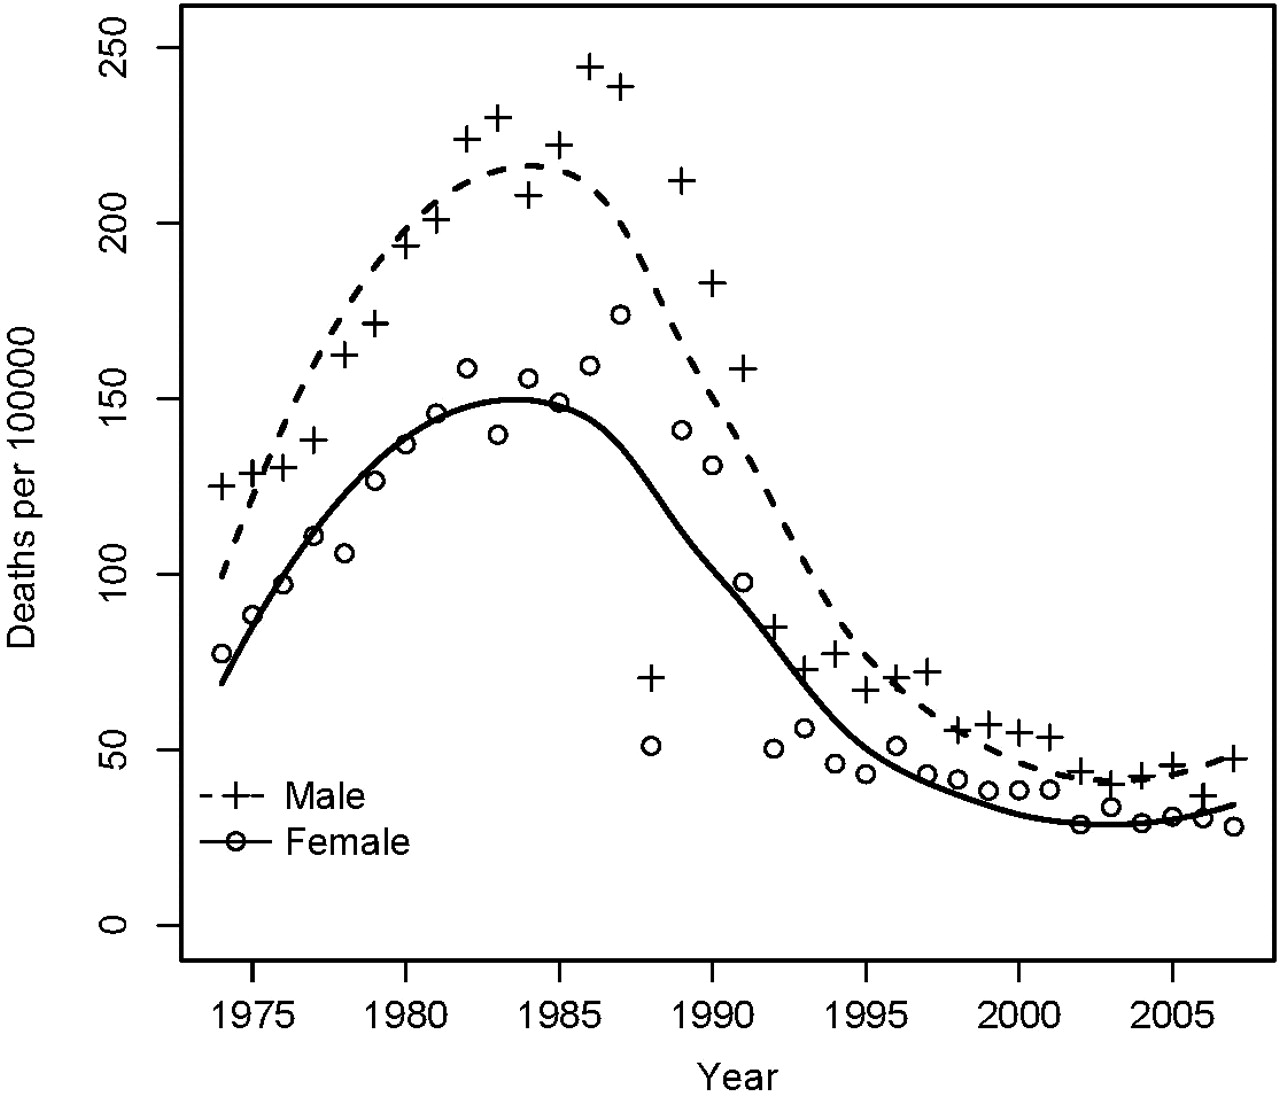
For young women (15–19 years), the death rate from assault decreased from 1.3 to 0.5 per 100 000 over the 34 years (appendix 3 and figure 5). However, the rate for young men is not only higher, but after declining from 1.6 to 0.8 per 100 000 in the late 1980s, increased again to 1.3 per 100 000 by 2008. Numbers of adolescent deaths from assault were 41–47 in 1974–1976 and 23–35 in 2006–2008. There were no changes associated with the shifts to ICD-9 and ICD-10. In adolescents, the combined death rate for young women was constant at 2.24 per 100 000 for all assault, undetermined and unknown causes combined (figure 5). For young men, the death rate for all assault, undetermined and unknown causes increased from 3.4 per 100 000 to 6.2 per 100 000 by 1997–1999 and then declined to 4.9 per 100 000 by 2009. No data were available on police recorded adolescent homicide.

Adolescent (15–19 years) death rates from assault, and combined (assault, unknown causes and undetermined intent) per 100 000.
Adolescent (15–19 years) deaths
Discussion
By directly analysing source data from the ONS, this study has confirmed the findings of Pritchard and colleagues5–6 that rates of registered deaths from assault in infants and children have reduced since the 1970s. In contrast, rates of fatal assaults in adolescence have remained static or risen. The pattern for recorded homicides is less clear, with some indication that rates in infancy have fallen, but no evidence of any change in childhood homicides.
On closer inspection of the data some important patterns emerge. Rates of violent deaths are highest in infancy, dropping to very low levels in the middle childhood years and rising again in late adolescence. There has been a general trend towards a lower proportion of deaths being registered as assault and a higher proportion as undetermined intent in all three age groups, suggesting there may have been some diagnostic shift over the past 30 years. Nevertheless, the overall rates of assault plus deaths of undetermined intent have fallen in both infancy and childhood. The true rate of violent deaths is likely to lie between the rates for assault only and those for assault, unknown and undetermined intent combined.
The rates for recorded homicide are generally higher than those for registered deaths from assault, but less than those for assault, unknown and undetermined intent combined. A number of factors may lie behind these discrepancies. Police recorded homicides include all those which the police are investigating as homicides, whereas the Registrar General's statistics relate to final recorded cause of death. The Registrar General's statistics relate to the registered cause of death, and are recorded by the year in which the deceased died; the Home Office statistics relate to recorded criminal offences and relate to the year in which the offence was first recorded. Finally, the age bands used by the Registrar General and the Home Office are not the same. Thus the two are not directly comparable but provide complementary estimates of the numbers and rates of violent child deaths.
Based on the absolute numbers of deaths from assault and from assault plus undetermined intent over the 5 years from 2004 to 2008, we estimate that the annual numbers of violent childhood deaths in England and Wales lie between 5 and 15 infants, 15 and 45 children aged 1–14 years and 32 and 117 adolescents aged 15–19 years. It is our view that the true numbers are likely to be at the higher end of these ranges, which are more in keeping (at least for the infants and children) with the numbers of police recorded homicides.
While every effort has been made to ensure the robustness of these data by going back to the original source, there are limitations to this analysis which should be borne in mind. Publicly available data from the ONS do not give a full breakdown of cause by age. We have chosen for simplicity and in consideration of the relatively small numbers within each group, to restrict our analysis to three broad age groups; this may hide different patterns, for example, between preschool and school age children. The small numbers inevitably mean that year-on-year variations could result in substantial changes to rates.
In the past 3 years, absolute numbers of child deaths (0–19 years) from assault have varied from 48 to 58, with a large proportion of these now being deaths in the adolescent age group. We would argue that these figures represent a minimum estimate of the numbers of children dying violent deaths. Violent child deaths do not conform to one particular pattern but include both deliberate and unintentional assaults as well as the broader scope of fatal child maltreatment.15,–,17 As with other studies there is likely to be some underascertainment arising from death registration data.18,–,20
In infancy, the biggest influence on death rates outside the perinatal period has been the dramatic drop in rates of SIDS in the early 1990s associated with ‘Reduce the Risk’ campaigns.21 Prior to this fall, it was postulated that a substantial proportion of sudden unexpected deaths in infancy might be covert homicides.22 While it is possible that some of the fall in violent infant deaths is accounted for by reclassification into unknown causes, this seems an unlikely scenario given that both have dropped substantially over the same time period. Given the difficulties in identifying asphyxia postmortem, it is inevitable that some infant homicides will be classified as unknown causes or undetermined intent, while others may be hidden within other external causes, but the overall numbers are likely to be small.23,–,25 Rates of deaths from assault and of recorded homicide in the middle childhood years are much lower than those in infancy, but have nevertheless fallen steadily over the 30-year period. There is no suggestion from our data that reclassification would account for the observed fall in rates. In contrast, adolescent deaths registered as assault fell in the 1970s and 1980s, but have remained static or risen marginally since then. Combining these deaths with those registered as undetermined intent, there is a steady rise over this period in rates for young men, while rates for young women have remained steady. Deaths registered as unknown causes are rare in adolescents. For all three categories of death, rates in young men are higher than those in young women.
It is interesting that the largest reductions in violent deaths observed are in infancy, with smaller reductions in the middle childhood years, and no change in adolescence. This may partly reflect the different nature of violent deaths in these age groups. In infancy and early childhood, violent deaths primarily occur in the context of the family, with parents the usual perpetrators. As children grow, the risks from those outside the immediate family increase, and in adolescence, it is likely that most violent deaths are perpetrated by extra-familial assailants. This may suggest that policies around protecting children from abuse and neglect within the family are having some effect, while those aimed at protecting older youths from violence have so far been unsuccessful.
Conclusion
Over the past 30 years there have been substantial reductions in deaths from assault in infants and children in England and Wales. These reductions are unlikely to be accounted for by changes in categorisation, but appear to reflect real improvements in protecting children from severe abuse. However, there is no cause for complacency while at least one child or young person per week dies as a result of assault. Within this context, it is important that professionals, policy makers and the public continue to learn lessons from violent child deaths and to recognise that we all carry a responsibility to ensure children's safety.
Acknowledgments
The authors are extremely grateful to Professor Ruth Gilbert and to Dave Marshall for their helpful comments on an earlier draft of the paper.
References
Footnotes
-
Funding This study was supported by an undergraduate research student scholarship from the University of Warwick and by a research grant from the British Association for the Study and Prevention of Child Abuse and Neglect (BASPCAN). Neither the University of Warwick nor BASPCAN had any role in carrying out this research or in the interpretation of the findings or decision to publish. PS and JH are employed by the University of Warwick. BA was a medical student at the University of Warwick at the time the work was carried out.
-
Competing interests PS has received grant money for related work on fatal child maltreatment. He provides expert advice to courts in child protection cases. He does not stand to gain financially from the publication of this paper and has no other competing interests. BA and JH do not have any competing interests.
-
Provenance and peer review Not commissioned; externally peer reviewed.