Article Text

Abstract
Aims: To obtain normative data on bone mineral density and body composition measured with dual energy x ray absorptiometry (DXA) from early childhood to young adulthood.
Methods: Cross sectional results from 444 healthy white volunteers (4–20 years) in the Netherlands were combined with the results from 198 children who agreed to participate in the follow up study approximately four years later. DXA (Lunar, DPXL) of lumbar spine and total body was performed to assess bone density and body composition.
Results: Bone density and lean body mass (LBM) increased with age. Maximal increase in bone density and LBM occurred around the age of 13 years in girls and approximately two years later in boys. Bone density of total body and lumbar spine showed an ongoing slight increase in the third decade. Mean fat percentage in boys remained at 10.5% throughout childhood, but increased in girls.
Conclusions: Most of the skeletal mass in lumbar spine and total body is reached before the end of the second decade, with a slight increase thereafter. This study provides reference values for bone density and body composition measured with DXA for children and young adults.
- bone density
- body composition
- x ray absorptiometry
- BMC, bone mineral content
- BMD, bone mineral density
- BMAD, bone mineral apparent density
- DXA, dual energy x ray absorptiometry
- LBM, lean body mass
- LS, lumbar spine
- TB, total body
- % fat, percentage body fat
Statistics from Altmetric.com
- BMC, bone mineral content
- BMD, bone mineral density
- BMAD, bone mineral apparent density
- DXA, dual energy x ray absorptiometry
- LBM, lean body mass
- LS, lumbar spine
- TB, total body
- % fat, percentage body fat
Osteoporosis is a worldwide problem causing high morbidity and high costs.1 Reduced bone mass, instability, elasticity of the bone, and muscle strength play a role in fracture risk. It has been shown that for each standard deviation decrease in bone mineral density (BMD) fracture risk doubled to tripled in postmenopausal women.2,3 Recently, Goulding and colleagues4 reported similar fracture risk increments in young girls.
Bone mass in later life depends largely on the peak bone mass achieved in young adulthood, and the subsequent bone loss. Thus, other influencing factors being equal, a high peak bone mass provides a larger reserve later in life.5,6 Peak bone mass is generally defined as the highest level of bone mass achieved as a result of normal growth. Paediatricians should play an important role in the early recognition and treatment of impaired bone mass acquisition in childhood, therefore good reference data for bone mineral density are required.
We have previously conducted a cross sectional study of 500 healthy Dutch children, 4–20 years of age, to gain reference values for bone density and body composition.7,8 No conclusions could be drawn from this initial study with respect to the age at which peak bone mass occurs. The objectives of the follow up study were: (1) to extend our reference values for bone mineral density and body composition in children and young adults in the Rotterdam region; and (2) to determine the age at which peak bone mass is reached.
SUBJECTS AND METHODS
Subjects
In 1994–95 a study was performed to obtain normative values for bone density and body composition measured by dual energy x ray absorptiometry (DXA). In this study 444 white European children participated (188 boys and 256 girls), aged between 4 and 20 years. The cross sectional results of this first study have been presented previously.7,8
The follow up study was performed in 1998–99. We recruited 198 children and young adults (84 boys and 114 girls; aged 7.4–25.3 years) from the Rotterdam region in the Netherlands. All subjects had participated in our previous study to assess normative values. The mean duration of follow up was 4.3 years (range 3.2–6.9 years). The results of the first and second study were combined to gain new reference data for white children and young adults.
The study protocol was approved by the ethics committee of the University Hospital Rotterdam. Written informed consent was obtained from the parents and from patients older than 12 years of age.
Methods
Bone mineral density (BMD, g/cm2) was determined by DXA (Lunar, DPXL/PED, Winconsin, USA) of lumbar spine(LS) and total body(TB). For children with weight below 30 kilograms, paediatric software was used. To account for differences in bone size we calculated apparent BMD (BMAD) of lumbar spine with the model BMADLS = BMDLS × [4/(π × width)]. Width is the mean width of the second to fourth lumbar vertebral body. This model was validated by in vivo volumetric data obtained from magnetic resonance imaging of lumbar vertebrae.9 The coefficient of variation (CV) has been reported to be 1.04% for lumbar spine BMD and 0.64% for total body BMD.10 Total body DXA also measures bone mineral content (BMC, grams), lean body mass (LBM), and percentage body fat (% fat). The CVs for the paediatric weight range have been reported as 1.0% for LBM, 4.1% for fat mass, and 1.8% for BMC,11 and for the adult weight 1.05% for LBM, 2.2% for fat mass, and 0.64% for BMC.10 As validated previously, pubertal development according to Tanner was evaluated by self assessment.12,13
Statistical analysis
We used an established non-linear model to describe age related changes in BMD or body composition.14 For BMD, BMAD, BMC, and lean body mass, further referred to as parameters, the expression is the sum of two logistic functions. The first part was assigned to the slower long term component of growth and the second of the expression to the accelerated growth during puberty.  G1 = the asymptotic value of the parameter associated with growth
G2 = a factor influencing the parameter at age 0; it affects the overall shape of the growth curve
G3 = a rate constant; it is the primary determinant of the shape of the growth curve
P1 = the asymptotic value of the parameter associated with puberty
P2 = a rate constant for the increase in the parameter as a result of puberty
P3 = the age at which the rate of change in the parameter as a result of puberty is at a maximum.
For BMD, BMAD, BMC, and lean body mass the values of G1–3 and P1–3 were determined separately for males and females using non-linear least square regression analysis. The fitting procedure was an iterative process. Initial estimates were provided by visual inspection of the data. Percentage body fat (% fat) had a skewed distribution in boys and girls and did not show the same curve as the other parameters. Logarithmic transformation of the data was necessary, while we fitted the curve allowing fractional polynomials.15
For all outcomes we examined whether the variance was dependent on age by modelling the absolute residuals,16 again allowing fractional polynomials. Two sample t tests were used to compare two independent groups. The limit of significance was set at p < 0.05.
RESULTS
Table 1 shows the reference data for BMD and BMAD in boys and girls. An age dependent increase in bone density was found in boys and girls. BMD and BMAD peak at the end of adolescence, with an slight increase thereafter. This is also illustrated in fig 1.
Mean bone mineral apparent density (BMADLS), bone mineral density of lumbar spine (BMDLS), and bone mineral density of total body (BMDTB) with standard deviations (SD) in boys and girls
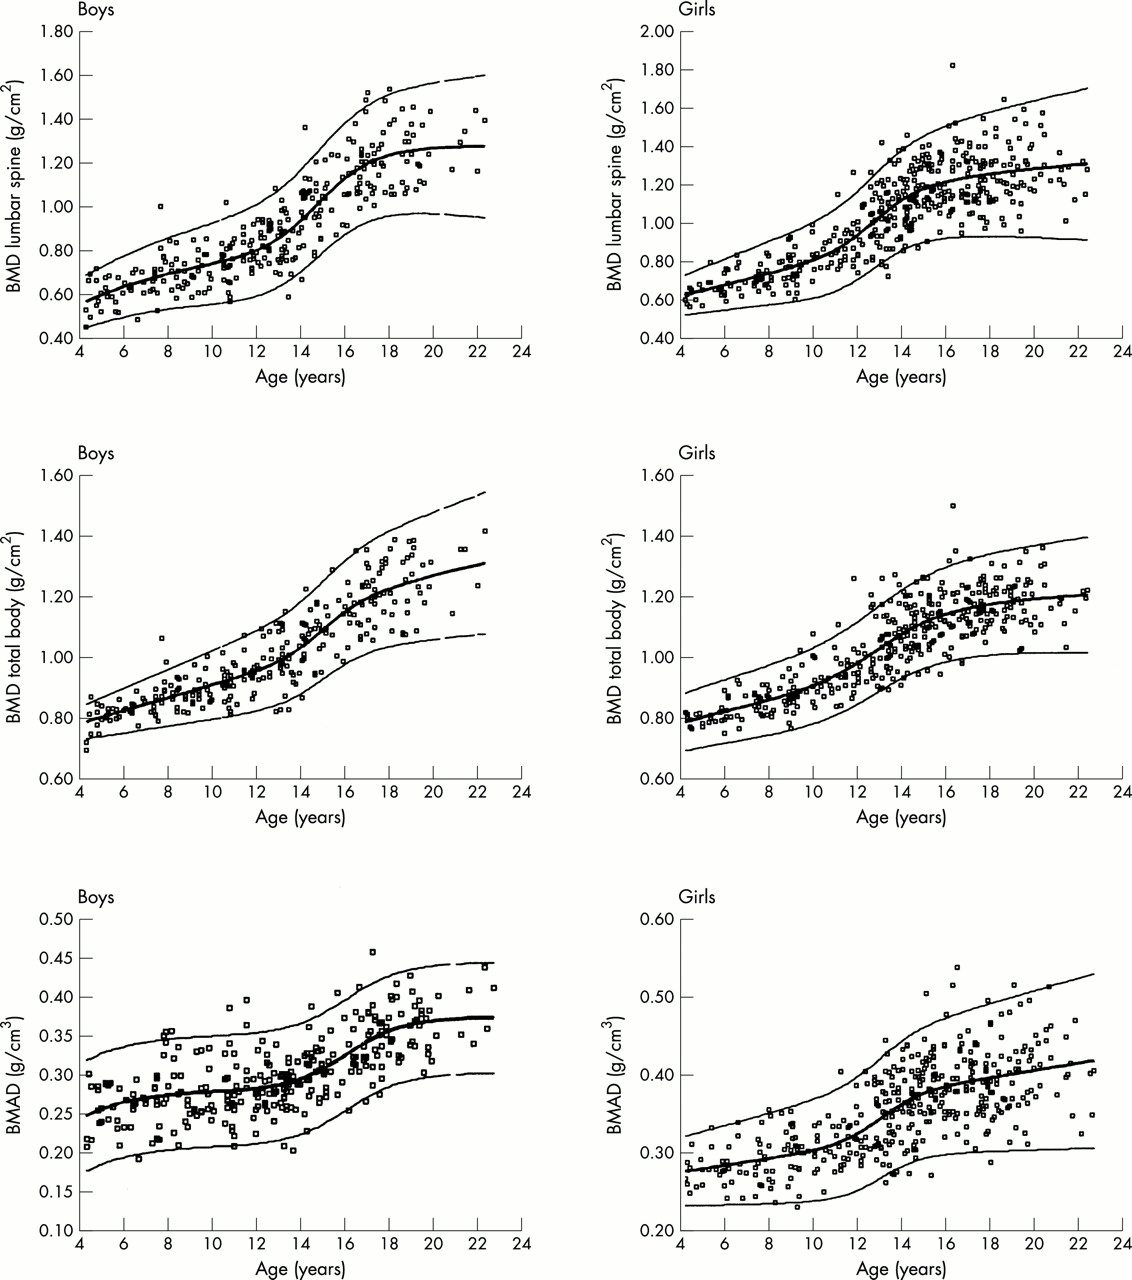
Bone mineral density (BMD) of lumbar spine and total body and bone mineral apparent density (BMAD) of lumbar spine plotted by age in boys and girls. The bold line represents the fitted line, the thin lines represent ±2 SD.
Table 2 and fig 2 present reference data for body composition. Percentage body fat remained at 10.5% during childhood in boys and increased with age in girls, from 15% in those aged 4–4.9 years to almost 25% in those aged 22–22.9 years. An age dependent increase in lean body mass was found in both sexes. However, boys had higher LBM compared to girls; the maximum rate of change in LBM was 11.5 years in girls and 14.2 years in boys.
Mean lean body mass values (LBM), bone mineral content of total body (BMCTB), and percentage body fat (% fat), with standard deviations (SD) in boys and girls.

Bone mineral content (BMC), lean body mass (LBM), and percentage body fat (% fat) plotted by age in boys and girls. The bold line represents the fitted line, the thin lines represent ±2 SD.
Table 3 shows the increases in bone density per Tanner stage. In the logistic function parameter, P3 represents the age at which the rate of change in the parameter owing to puberty is at a maximum. Table 4 shows these ages. Maximal increase in BMD and BMAD occurred around the age of 13 years in girls and approximately two years later in boys.
Bone mineral content (BMC), bone mineral density (BMD), and bone mineral apparent density (BMAD) per Tanner stage in white children
Mean age (SEM) at which the rate of change in bone density or body composition due to puberty is at a maximum
DISCUSSION
The present study provides reference values for bone mineral density and body composition measured with DXA for white children and young adults. The mean and standard deviation are given for boys and girls from 4 to 23 years of age, with age categories of one year, which enables calculation of age and sex matched standard deviation scores. Besides correction for age and gender, results should be adjusted for height, pubertal stage, or bone age, especially in children with delayed or advanced skeletal maturation or growth disorders.
BMD, measured by DXA, is an areal density that varies with bone size. Given a fixed volumetric density, large vertebrae have greater BMD values than small vertebrae.17 On the other hand, BMD will be underestimated in children with short stature. In order to correct for bone size or height, mathematical models are frequently used to calculate BMAD (“volumetric BMD”). A direct measurement of volumetric BMD is possible with quantitative computed tomography (QCT), but this technique involves high radiation exposure. However, our results showed no substantial increase in BMAD until puberty, similar to what has been reported using QCT.18 Together with various clinical studies,19,20 this finding underscores the utility of BMAD as an appropriate correction for bone size or height.
With regard to our study population some characteristics should be noted. Mean height, BMD, and BMI SD scores at baseline from the volunteers, who were willing to participate in the follow up study, did not differ from the means of the total group at baseline, indicating that we studied a random sample of the baseline population. Interestingly, we found the bone density values expressed as SDS using our old reference data, to be somewhat higher at follow up than at baseline. A similar increase was found in a longitudinal study to assess normative data for ultrasound measurements in another group of white children in Rotterdam.21 We cannot really explain this finding, which might present a “secular trend” found in longitudinal data. We found no evidence for a healthy responder bias, as we studied a random sample; no increase in calcium intake or in physical activities was found between baseline and follow up measurements.
The increase in BMD and BMAD with age is similar to what has been found in other studies.22–26 The main increase occurs during puberty, when concentrations of growth hormone as well as sex steroids increase; both are known to positively influence bone mineralisation.27,28 Maximal increase in BMD and BMAD occurred around the age of 13 years in girls and approximately two years later in boys. Besides an increase of BMD with age, an increase in lumbar spine BMAD was also found, suggesting that the increase in lumbar spine BMD does reflect a real increase in mineralisation, and is not merely a result of accelerated growth.
Although all bone density parameters showed a clear flattening off after puberty, no accurate conclusion could be drawn using our statistical model as to whether peak bone mass has been reached. In this model G1 and P1 represent the asymptotic value of the parameters associated with growth and puberty, respectively. Addition of G1 to P1 would provide the value of peak bone mass. However, an ongoing increase is found in some of the parameters, partly because of the small numbers of volunteers in the older age categories. Nevertheless, our results suggest that most of the skeletal mass in lumbar spine and total body is reached before the end of the second decade.
Most cross sectional studies reported that peak bone mass is reached at late adolescence,24,29,30 while others found that lumbar spine BMD increased till the mid 30s.31 Longitudinal studies in girls show that peak bone mass is reached around the age of 30.32,33 Matkovic and colleagues29 described bone mass acquisition at various skeletal sites in females. BMD in proximal femur and vertebral body reached their peak in late adolescence. However, a slight gain in bone mass of radius, total body, and skull was found with a peak in the late 40s. This suggests a slow but ongoing bone accumulation at some skeletal sites.
DXA provides precise body composition analysis with a low radiation dose.34 DXA measurements performed in adults and children are able to detect small changes in body composition and were highly correlated with bioelectrical impedance analysis, skinfold thickness measurements, and underwater weighing.8,35,36 In the present study, mean % fat remained stable (10.5%) in boys and increased in girls with age. Percentage fat showed a wide variance in both sexes. LBM or fat free mass consists mainly of muscles. A steep increase was found during puberty, especially in boys, caused by increased growth hormone and androgen secretion.
DXA devices from different manufacturers might not give identical results, because of differences in calibration and bone edge detection algorithms.37 Therefore, to calculate reliable SD scores one should use at least reference data gained with an identical DXA device. Of course, locally gained reference data are preferred.
Knowledge of normal physiological variation of bone density and body composition is needed to identify pathological changes. This study provides reference values for bone density and body composition measured by DXA for children and young adults. Age and sex adjusted Z scores should be calculated using ethnic specific data where possible. Most of the skeletal mass in lumbar spine and total body is accumulated before the end of the second decade, with a small ongoing increase thereafter.
REFERENCES
COMMENTARY
The introduction of densitometric techniques for measurement of bone mineral content (BMC) and density (BMD) have lead to an improved understanding of bone development during childhood and adolescence and better assessment of childhood conditions associated with increased fracture risk. Dual energy x ray absorptiometry (DXA) is the most readily available and the most commonly used technique for measurement of BMC and BMD in children. Major advantages of this technique include its short scan time, very low radiation dose, excellent precision, and the ability to assess BMC and BMD at both axial and appendicular skeletal sites. It is also an invaluable tool for the assessment of lean body mass (LBM) and fat body mass (FBM). DXA provides the measurements of the total amount of BMC (gm) contained with the scanned skeletal site and its two dimensional projected bone area (BA; cm2). It does not measure the thickness and therefore the volume (cm3) that is needed for estimation of volumetric bone mineral density (vBMD; gm/cm3). The vBMD can be measured using quantitative computer tomography techniques. The ratio of BMC and BA, expressed in units of gm/cm2, is referred to as the “areal bone mineral density” (aBMD). The aBMD is a function of bone size and its vBMD. Thus, an increase in a child’s aBMD might reflect an increase in size or vBMD of the bone or a mixture of both these factors. Therefore, interpretation of aBMD poses major challenges in healthy children due to age and puberty related changes in bone size and in those with chronic diseases whose poor growth and delayed puberty adversely affects bone size. A number of approaches have been proposed for reducing the influence of changes in bone size that accompany skeletal growth on DXA measured bone variables. One approach involves calculation of the bone mineral apparent density (BMAD) by dividing BMC at a bone site by the three-dimensional bone volume derived from its two dimensional projected BA.1,2 The BMAD of the lumbar spine (LS) is estimated by modelling it as a cube1 (BMADLS= BMCLS/BALS1.5 ) or as a cylinder2 (BMADLS= BMCLS × [4/(π × bone width of LS)]). Another approach involves adjustment of BMC for projected BA, body height, weight (or LBM), and Tanner stages of sexual development, using a regression model as recommended by Prentice et al3 and Warner et al.4 Mølgaard et al5 have proposed a three step approach to evaluation of whole body BMC in children, which seek to determine the following: (1) Is the child’s height appropriate for age? (“short bones”); (2) Is the bone size (bone area) appropriate for height? (“narrow bones”); (3) Is the BMC appropriate for bone area? (“light bones”). This evaluation is undertaken by reference to local gender and ethnic specific reference data for these parameters. This pragmatic approach allows the clinician to separately determine if the child’s skeletal fragility is due to reduction in the size of the bones or the amount of BMC within the periosteal envelopes, or both these factors.
Leonard et al5 have shown the use of different published paediatric DXA reference databases for assessment of aBMD in children with chronic diseases leads to significant inconsistencies in the diagnosis of osteopaenia, arbitrarily defined as aBMD standard deviation (SD) score <2. Many of the databases are not ethnic or gender specific and are based on a small number of subjects and thus may not accurately reflect normal aBMD variation in each age and pubertal category. Furthermore, the use of gender non-specific aBMD databases resulted in a significantly greater percentage of boys being misclassified as osteopaenic.6 These investigators also showed that the use of different versions of analysis software (standard or low density) provided by DXA manufactures resulted in significantly different values for LS BMC, BA, and aBMD in children.7 Thus, comparisons to sufficiently large, gender, ethnic, densitometer, and software specific paediatric reference databases is crucially important when interpreting DXA data in children and adolescents. van der Sluis et al have provided such a database for healthy four to 25 year old Dutch Caucasian children and young adults. This is one of the largest gender specific databases derived from a combination of cross-sectional and longitudinal measurements made in 642 subjects (275 males and 370 females) using the Lunar (DPL-X) DXA densitometer. The authors have provided mean and SD data for the whole body and LS aBMD, BMADLS, LBM, and FBM, stratified according to chronological age and Tanner stage of sexual development. Like other investigators ,8 van der Sluis et al have shown that a large increase in the whole body and BMC occurs over a relatively brief period during puberty, with maximal bone acquisition occurring around the age of 13 years in girls and 15 years in boys. Finally, they showed that peak bone mass (PBM), defined as the maximum amount of LS BMC accumulated at the end of the skeletal maturation, was virtually achieved by the end of the second decade. Taken together, these data add to the increasing body of evidence that childhood and adolescence are crucially important periods for the achievement of adequate PBM, which is generally accepted as one of the major determinants of an individual’s risk of developing osteoporotic fractures in old age. The fact that childhood offers a window of opportunity of reducing the risk of osteoporosis in latter life through building a healthy skeleton was recognised by the late Professor Charles Dent of University College, London, who 30 years ago stated, “Senile osteoporosis is a paediatric disease”.