Article Text

Abstract
Mid-parental heights are widely used to help assess an individual child’s growth. However, the methods in use vary, and most make no allowance for extremes of parental height. This study aimed to examine the actual distribution of parental heights in a survey population and the relation with their children’s heights. The heights of 419 representatively sampled children aged 8–9 years were compared with their reported mid-parental heights, all expressed as standard deviation scores (SDS). These confirmed previous predictions that 90% of the children’s heights would fall within 1.5 SDS (approximately two centile spaces) of their mid-parental heights. However, where parents were unusually tall or short, their children were relatively less tall or short, respectively, and the mid-parental height was a poor predictor of attained height. A simple calculator for expected height centile is described that automatically adjusts for this regression to the mean. Of 13 children below the second centile for height, eight were within two centile spaces (90% range) of their mid-parental height SDS. However, when allowance was made for regression to the mean, only three of 13 were within the 90% range. Although mid-parental height provides a useful guide to expected height centile for children and parents of average stature, it can be misleading when used to assess short children.
- growth
- mid-parental height
- short stature
Statistics from Altmetric.com
The calculation of mid-parental height has been a standard procedure for assessing individual children since it was first described by Tanner.1 The mid-parental height, which is the average of both parents’ heights, plotted on the height centile chart at age 18 years after adjustment for sex, can be used as a crude prediction of that child’s future adult height; the mid-parental height expressed as a centile or standard deviation score (SDS) is commonly used to assess whether a child’s current height centile is consistent with genetic expectations. Tanner1 initially suggested that a child’s adult height would be expected to fall within 8.5 cm of the mid-parental height. However, current charts2 3 now suggest a range of 10 cm, just over two centile spaces. However they do not specify what proportion of the population this range should include, or the source of these estimates. Similarly Tanner’s original paper suggested that the sex adjustment should be made by adding or subtracting 13 cm to/from one parent’s height and plotting both on one chart, with the midpoint constituting the mid-parental height.1 More recent charts specify that the two heights should be averaged and 7 cm added or subtracted, before plotting.2 Again, the basis for either a 13 or 14 cm sex height difference is not stated.
As for most polygenic characteristics, very short or tall parents tend to produce less extreme offspring—the phenomenon of regression to the mean. Although this is a long recognised concept in biology4 and statistics,5 paediatricians are less familiar with the concept and rarely apply it clinically, even though it is referred to in the Tanner-Buckler longitudinal charts.3
We measured attained height in a representative population of children in Newcastle upon Tyne, UK and compared this with their reported mid-parental stature to explore the validity and limitations of mid-parental height, particularly when assessing short stature in childhood.
Methods
A complete birth cohort of 3418 full term children aged 18–30 months was identified from the child health computer system in 1989 and routine clinic weights retrieved.6 Five years later, when the children were aged 8–9 years, as part of a continuing study of weight gain in infancy, a 20% systematic sample was taken of the 2812 (82%) children for whom at least three weights had been retrieved. These children showed no difference in mean birth or subsequent weight to those children in whom less than three weights were retrieved. The children in this 20% sample were traced and a letter and consent form was sent to the family, which included a request for both parents’ heights.
Children were then measured in school by a research nurse over an eight month period. A subset of children participated in a parallel study involving home visits, and in these families mothers were also measured. Height was recorded to 0.1 cm using the Leicester height measurer. The mid-parental height was calculated as follows:
(father’s height + mother’s height)/2 ± 7 cm
All measurements, including the mid-parental height, were transformed into SDSs and compared with the revised UK 1990 standards.7 8
Results
Of the 562 eligible children, 448 (80%) were traced and measured at a mean age of 8.57 years (SD, 0.3; range, 7.72–9.22) and reported heights for both parents were obtained for 419 (94%) of these.
The mean (SD) paternal height was 176.3 (7.9) cm, whereas the mean (SD) maternal height was 162.2 (7.1) cm, giving a sex difference of 14.1 cm, very close to the currently recommended sex correction. The mean height of the 48 measured mothers was very similar to the remainder, where reported height was used. The spread of the distribution was slightly less in the former (mean (SD) in the measured group, 162.1 (5.6) cm; reported group, 162.2 (7.2) cm).
The children’s mean (SD) height SDS was −0.12 (1.0), the mid-parental height SDS was −0.19 (0.91) and the correlation of the two was 0.47 (p < 0.01) (fig 1). When the difference between the mid-parental and child’s height SDS was calculated, 90% of children had values within 1.5 SDS of their mid-parental height SDS, confirming that the currently used range (± 2 centile spaces) corresponds approximately to the 90% range. However, the distribution of children’s heights around the mid-parental height varied through the height distribution, the children of short or tall parents being relatively less short or tall, respectively. For example, of the 45 children with parents whose mean height was between the second and ninth centile, only one had a height SDS more than 0.67 SDS (one centile space) below the mid-parental height SDS, and their mean height SDS was 0.77 SDS higher (table 1).

Scatterplot of mid-parental height standard deviation scores (SDS) against child’s height SDS, and regression line.
Discrepancy between child and mid-parental height (MPH) by midparental centile
The relation between the children’s and their mid-parental height SDS found using linear regression was as follows:
child’s height SDS = mid-parental height SDS × 0.51 + 0.015
Using the approach described previously for comparing earlier with later weights in infancy,6 one can calculate the expected height SDS for a known mid-parental height SDS, adjusted for regression to the mean using the above regression coefficient (intercept omitted because non-significant, coefficient rounded to 0.5 for simplicity):
expected height SDS = mid-parental height SDS × 0.5
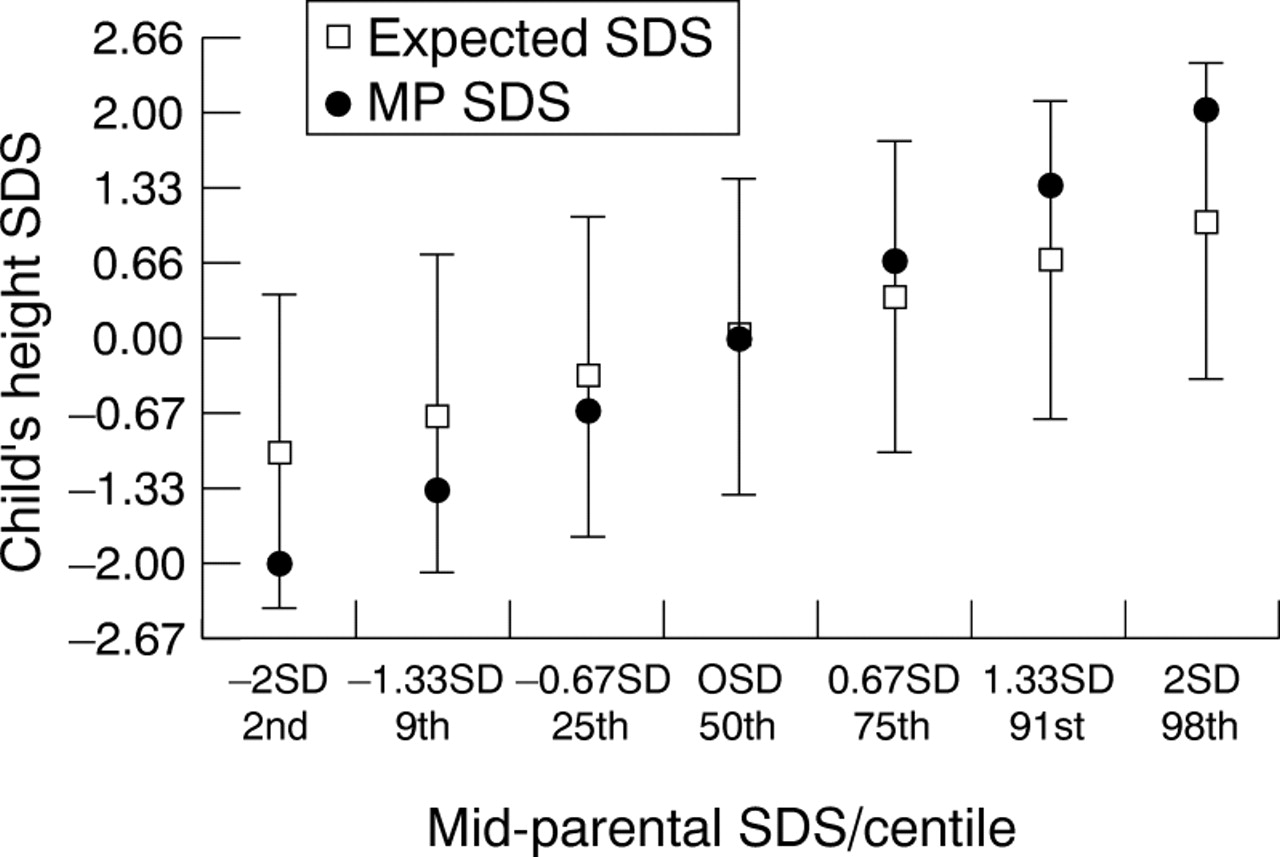
Ninety per cent of children had values within 1.4 SDS of their expected SDS (just over two centile spaces) and only 1% had values > 2 SDS (three centile spaces) below. Figure 2 illustrates the effect of applying this adjustment across the range of parental heights. For example, for children of parents with mid-parental height equal to the ninth centile, the lower limit of their 90% range would be just one centile space below the mid-parental height. We have devised a simple calculator from this regression model, which adjusts for parental height without the need for calculations or conversion of heights into SDSs (fig 3). This was constructed by taking the adult male and female normal height ranges (in cm) and scaling them so that corresponding centiles are parallel. The scale in the centre then shows the child’s expected centile, given the corresponding parental centiles, and 90% of children would be expected to stay within two centile spaces of this value. For example, the maternal and paternal 91st centiles, 1.33 SDS (172 and 187 cm, respectively) lie opposite the 75th expected height centile. This is arrived at by multiplying the mid-parental SDS by the regression coefficient described above:

Expected height standard deviation score (SDS) and 90% range, adjusted for regression to the mean, by mid-parental height centile.

Expected height centile calculator, incorporating adjustment for regression to the mean.
1.33 * 0.5 = 0.67 SDS = 75th centile
This is slightly different from our original analysis, in that the mean of the parental centiles is used, rather than the centile of the mid-parental height, but the effect is essentially the same and is closer to the method used originally by Tanner.
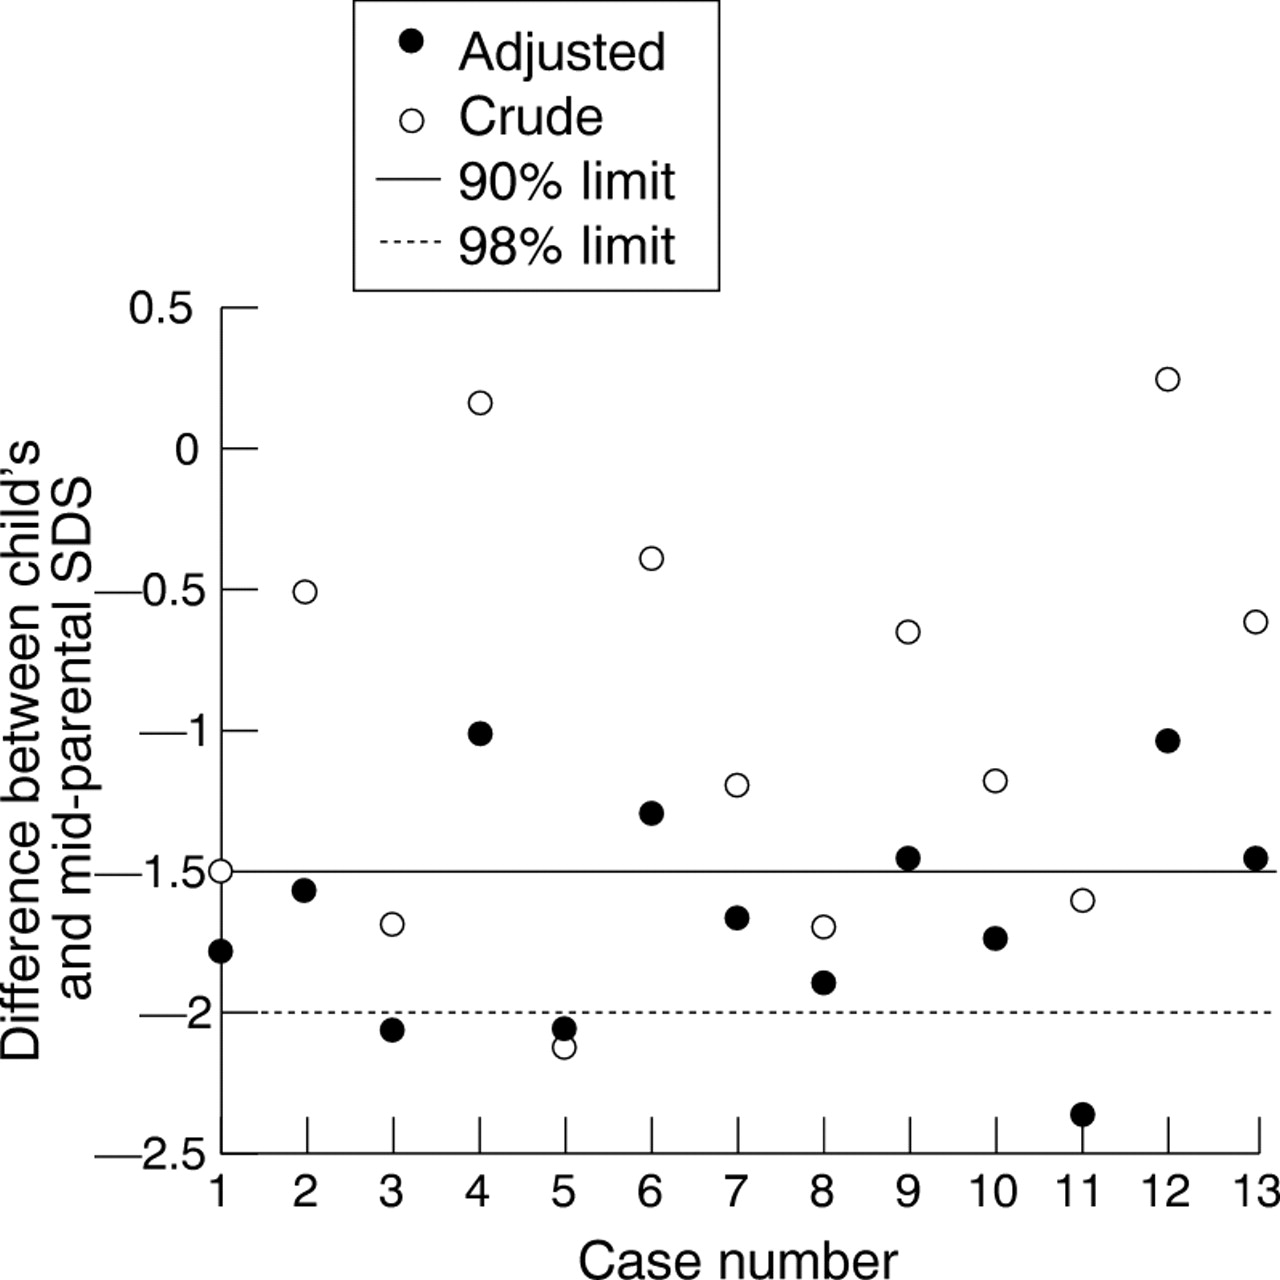
We also examined in more detail those children in the sample who were below the normal range for height. There were 16 children below the second centile for height, of whom 13 had parental heights available. One of the 13 children had a major congenital anomaly (VATER syndrome), one had severe and another mild asthma, whereas the remainder were reported to be healthy. All 13 children had mid-parental height below the 50th centile, but only three below the second centile. Using the unadjusted comparison, eight of 13 children’s heights (62%) were within two centile spaces of their parents’ heights. However, after adjustment for regression to the mean, only three of 13 (23%) were less than two centile spaces below their expected height, and therefore within the 90% limits (table 2; fig4).
Relation between child and mid-parental height (MPH) standard deviation score (SDS) in children below second centile

Children below the second height centile: effect of adjustment for regression to the mean on difference between actual height standard deviation score (SDS) and mid-parental SDS.
Discussion
We have confirmed that in our cohort, 90% of children’s height SDS values fall within 1.5 SD of their mid-parental height SDS and that the mean difference in parental heights is 14 cm. We have also shown that children’s heights are more accurately related to parental heights when the latter are adjusted for regression to the mean. This is predictable from Galton’s original description of regression to the mean, because short parents on average have less short children.4
A potential limitation of our study is that it uses reported rather than measured parental heights. It has been suggested that adults tend to overestimate their height (and underestimate their weight), although a recent British study found the average bias to be less than 1 cm.9 However, using the comparisons possible within our study, we found no evidence of bias. The spread of measurements was slightly wider in the “reported” parental height group, but the correlation observed between the reported parental and children’s heights were of a similar order to those described for studies using direct measurements,1 and the observed sex difference corresponded closely to the expected value, making a systematic sex bias unlikely. When making a clinical assessment of an individual child, exact measurements are of great importance, but all too often doctors have to rely on a least one reported parental height. We were reassured to find that the parents’ estimates were representative and showed appropriate correlations with their children’s height.
Another potential limitation is the narrow age range of the children studied. However, there are good grounds for arguing that the relations we observed will apply at least through midchildhood, because Tanner found very similar correlations from age 1 to 9 years. In adolescence, any comparison of this kind is unlikely to be valid, because of differing rates of pubertal progression.
Apart from those with major organic problems, we do not know why the children below the second centile were short. We know only that for three quarters of them parental heights alone did not offer sufficient explanation. Although most exceptionally short children will ultimately prove to have either genetic short stature or constitutional delay, they show a relatively high risk of occult medical problems,10 major social disadvantage,11 12or abuse.13 Inappropriately ascribing a child’s extreme shortness to relatively short parents could thus result in delayed investigations or failure to appreciate the seriousness of a child’s situation.
The Tanner-Buckler longitudinal charts incorporate an adjustment for extreme parental heights,3 which involves calculating the mid-parental height and then adding or subtracting 1 cm for every 5 cm that this deviates from the population mean. However, if a version of the mid-parental height calculator was included on growth charts, this could avoid unwieldy calculations and the potential for computational errors
We suggest that few paediatricians are aware of the need to allow for regression to the mean in mid-parental height calculations and that these data demonstrate that doing so might substantially alter their interpretation of a child’s growth pattern. The data also suggest that mid-parental height is most useful for assessing children with heights within the normal range. In short children, who are much more likely to present for evaluation, mid-parental height can offer reassurance in only a minority of cases, because most short children are in fact growing below their genetic expectations.
Acknowledgments
We are grateful to J Callum who collected most of the measurements with the help of S Corbett, and also to Newcastle City Health Trust, the school heads, the children and their parents. We are also grateful to Dr T Cole for his comments on this paper and his help (with the Child Growth Foundation) in developing an earlier version of the midparental height calculator. Grant support was provided by Northern and Yorkshire NHS Research and Development and the Wellcome Trust.