Article Text

Abstract
AIM To examine adolescent food consumption trends in the United States with important chronic disease implications.
METHODS Analysis of dietary intake data from four nationally representative United States Department of Agriculture surveys of individuals 11–18 years of age (n = 12 498).
RESULTS From 1965 to 1996, a considerable shift in the adolescent diet occurred. Total energy intake decreased as did the proportion of energy from total fat (39% to 32%) and saturated fat (15% to 12%). Concurrent increases occurred in the consumption of higher fat potatoes and mixed dishes (pizza, macaroni cheese). Lower fat milks replaced higher fat milks but total milk consumption decreased by 36%. This decrease was accompanied by an increase in consumption of soft drinks and non-citrus juices. An increase in high fat potato consumption led to an increase in vegetable intake but the number of servings for fruits and vegetables is still below the recommended five per day. Iron, folate, and calcium intakes continue to be below recommendations for girls.
CONCLUSIONS These trends, far greater than for US adults, may compromise health of the future US population.
- nutrition
- adolescents
- national survey
- diet
Statistics from Altmetric.com
Adolescence is a critical period during which lifetime habits are established. Many teenagers are preoccupied by their physical characteristics and appearance,1 resulting in nutritional practices such as dieting or consuming fad foods. Dieting, a commonly occurring practice among adolescent girls, may be the cause of inadequate dietary intake and may have important health effects for selected nutrients such as calcium, iron, and folate.2Some teenagers continue to exercise and become more involved in sports, while others stop and eventually begin to develop a sedentary life style.3 Many of the adolescent lifestyle habits may have severe consequences in the long run. For example, being overweight during adolescence is associated with increased risk for being overweight during adulthood4 ,5 as well as increased hypertension during adolescence,6 and more recently, with increased adult onset diabetes occurring during adolescence.7 The National Health and Nutrition Examination Surveys (NHANES) in the United States showed increasing prevalence of overweight not only in adults but also in adolescents, in particular over the last 15 years.8 ,9 Furthermore, we know from previous studies that blood pressure and cholesterol concentrations track from childhood into adulthood.10 ,11Excessive weight gain during childhood and adolescence is a determinant of adult cardiovascular risk and mortality.12 ,13Similarly, inadequate fruit and vegetable intake may affect the prevalence of selected cancers.14 This study was initiated to provide a better understanding of adolescent food habits, and to follow food trends that may have implications for the later development of adult non-communicable diseases.
Methods
SURVEY DESIGN AND SAMPLE
From the initial sample of approximately 90 000 individuals participating in four United States Department of Agriculture (USDA) surveys, adolescents aged 11 to 18 with dietary data were selected for this study. Of these 12 498 adolescents, 3061 came from the 1965 and 6208 from the 1977–78 Nationwide Food Consumption Surveys (NFCS), and 1656 came from the 1989–91 and 1573 from the 1994–96 Continuing Survey of Food Intake by Individuals (CSFII). The USDA surveys from 1965 to 1991 contain stratified area probability samples of non-institutionalised US households in the 48 coterminous states and in all 50 states in 1994–96. The 1977, 1989–91, and 1994–96 surveyors conducted four data collection waves (winter, spring, summer, autumn), each surveying a different sample, whereas the 1965 survey collected individual dietary data in a single spring sample. These surveys were self weighting, multistage, stratified area samples of the US population. For each survey, response rates differed at the level of the primary sampling unit. Thus, weights based on response rates for each sample unit are used to permit inferences applicable to the total non-institutionalised US population. Detailed information on the methodology pertaining to each survey has been published previously.15-18
DIETARY DATA
Each survey included at least one in home, interviewer administered, 24 hour dietary recall. The 1977 and 1989–91 surveys also included two self administered one day food records. Information was collected on everything individuals ate at home or away. For our purpose of studying trends in dietary intake over time, we used only the first day of dietary intake information from each survey—the one day (24 hour) dietary recall. This method avoids the biasing of intake results that may occur because of the different dietary data collection methods used and different number of days of reported intake that were collected.
Two of the challenges in trends analysis include accounting for differences in how foods are defined over time, as well as characterising the nutrient contribution of each food. Food codes changed considerably (often for the same food) and technology to measure nutrients has changed over time. The authors have developed a number of ways to link foods coded and collected in the last decade with foods all the way back to 1965. Values from the 1994 nutrient database were then applied to the three data sets prior to 1994 to provide consistently high quality estimates of nutrient values over time. In the most recent survey, the nutrient database specific to each survey year was used to calculate nutrient values in order to reflect changes in foods on the market.
This approach allows for the use of newer measures of nutrients and to consider shifts in food descriptors. True changes in the actual nutrient content of foods over time will not be captured by use of a single nutrient composition table, and trends may be either over or under stated. In weighing the advantages and disadvantages of using different nutrient composition measures, the authors concluded that using the 1994 nutrient data provides a conservative measure of some of the nutrient trends in foods (for example, fat) and allows for the examination of trends in several nutrients (for example, fibre) that would not have been possible otherwise.
The Food Guide Pyramid database released by USDA with the 1994–96 survey was used to calculate the servings of fruit, vegetables, milk, and grains as well as the ounces of lean meat equivalents for all four surveys.19 The same linking program used to apply the 1994 nutrient values back in time was used for these calculations.
FOOD GROUPING SCHEME
In order to examine changes in the quantity of foods consumed over time, we developed a University of North Carolina (UNC food grouping system) which aggregates the 4000 or so foods consumed. This is a system which separates virtually all foods in USDA's Individual Food Consumption Surveys into 74 useful descriptive and nutrient based groups. Initially major food groups were based on food groupings used by USDA, then fat and dietary fibre compositions were used to develop more refined food groupings, and nutrient thresholds were used to separate major food groups into more distinct, nutrient based food groups (available on request).
STATISTICAL ANALYSIS
Descriptive statistics were generated for each survey year using the SUDAAN version 7.51 (Research Triangle Institute, Research Triangle Park, North Carolina) software package to appropriately correct the standard errors for sample design effects and for applying survey weights. Differences in nutrient and servings of the Food Guide Pyramid means between years were then tested for significance in SAS version 6.12 (SAS Institute, Cary, North Carolina) using a Student'st test. A more stringent p value of less than 0.001 was used to denote statistical difference. Nutrient values were compared to the most recent recommendations made by the Food and Nutrition Board (recommended dietary allowances (RDA) or recommended dietary intake (RDI)) and expressed as a percentage of the recommendations specific for each age and gender grouping.20
Results
Table 1 shows sociodemographic information for the individuals in the study by survey year. Important trends of interest are the increase in mean household income, the subsequently more even distribution of percentage of poverty starting in 1977, and the increasing number of Hispanics represented in the survey, as well as the increase in body mass index for both younger and older adolescents.
Sociodemographic characteristics for adolescents (aged 11–18) with dietary data from the four USDA surveys
Energy intake decreased over the years, with the greatest drop occurring from 1965 to 1977 (table 2). The data for all four years showed typical differences in pattern of energy intake, with boys consuming higher amounts than girls (data not shown). Table 2 also shows the proportion of energy from total fat, saturated fat, carbohydrate, and protein. A steady decline in fats and protein as a proportion of total energy intake occurred in the diet over time, which was compensated by an increase in carbohydrate intake. Gender did not affect the distribution of macronutrients (data not shown). Between 1989–91 and 1994–96, fat intake increased from 80 to 83 g/day, saturated fat stayed at 30 g/day, carbohydrate increased from 270 to 311 g/day, and protein intake remained relatively unchanged (increased from 81 to 82 g/day).
Selected nutrient intakes of 11–18 year olds with one day of dietary data from the four USDA surveys
Other nutrients of interest that we examined included vitamins A and C, iron, folacin, calcium, and fibre. On average, only vitamin A and calcium concentrations decreased over time, so that in 1996 the mean percentage of the recommended intakes being met for each nutrient was 103% and 74% respectively. The other four nutrient concentrations increased over time, and all but folacin and fibre met the most recent dietary recommendations. Some slight differences by gender existed. For example, in 1996, 40% of females met the recommended dietary intakes for iron, 20% for calcium, and 17% for folate. For males, 75% met the recommendations for iron and approximately one third met the recommendations for calcium and folate.
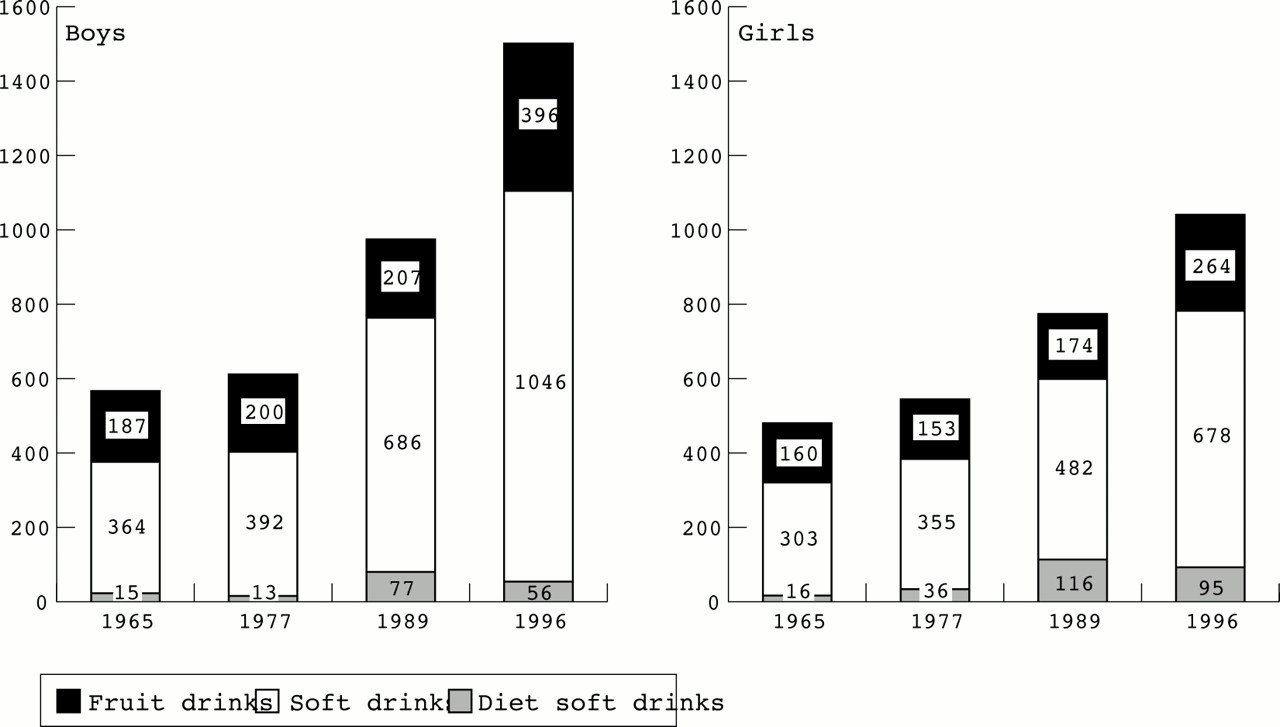
The most interesting food group consumption trends are shown in figs 1,2, 3, 4, and 5 by gender and in table 3 for the entire age group (data for other foods are available on request). The figures reflect the per capita grams of food consumed per day using the UNC food groups. The table presents actual servings of food groups or, as in the case of meat, ounces of lean meat equivalents using the UDSA Food Guide Pyramid database. The results show a decline in milk consumption that was not compensated for by an increase in other dairy products. Low fat milk was substituted for whole milk (medium fat source). Grain intake increased but primarily from high fat mixed dishes such as pizza, macaroni cheese, and certain ethnic foods. Raw fruit consumption declined steadily but juice consumption increased; this accounts for the relatively stable number of servings in table 3. Figure 4 shows a decrease in the grammes consumed of dark green and orange vegetables from 1965 to 1989 and then an increase from 1989 to 1996. Since 1965 the grammes of high fat potatoes consumed have increased. By 1996 white potatoes account for half of the vegetable consumption, whereas in 1965 it only accounted for a third (table 3). Thus the overall vegetable consumption has increased since 1965 for this population. The lean meat and egg consumption decreased over time. Finally, soft drinks consumption rose sharply.

Trends in milk consumption among US adolescents in the USDA surveys, 1965–96.

Trends in consumption of grain based mixed dishes among US adolescents in the USDA surveys, 1965–96.
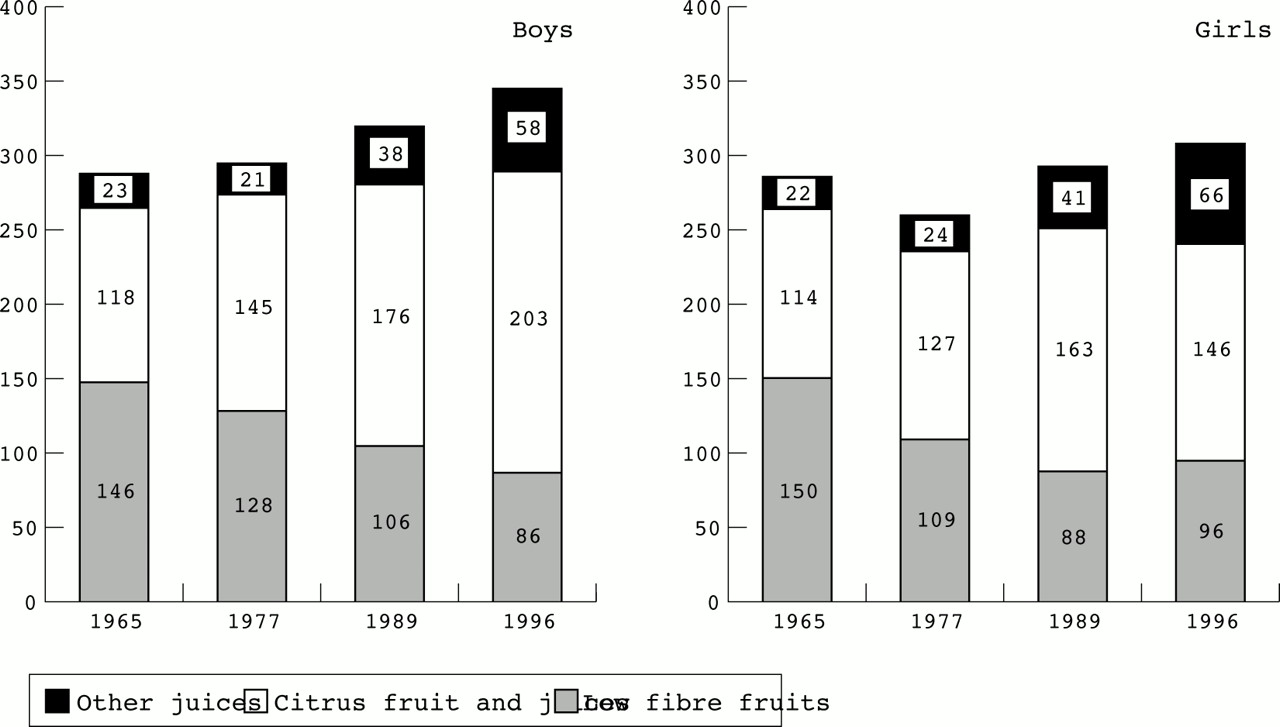
Trends in fruit consumption among US adolescents in the USDA surveys, 1965–96.
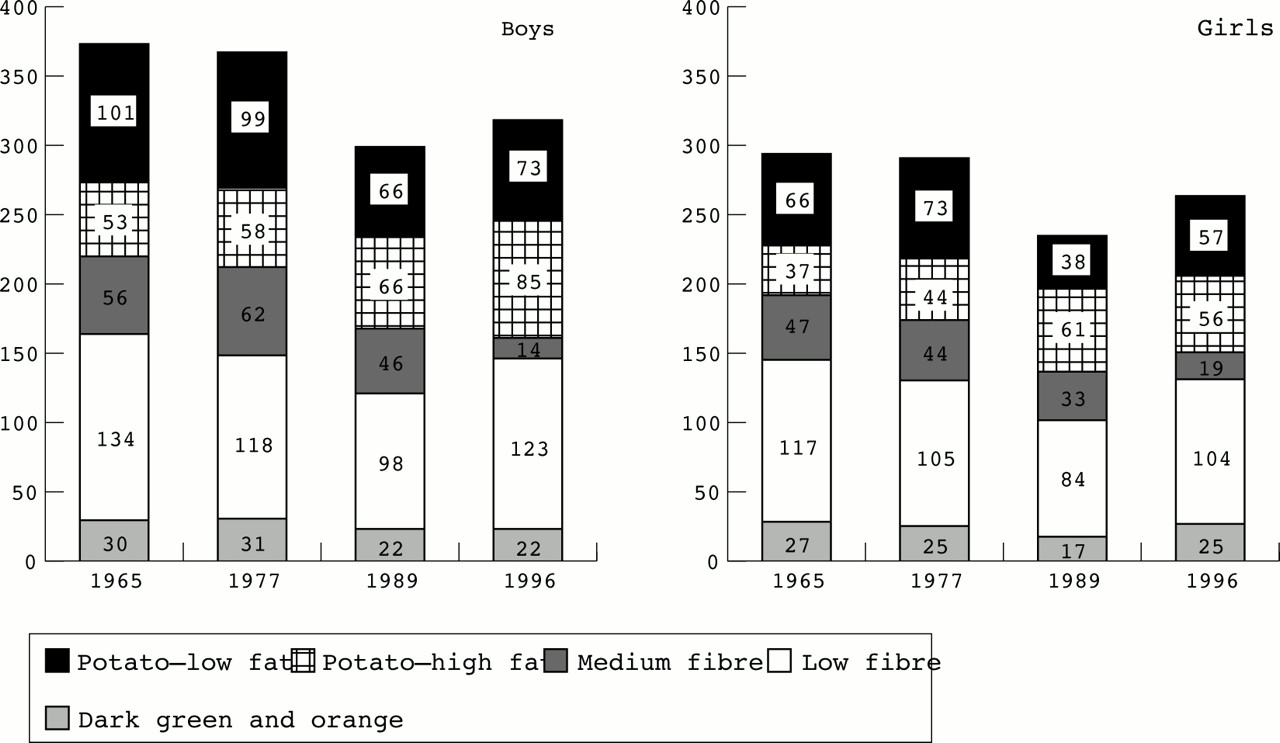
Trends in vegetable consumption among US adolescents in the USDA surveys, 1965–96.
Trends in beverage consumption among US adolescents in the USDA surveys, 1965–96.
Mean Food Guide Pyramid servings of 11–18 years olds with one day of dietary data from the four USDA surveys
Discussion
This is the first study to examine dietary trends among US adolescents which uses actual dietary intake data that are comparable from a nationally representative sample over three decades. The small sample size for non-Hispanic African-American and Hispanic subgroups forced us to focus on the total adolescent population. Our results show a decrease in total energy intake and total fat over the period studied, the latter of which is positive, but also a decrease in raw fruits, non-potato sources of vegetables, and calcium rich dairy sources. Soft drink consumption greatly increased. Many national surveys that focus on adolescents, such as the Youth Risk Behavior Surveillance System (funded by the Centers for Disease Control) and Prevention and the National Longitudinal Survey of Adolescent Health (funded by the National Institutes of Health) lack the appropriate dietary data to quantify these trends.
The amounts of total energy intake observed between 1965 and 1996 were below recommendations and decreased with time in each age and gender group. Overall there was a decline of 17% in energy over this 30 year time period. In the last period between 1989–91 and 1994–96, mean energy intake increased by 9%. Future surveys are needed to show if this is a real trend or related to the major changes in methodology between these two surveys. Both the NHANES and CSFII reported this increased intake but both changed their approaches to provide much more in depth probing for dietary intake in order to avoid some of the undercounting found in the past. The decreased energy intake seems counter intuitive in view of the rising prevalence of overweight and obesity among adolescents which has been shown by other studies.8 ,9 ,21 The most likely explanation, apart from the 1989–96 9% increase in total energy intake is a concomitant decrease in energy expenditure caused by a decrease in physical activity.3 As children age, the majority decrease their physical activity.22-24 Another explanation is differential under reporting by year of the survey, with more under reporting occurring in 1996 than in 1965. However, with each survey, the methodology for collecting the dietary information improved; in the latest survey more probing and a multipass approach were used to decrease the amount of under reporting.25 Therefore, we would suspect that more under reporting occurred in 1965 than in 1996, which would have lead to underestimating the difference in energy over time.
As with older Americans, adolescents had a higher percentage of energy still coming from fat than the present dietary guidelines recommend.26 ,27 The proportion of energy coming from carbohydrate and protein was within recommendations. In terms of the absolute intake of food, however, we found that between 1989 and 1996, total fat intake increased by 4%, saturated fat remained stable, carbohydrate intake increased by 15%, and protein by 1%. Intakes of fibre (the recommendation being more than 10 g per 4.18 MJ),28 folate, and calcium for the entire age group and iron for females were lower than optimal for proper growth and development during adolescence.
Several of these trends combined create important nutritional problems. Inadequate fibre consumption and decreasing raw fruit and non-potato vegetable consumption are major concerns. Others in the field have substantiated these findings for this age group and for younger ages.29 ,30 This population does not consume other sources of fibre such as whole grains, pasta, rice, bread, and high fibre cereals in sufficient quantities to make a difference in the total fibre intake. Thus, not only are adolescents at risk of chronic diseases because of low fibre intake but also because of low antioxidant and non-nutrient sources of plant foods, which may serve as protective factors for certain cancers.14
Another example of a potential nutritional problem is the decreased milk consumption, which has not been replaced by other rich sources of calcium but rather by soft drinks and non-citrus juices and drinks. Decreased milk consumption has occurred for both males and females but is of most concern for females, who may be at greater risk of developing osteoporosis later in life. Adolescence is the optimum period to increase bone density.2 This trend, coupled with the low dark green and orange vegetable consumption among adolescents, may be more problematic than once thought. Preliminary findings suggest that this dietary behaviour leads to increased phosphorus excretion, which subsequently may compromise bone building and maintenance.31 All age groups are susceptible to dental caries and hyperlipidaemia, two nutritional consequences of increased simple carbohydrate intake generated by increased soft drink consumption.32
Another area of concern is the low intake of dietary folate and iron for females. If these adolescents with such low intakes become pregnant, their risks of iron deficiency anaemia and having an infant with neural tube defects are increased. More nutrition intervention strategies are needed to improve the intakes of these nutrients. Recommending increased supplement use and fortification are key options.
In conclusion, these results show food consumption trends that are compromising the nutritional and health status of US adolescents and may contribute to important increases in nutrition related chronic diseases. Given our increasing understanding of the role that diet and body composition play in preventing disease and promoting a higher quality of life, these results provide a clearer basis for intervention during adolescence to instil proper dietary habits.
Acknowledgments
The Nestlé Research Center is thanked for providing financial support for this study. We thank Dr Henri Dirren for initiating the collaboration between Nestlé and UNC-CH, Dan Blanchette and Terri Carson for their programming assistance, and Frances Dancy for support in administrative matters.
References
Linked Articles
- Archives this month
- CORRECTION