Article Text

Abstract
Objective—To describe rates and trends in the incidence of non-fatal and fatal firearm assault among children (16 years old or younger) over an 11 year period in Chicago, Illinois and to identify the socioeconomic characteristics of community areas where assaults are common.
Methods—The Chicago Police Department (CPD) records from 1986 through 1996 were reviewed for children assaulted with a firearm. United States census data for 1990 for Chicago were used to calculate incidence rates; census data were also used for community area (defined by census tract) socioeconomic descriptions.
Results—The CPD recorded 11 163 pediatric firearm assaults during the study period: 10 571 non-fatal and 592 (5%) fatal. From 1986 through 1996 non-fatal assaults more than doubled, with the highest rates in 1994; fatal assaults tripled, with rates peaking in 1993–94. Significant increases in non-fatal firearm assaults occurred among black and Hispanic males and females. In 1994, compared with white males, the relative risk of non-fatal assault was 7.0 (95% confidence interval (CI) 5.3 to 9.1) for black males and 3.3 (95% CI 2.5 to 4.4) for Hispanic males; the relative risk was 1.5 (95% CI 1.1 to 2.1) for black females. A handgun was the firearm used in most assaults (88% of non-fatal and 84% of fatal).
Within community areas, the correlation between non-fatal and fatal assault incidence was strong (r=0.80, p<0.001). The proportion of families with income below the 1989 poverty level ($12 674) and the per cent black race in the community area together accounted for 70% of the variance in assault rates.
Conclusions—From 1986 to 1994 there were significant increases in both non-fatal and fatal firearm assaults, usually by handguns; thereafter, rates declined. Urban children who were victims of non-fatal firearm assault appear to come from the same population as those who suffer fatal assaults. Black and Hispanic youth living in poverty were at particular risk.
- adolescents
- assault
- firearm
- poverty
Statistics from Altmetric.com
In the United States in the early 1990s, firearm related deaths increased, especially among children and adolescents. Data from the National Center for Health Statistics show the annual firearm homicide rate for males aged 15–19 years increased more than threefold between 1985 and 1993, the largest increase of any age group.1,2 Although homicide rates began to fall between 1993 and 1994, among black males aged 15–19 years firearm homicides continue to account for approximately 60% of all deaths.3 Comparisons of industrialized countries indicate the high rate of death from firearms is a problem unique to the United States.4,5
Only a fraction of the violent interactions involving a gun result in homicide. Non-fatal shootings outnumber fatalities, and some assaults do not result in physical injury. Information about the larger problem of non-fatal firearm assaults and injuries is limited, as are accurate national estimates of firearm assaults among children.6–9 Regional and local information is lacking and is needed to plan and evaluate interventions.
We undertook this population based study to describe rates and trends in rates of non-fatal and fatal firearm assaults involving children and adolescents in Chicago over an 11 year period, from 1986 through 1996. We also analyzed the association between race, ethnicity, and community socioeconomic characteristics and the risk of being assaulted with a firearm.
Methods
Since there was no injury surveillance system available, we used police department data. The Chicago police do not specifically identify gunshot wound victims; rather, they are included as victims of “aggravated battery”. Data were obtained from the Chicago Police Department (CPD) for all cases of aggravated battery involving a firearm of children of 16 years old or younger in the city of Chicago reported from 1986 through 1996. Aggravated battery with a firearm implies physical contact involving a gun or a bullet shot from a gun, resulting in bodily harm or permanent disability or disfigurement.10 We defined these cases as non-fatal firearmassaults, and we considered them to be proxies for firearm injuries.
Data included year, type of weapon, age, sex, race, and address of the incident. The weapon was specified as either “handgun” or “other firearm”. We did not have access to the original police reports, thus unique identifiers such as name or home address were not available to us. In non-fatal assaults we had no information about the motive or the victim-perpetrator relationship.
Fatal firearm assaults were classified by the police as homicides. Homicide data included year, age, sex, race, address of the incident, motive, caliber of weapon, and relationship between the victim and the offender.
Combined assault, the sum of non-fatal and fatal firearm assaults was used for some geographic and socioeconomic analyses.
WEAPON
For victims of non-fatal assaults, the weapon was designated by the police as either a handgun or other firearm. For fatal assaults, the police report bullet caliber for all cases and firearm type for some cases. Using this information, we designated the weapon as a handgun, shotgun, rifle, or unknown. In cases where the bullet caliber was not firearm specific and the firearm type was not designated, we considered the firearm type to be unknown. We were unable to accurately designate handguns as revolvers or semiautomatic pistols because there is much overlap in the calibers of bullets fired by each. (Additional information about weapon designation is available from the authors by request.)
We used the United States 1990 census of population and housing for the City of Chicago to calculate incidence rates.11 Census reports combine ages 10 and 11, and ages 12 and 13. When calculating age specific incidence rates, we estimated half of the group of 10 and 11 year olds to be 10 years old, and the other half to be 11 years old. We used the same method for those 12 and 13 years old. Both non-fatal and fatal assault rates are reported as cases per 100 000 population of designated age.
RACE/ETHNICITY
United States census data include self reported race and ethnicity information. Race is chosen from the categories white, black, American Indian or Eskimo or Aleutian, Asian or Pacific Islander, or other; Hispanic ethnicity is reported separately. CPD race and ethnicity categories are black, white, black Hispanic, white Hispanic, Asian, American Indian or Alaskan, and unknown. To calculate assault incidence for black and white race, we used both the police and census categories of black and white. We combined the police categories of black Hispanic and white Hispanic to define the Hispanic numerators and used the census category of Hispanic to establish the Hispanic denominators for analyses involving ethnicity. Therefore, those of Hispanic ethnicity are identified by ethnicity only.
COMMUNITY AREA
For some analyses we calculated area specific assault incidence rates; Chicago has 77 community areas, which are standard groupings of census tracts.12 Poverty level was defined using the 1989 federal poverty designation for a four person household ($12 674).13 We used community area median household income and fraction of households with income below the poverty level as economic measures. To assess economic homogeneity within each community area, we compared the percentages of community area households with income below the poverty level with the proportion of census tracts in the community area with at least 50% of households below the poverty level; there was good correlation (r=0.8, p<0.001).
Each community area's average annual non-fatal and fatal assault incidence was calculated (for the 11 year period). Based on the distribution of non-fatal and fatal assault rates, community areas were grouped.
SPSS (PC+, Chicago, IL) was used for data analysis. To identify trends over time we used linear regression with the annual non-fatal and/or fatal assault rate as the dependent variable and year as the independent variable to test if the slope of the regression line deviated from zero (zero slope implies no trend over time). For some analyses we selected age, sex, and race or ethnicity specific subgroups to identify trends among these subgroups. We calculated relative risks and 95% confidence intervals using the ratio of the event in the population of interest compared to the designated reference population.14
We compared community areas grouped by non-fatal and fatal assault incidence using χ2 and one way analysis of variance.15 Correlation and multiple regression were used to compare community area assault incidence with selected demographic and economic variables.
Results
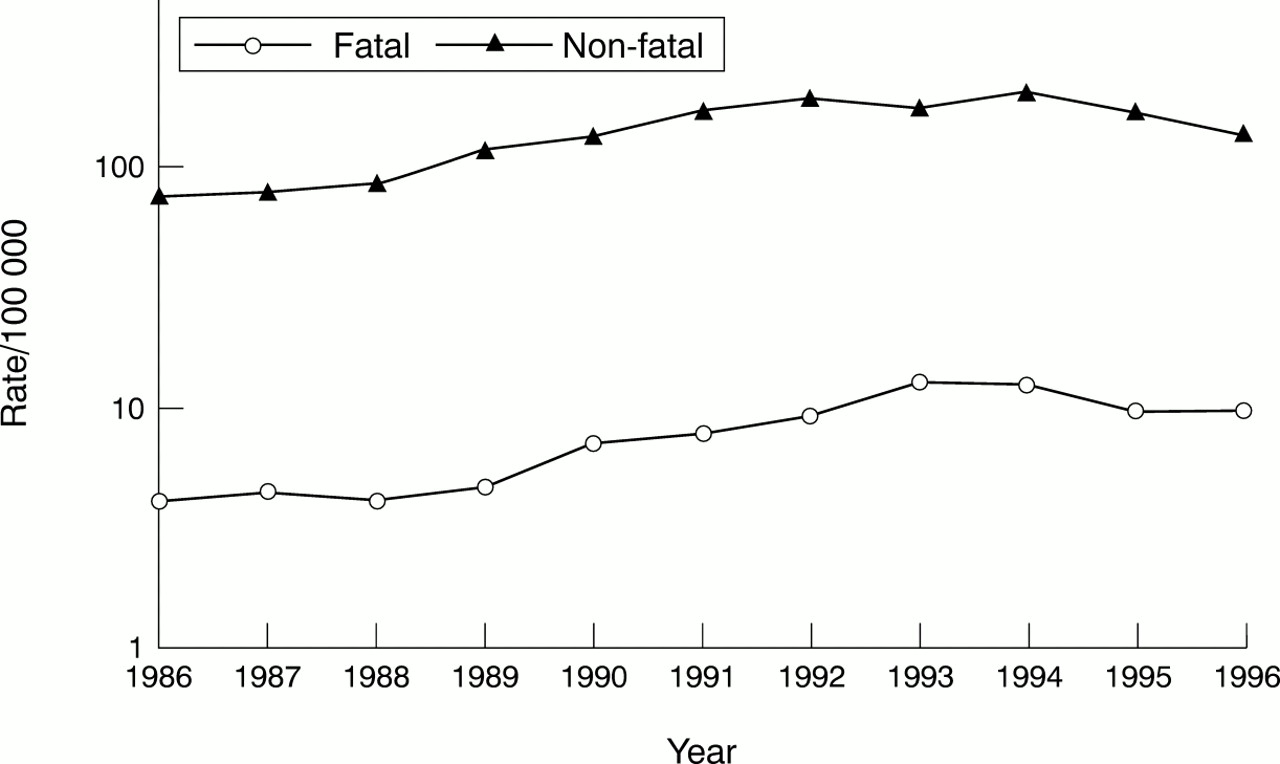
During the 11 year study period the police recorded 11 163 children aged 0–16 years who were assaulted with a firearm: 10 571 were non-fatal assaults and 592 (5%) were fatal assaults. Both non-fatal and fatal firearm assault rates were the lowest in 1986 (76.5 and 4.1/100 000 respectively). Non-fatal assaults peaked in 1994 (203/100 000) and fatal assaults in 1993 and 1994 (12.8 and 12.4/100 000, respectively; fig 1).

Non-fatal and fatal firearm assaults for children ≤16 years old, 1986–96.
The demographic characteristics of assault victims are shown in table 1. Most victims were older than 9 years old, male, and black or Hispanic.
Non-fatal and fatal firearm related assaults by age, race/ethnicity and sex, 1986–96, average annual incidence/100 000 population (n=11 163)
NON-FATAL FIREARM ASSAULTS
Figure 2 shows trends in non-fatal firearm assault rates for white, black, and Hispanic males and females. Using the regression equation with the year as the independent variable, we observed significant increases in rates from 1986–94 among black and Hispanic males, and for black, Hispanic, and white females (each, p<0.05). For the years 1994–96 we identified significant decreases among black males and females.

Non-fatal firearm assaults for children ≤16 years old by age, race/ethnicity, and sex, 1986–96.
Table 2 shows the 1986 (baseline) and 1994 (peak) non-fatal firearm assault rates by race/ethnicity and sex, and relative risks calculated using whites as the reference group. Black and Hispanic youth of both genders had significantly higher relative risks of non-fatal firearm assault than white youth. Black females outnumbered white males as victims of non-fatal firearm assault in 1994: their relative risk was 1.5 times that of white males (95% confidence interval 1.1 to 2.1).
Non-fatal firearm assaults: sex, race and ethnicity, relative risk (RR) and 95% confidence interval (CI), children ≤16 years old, 1986 and 1994
In fig 3, the standard age grouping of 10–14 year olds is stratified to show specific differences in non-fatal firearm assault rates by year of age for black males. In the early 1990s rates exceeded 100/100 000 among the 10 and 11 year olds. Rates increased significantly from 1986 to 1994 for black males at each of these ages (p<0.05). Among 15–16 year old black males, rates of non-fatal firearm assaults rose significantly from 811.9/100 000 in 1986 to 4055.4/100 000 in 1994, and then declined. In 1996 the rates were 2124.3/100 000 for 15 year olds and 2692.7/100 000 for 16 year olds.
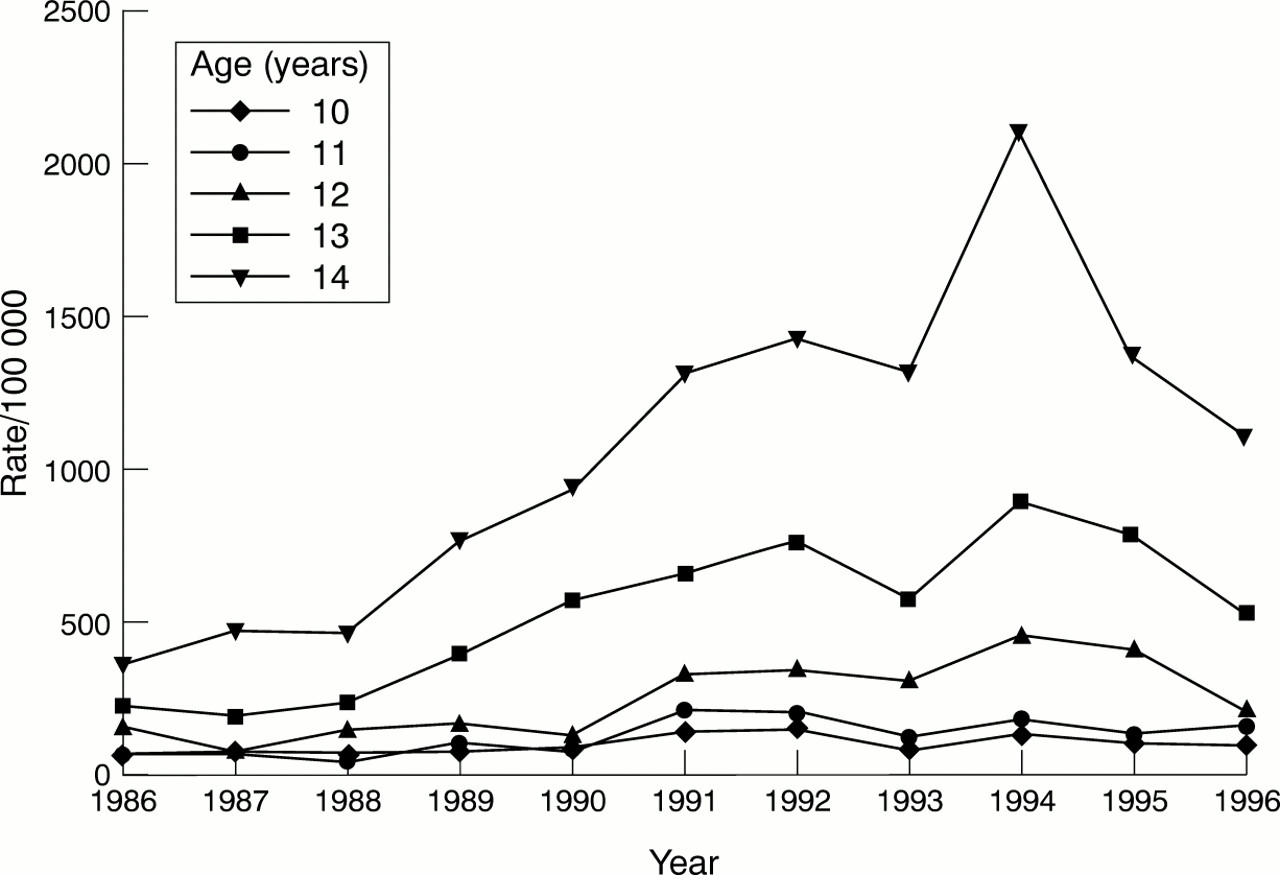
Non-fatal firearm assaults for black males by age, 1986–96.
Non-fatal firearm assault rates for 15–16 year old Hispanic males ranged from 475.7 to 1910.9/100 000, also increasing significantly from 1986–94, and declining thereafter.
Non-fatal firearm assault rates among black females increased from 1986–94 for those 12, 13, 14, 15, and 16 years old (each p<0.05); from 1994–96 rates declined. When stratified by age, neither Hispanic nor white females had a significant increase in non-fatal firearm assaults.
A handgun was the weapon designated in 88% of non-fatal firearm assaults; a shotgun or rifle was used in 12% of cases.
FATAL FIREARM ASSAULTS
Of the 592 fatal assaults during the 11 year study interval, males were killed in 511 (86%): 393 were black, 105 were Hispanic, 10 were white, and three were Asian.
Fatal firearm assault incidence among black males 10–14 years old increased significantly from 4.2/100 000 in 1986 to 33.7/100 000 in 1994, and fell thereafter. Fatal assaults among 15–16 year olds increased from 82.6 to 253.2/100 000 (p<0.001); rates declined in 1995 and in 1996. Among Hispanic males fatal assaults did not increase significantly during the years of the study. The fatal assault rate among 15–16 year old Hispanic males peaked in 1995 (118/100 000).
There were 81 (14%) female fatal firearm assault victims during the 11 year study period: 64 black, 12 Hispanic, three white, one Asian, and one of unknown race.
The incidence of fatal firearm assault among black females aged 16 years or younger increased significantly during the study period (p<0.01). The highest rates were observed in 1995: black females 15–16 years old had a fatal firearm assault rate of 38.7/100 000. There were too few non-black fatalities to identify trends.
The summary police data for fatal firearm assaults include limited information about the injury event. The police most commonly cited gang activity as the motive (53%). In 37% of cases the victim and offender were acquaintances, friends, or family. In 499 cases (84%) the firearm was a handgun.
ASSAULTS AND COMMUNITY AREAS
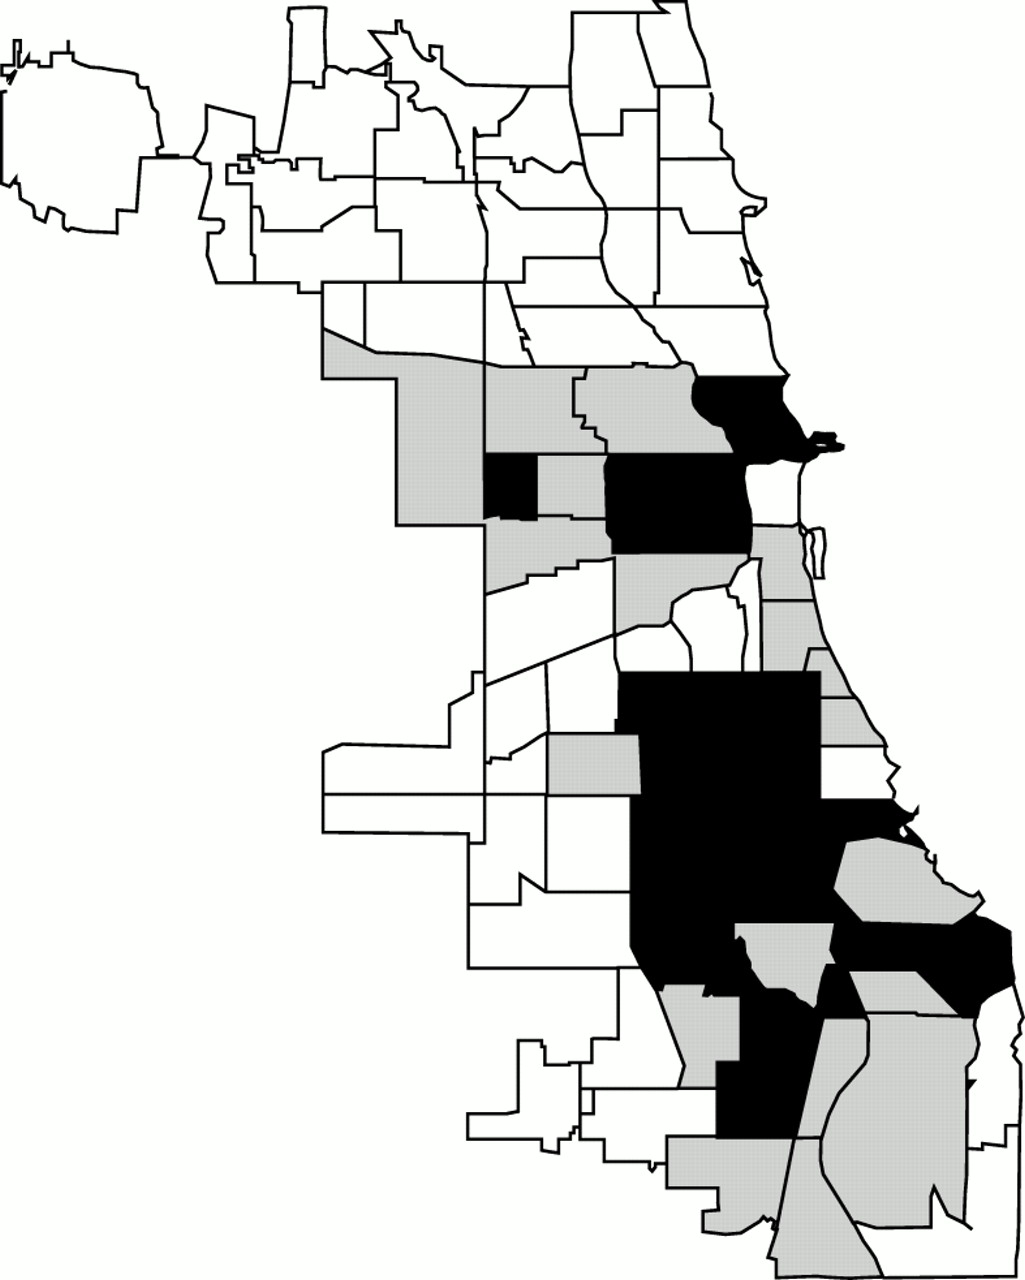
The annual incidence of combined (non-fatal plus fatal) firearm assault among children differed by community area and by year. In some community areas, there were no firearm assaults in a specific year; most community areas had their highest rates between 1992 and 1995. In 31 of the 77 community areas there was a significant increase from 1986 to 1996 (each p<0.05) and in two areas there was a significant decrease (each p<0.05). In the remaining 44 areas the annual combined assault rate did not show a significant trend during the study period. Within community areas the correlation between non-fatal and fatal firearm assault rates was strong (r=0.80, p<0.001). The map (fig 4) shows that community areas with similar combined firearm assault rates were clustered.

Combined (non-fatal + fatal) firearm assault rates: clustering of community areas, Chicago, 1986–96, children ≤16 years old. White = combined firearm assault rate below the mean (low); shaded = combined firearm assault rate within 1 SD of the mean (moderate); black = combined firearm assault rate >1 SD above the mean (high).
To estimate community specific violence exposure the 11 year average annual non-fatal assault rate in each community area was calculated for children 16 years old or younger. The demographic and economic characteristics of the community areas with low (below the mean), moderate (within 1 SD of the mean), and high (greater than 1 SD above the mean) assault rates are shown in table 3. The average median income reported for families in the low incidence community areas was significantly higher than that of the other communities; the average median income of families living in areas designated as moderate and high did not differ significantly from each other. Race/ethnicity and the prevalence of poverty also differed significantly among the low, moderate, and high incidence communities.
Characteristics of community areas by non-fatal assault incidence, children ≤16 years old, 1986–96
Characteristics of the community areas with no fatal assaults, in those with rates below the median (high), and in areas with rates above the median (extreme) are shown in table 4. The pattern is similar to that for non-fatal assaults: race/ethnicity, the prevalence of poverty, and median income were all associated with these fatal assault rate categories.
Characteristics of community areas by fatal assault incidence, children ≤16 years old, 1986–96
To determine the strength of association between the combined firearm assault incidence in a community area, race/ethnicity, and income of that area we calculated simple correlation coefficients. There were strong and significant correlations between incidence of combined firearm assault and per cent black race (r=0.8, p<0.001), per cent of households below the poverty level (r=0.7, p<0.001), and median income (r=−0.6, p<0.001). There was poor correlation between combined assault incidence and per cent Hispanic ethnicity (r=−0.1, p<0.17). In addition, we attempted to separate the effects of race and poverty by specifically looking at assault rates in community areas with a high prevalence of poverty (>30% of households below the poverty level): in each of these areas fewer than half of the population were white. We used multivariate regression analysis (using the variables per cent black race, per cent Hispanic ethnicity, per cent below poverty, and median income) to predict community area combined assault rates. Per cent below poverty and per cent black race are highly correlated (r=0.7, p<0.001); per cent black race and either (a) per cent below poverty or (b) median income together accounted for 70% of the variance in combined assault rates among community areas. The addition of per cent Hispanic ethnicity added little to the model (R2 change of 0.02).
Discussion
These data demonstrate that both non-fatal and fatal firearm assaults of Chicago children and adolescents younger than 17 years old increased significantly from 1986 to 1994, and declined from 1994 to 1996. We found that in community areas with high rates of fatal assault, non-fatal firearm assaults were also common. A handgun was the weapon most frequently used in both non-fatal and fatal firearm assaults. Non-fatal and fatal firearm assaults disproportionately affected both males and females of black race and Hispanic ethnicity. Trends in assault rates were heavily influenced by non-white populations. Poverty and black race in community areas were highly correlated and accounted for most of the variation in assault rates among community areas.
FIREARM INJURY SURVEILLANCE
The overall trends we report are in keeping with United States national data that indicate increases in firearm related deaths from 1986 to 1993 and decreases since then.1–3 Only recently have national and local firearm injury surveillance programs been initiated.6,7,16,17 The Centers for Disease Control and Prevention (CDC) used emergency department surveillance to estimate that the incidence of non-fatal firearm injuries in 1992 for children 0–14 years old was 6.7/100 000, and for those 15–24 years old it was 119.5/100 000.7 Among those 15–24 years old, approximately 65% of non-fatal cases were associated with assault; assault data were not reported for children younger than 15 years old. The higher non-fatal assault rates we found exceed the injury rates reported by the CDC. This is probably due to data source differences and because we report local urban rather than national data.
More recently, the same surveillance system indicated that the annual number of non-fatal firearm related injuries increased from June 1992 through May 1994 and then decreased from June 1994 through May 1995.18 The data for non-fatal and fatal firearm assaults we present show similar trends.
An analysis of firearm related injuries in three American cities, Memphis, Seattle, and Galveston, 1992–94, showed rates (per 100 000) for children 0–14 years old of 62.0 (black males), 27.5 (black females), 16.4 (Hispanic males), 16.8 (Hispanic females), 6.7 (white males), and 4.7 (white females). City specific rates were quite variable.8 The firearm related assault rates in the present study were higher. However, comparisons are difficult because of demographic and economic differences between cities and because the data sources used were different.
Various data sources, including vital statistics, trauma registries, hospital discharge data, and police records provide independent, incomplete glimpses of the firearm injury picture. Although the actual injuries to victims of aggravated battery (or assault) are unknown, police data may help us get closer to base rates of injury from firearms, as each assault is a potential injury. The high rates we report reflect the broad base of firearm events that lead to injury.
Because non-fatal and fatal assaults involve the same weapons and demographically similar victims, we can use data related to one to help understand the other. Fatal firearm assaults represent a fraction of violent events involving a firearm. Non-fatal firearm assaults are less severe but affect many more people, and thus provide more accurate information about those at risk for firearm injury and the environments in which injuries occur.
AGE
While older adolescents and young adults are often identified as being at greatest risk for firearm injury and death,1,3–5,7,17–19 our analysis indicates that assaults began to increase in preadolescence for males of both black race and Hispanic ethnicity; rates accelerated through adolescence. It will be important to specifically track the assault rates among the younger adolescents. Strategies for reducing violent injury must also address this age group.
RACE/ETHNICITY
Fatal assaults most often involved black males, and the trends we report were consistent with national homicide data.18,19 Rates for 15–16 year old black males were similar to those observed in other urban areas.20 The incidence of fatal firearm assault for Hispanic male teens (15–16 years old) in Chicago was similar to the rate reported for black males in other metropolitan areas.20 The relative risk of non-fatal assault among Hispanic males and females falls between the risks experienced by blacks and whites. Non-fatal assaults among black females doubled during the study period; their risk exceeded that of white males in all years of the study. It is not clear if black females own and use firearms, or if they live or travel in environments that place them at increased risk, or both.
POVERTY
Firearm assault incidence among children and adolescents was not uniformly distributed throughout Chicago's community areas: rates varied with the racial composition and economic characteristics of Chicago community areas. While the specific attributes that directly influence the firearm assault risk in community areas are unknown at this time, both race and low socioeconomic status are important, and appear to be linked. Our analysis suggests that decreasing poverty in a community area may decrease childhood firearm assault rates.
Our results are consistent with reports of adult homicide, as the adult homicide rate has been correlated with census tract socioeconomic status.21,22 At low socioeconomic levels, blacks are more likely than whites to become homicide victims. At higher economic levels, this difference disappears.21,23
It is unclear why poor blacks are more often homicide victims than are poor whites. It is difficult to separate the effects of race or ethnic status from community influences. In addition to variations in racial composition, impoverished communities differ in concentrations of poverty, housing and population densities, and rates of population turnover and family disruption. There are community specific differences in the amount of illegal drug traffic, the presence of gangs, and the density of firearms. These factors are all potential contributors to the occurrence of violent events.24–26
In 37% of the fatal assaults the victim and the assailant were either related family members, or friends or acquaintances. Thus, it is likely that many victims and their assailants were of similar race/ethnicity, socioeconomic status, and community. These data suggest that child and adolescent firearm assault and injury are often not random, but rather the outcome of confrontations among armed youth. Impeding access to handguns should reduce both death and injury regardless of culture, race, or socioeconomic factors.
LIMITATIONS
We have no way to distinguish children who were hit by a bullet from those struck with the gun (pistol whipped). We only know the assault involved a firearm and physical contact, and that a police report was filed. Comparisons with studies of gunshot wounds among children should be made with care, but our data suggest that there are associations between non-fatal assault and homicide, and therefore probably between non-fatal assault and gunshot wounds.
We identified the census tract of each assault based on the incident address, as the address of the victim's residence was unknown to us. We assumed that all assault victims were Chicago residents. This may not be true; some victims may have been visitors to Chicago. Although there is no way to determine the proportion of assaulted youth who were non-residents, it seems unlikely that many victims did not live in Chicago.
Age, race, ethnicity, and gender specific rates were based on data from the 1990 census. We assumed a stable population over the eight years of the study. Small changes in the population would not affect the large trends we describe.
Only cases of non-fatal and fatal assaults reported to the police are included. The data underestimate the true incidence of assault with a firearm, as not all assaults are reported to police. It is not likely any cases of fatal assault were missed. We do not know the specific injuries suffered by non-fatal firearm assault victims. As weapons were not recovered in many assaults, it is possible there was police misclassification in designating the weapon as handgun or other firearm.
Implications for prevention
These data suggest that children who suffer fatal firearm assault are derived from the same population as the children who suffer non-fatal assault. Trends in non-fatal and fatal firearm assaults in Chicago were similar to national trends in non-fatal and fatal firearm injury. While firearm assault and injury rates appear to have declined since 1994, rates currently exceed rates observed in the early 1990s. There are no clear explanations for the upward and downward trends in the rates of youth violence: an improved economy, a decline in the drug trade, and increased policing have all been suggested.18,25,26 Until we understand the reasons assault and injury rates change and develop interventions that predictably effect change, no one should take comfort in the trends we describe. In Chicago, the risk of firearm assault is community specific: black and Hispanic youth living in poor communities are the likely victims of gunshot wounds and deaths. White youth risk is much lower. Multidisciplinary programs that are community specific must be developed. They should focus on supporting families and providing activities for youth, reducing poverty, reducing illegal drug traffic, limiting youth access to handguns, and reducing the overall density of firearms in the community.
Acknowledgments
We thank Katherine Kaufer Christoffel, MD for editorial review and Edwin Chen, PhD for his assistance with statistical analysis. We gratefully acknowledge the Chicago Police Department for their help with this project.
Presented in part at the Ambulatory Pediatric Association Annual Meeting, Seattle, Washington, 3 May 1994.
Dr Tanz is supported by a grant from the William G McGowan Charitable Fund.