Article Text

Abstract
Objective As the results from epidemiological studies about the impact of outdoor air pollution on asthma in children are heterogeneous, our objective was to investigate the association between asthma exacerbation in children and exposure to air pollutants.
Methods A database of 1 264 585 paediatric visits during the 2010–2015 period to the emergency rooms from 20 emergency departments (EDs) of ‘Assistance Publique Hôpitaux de Paris (APHP)’, the largest hospital group in Europe, was used. A total of 47 107 visits were classified as asthma exacerbations. Concentration of air pollutants (nitrogen dioxide, ozone, fine particulate matter (PM) with an aerodynamic diameter smaller than 10 µm (PM10) and 2.5 µm (PM2.5)), as well as meteorological data, evolution of respiratory syncytial virus infection and pollen exposition, were collected on an hourly or daily basis for the same period using institutional databases. To assess the association between air pollution and asthma, mixed-effects quasi-Poisson regression modelling was performed.
Results The only compound independently associated with ED visits for asthma was PM2.5 (P<10−4). The association between asthma exacerbation and PM2.5 was not linear, and a sigmoid function described the relationshipsatisfactorily. PM2.5 concentration, which gives half the maximum effect, was estimated at 13.5 µg/m3.
Conclusions We found an association between daily asthma exacerbation in paediatric visits to the ED and fine particulate air pollutants.
- general paediatrics
Statistics from Altmetric.com
What is already known on this topic?
Epidemiological studies on the impact of air pollution on asthma in children are heterogeneous.
This is related to diversity of air pollution markers and the lack of adjustment to environmental factors possibly linked to air pollution and asthma.
What this study adds?
There is an association between daily concentrations of fine particulate matter with an aerodynamic diameter smaller than 2.5 µm and emergency department visits for asthma in children.
These concentrations may be lower than targets recommended by the European Union.
Introduction
The International Study of Asthma and Allergies in Childhood found that about 14% of the world’s children were likely to have asthmatic symptoms in the last year and suggested that pollution is a major cause of asthma in children.1 Children may be more vulnerable to the health effects of ambient air pollution because of their higher rates of breathing, narrower airways, developing lungs and frequent exposure to outdoor air.2 3 Exposure to high levels, but also to recommended levels of air pollutants, has been shown to aggravate symptoms.4 5
A recent systematic review of the literature on the relationship between environmental exposures and asthma in young children6 identified 27 studies including only 2 studies where acute outdoor pollution was the environmental exposure of interest.7 8
A more recent study, not included in this review, also examined the relationship between outdoor pollution and paediatric asthma.9 The results of these three epidemiological studies on the impact of air pollution on asthma in children were heterogeneous due to the diversity of air pollution markers and the lack of adjustment to environmental factors possibly linked together to air pollution (temperature, wind, humidity, viral infections, allergens) and asthma.
The aim of the present study was to examine the association between presentation to hospital for acute asthma and short-term exposure to air pollution after controlling for the confounding factors (ie, weather, viral environment and allergens).
Methods
Study population
Data were extracted from a database of 1 264 585 paediatric visits to emergency rooms of the 20 emergency departments (EDs) of ‘Assistance Publique Hôpitaux de Paris (APHP)’, the largest hospital group in Europe, receiving children during the 2010–2015 period (see online supplementary figures 1–4). The total number of children in these hospitals areas is likely between 600 000 and 1 000 000 (statistics from www.insee.fr). A total of 47 107 visits were classified by paediatricians in the EDs as asthma exacerbations according to the International Classification of Diseases-10. The extracted variables for each patient were name of the hospital, date/hour of visit, age, gender, patient’s ZIP code, main diagnosis, disposition after ED visit and date/hour of discharge.
Pollution data
Pollution data were collected from 3 September 2010 to 27 September 2015 on an hourly basis from the Paris Air Quality Agency (Airparif; http://www.airparif.asso.fr/). The following compounds were monitored: nitrogen dioxide (NO2), ozone (O3) and fine particulate matter (PM) with an aerodynamic diameter smaller than 10 µm (PM10) and 2.5 µm (PM2.5). Each pollutant concentration was expressed in μg/m3. The number of stations that monitored pollution was 33, 22, 18 and 4 for NO2, O3, PM10 and PM2.5, respectively. The hourly recorded pollution data were averaged to obtain a daily mean exposure for each compound (µg/m3).
Environmental data
Meteorological, viral (respiratory syncytial virus (RSV)) and pollen data were collected for the same period (from 3 September 2010 to 27 September 2015), respectively, from the French Meteorology Agency (Meteo France; https://donneespubliques.meteofrance.fr/), the reference national centre/hospital laboratory network (‘réseauRENAL’) and the ‘Réseau National de Surveillance Aérobiologique’ (http://www.pollens.fr/accueil.php).
Meteorological data consisted of maximum daily precipitations (mm), temperature (°C), atmospheric pressure (hPa), wind speed (m/s) and relative humidity (%). Viral data were focused on RSV. The detection of RSV was done by immunological techniques or by molecular biology (PCR). Data on virus were collected on a weekly basis as the number of positive cases in all the microbiological labs of APHP. Total pollen taxa (g/m³) was the daily sum of all taxa.
Statistical analysis
The primary endpoint was defined as an ED visit with a main diagnosis of asthma exacerbation. Due to the high variations among stations in the measurement of a given pollutant within the same day, the Zip code of the patient’s residency was linked to the closest measurement station. Global positioning system positions were obtained for all Zip codes collected from the ED database, as well as for all pollution stations. Each pollution station was then linked to several Zip codes defining a geographical area.
Data description was done through the usual tools, using counts and proportions for categorical data, and mean, SD, median, IQR, and minimum and maximum values for other quantitative data. Correlations between continuous variables were calculated using the non-parametric Spearman’s rank correlation test.
Data were analysed using the non-linear mixed-effect modelling software program Monolix V.2016R1 (available at www.lixoft.eu). To assess the association of daily pollution exposure with the occurrence of visit for asthma, mixed-effects quasi-Poisson regression models were used. A random effect was applied on the geographical area to account for the correlation structure within a given area. Based on preliminary known associations of variables with asthma, the following adjustment covariates were selected: meteorological variables (detailed in the ‘environmental data’ section), total pollen taxa and RSV, with the addition of public holidays. To account for non-linearity association, a sigmoid function was used according to the following equation:  , where COV stands for continuous covariate, Emax stands for the maximum change on daily asthma visit associated with COV, and E50
stands for the COV value to reach 50% of the maximum change. All parameters were estimated using the stochastic approximation expectation maximisation algorithm combined with the Markov chain Monte Carlo procedure.10
, where COV stands for continuous covariate, Emax stands for the maximum change on daily asthma visit associated with COV, and E50
stands for the COV value to reach 50% of the maximum change. All parameters were estimated using the stochastic approximation expectation maximisation algorithm combined with the Markov chain Monte Carlo procedure.10
Results
Study population characteristics and environmental data
From 3 September 2010 to 27 September 2015, a total of 1 264 585 ED visits for patients under 18 years of age were recorded, involving a total of 47 107 visits with a primary diagnosis of asthma exacerbation (3.7%). The median (IQR) age was 3.5 (1.3–8.8) years, and 55.4% were boys. The median time spent in the ED was higher for patients admitted for asthma diagnosis than with the general population (203 vs 114 min). The characteristics of patients are shown in table 1.
Characteristics of patients (aged less than 18 years) from 3 September 2010 to 27 September 2015
Regarding pollution data, the mean (SD) concentrations over the 5-year period for NO2, O3, PM10 and PM2.5 were, respectively, 41.8 (26), 45.5 (22), 29.4 (17) and 18.4 (13) µg/m3. It is noteworthy that a decreasing trend was observed from 2011 to 2014 for NO2, PM10 and PM2.5, with a per cent decrease of 6.6%, 20.5% and 25.1%, respectively. However, a 5% increase of O3 concentrations was observed over the 4-year fully recorded period. For NO2 and O3, the annual mean concentrations were higher than the maximum limit indicated by the European Union (EU) and WHO guidelines within the 4-year fully recorded period, whereas the annual mean levels of PM10 and PM2.5 were slightly below the EU but above the WHO threshold (see online supplementary figures 5–6).
The description of all environmental variables, including pollution, meteorological, taxa and RSV, is provided in online supplementary table 1.
Supplementary file 7
Association between asthma ED visits and pollution
The association between each pollutant and emergency visit for asthma was evaluated after adjusting for potential confounding factors. A significant association was found between NO2, PM <10 µm and PM <2.5 µm levels and daily number of emergency visits for asthma (P<10−4). Interestingly, the association between particles from 2.5 to 10 µm and emergency visit for asthma resulted in a non-significant relationship (P=0.90), suggesting that PM10 effect was mainly due to particles with a diameter less than 2.5 µm. No significant association was found with O3 (P=0.98).
A multiple regression Poisson model was thereafter used, including both NO2 and PM2.5. In this model, while PM2.5 remained highly correlated with daily number of emergency visits for asthma (P<10−4), NO2 was not significant anymore (P=0.062), suggesting that particles <2.5 µm were the only compound independently associated with ED visits for asthma. Furthermore, addition of an NO2 effect to the model including only PM2.5 compound did not improve the fit and provided a significant increase in the Bayesian information criterion (BIC).
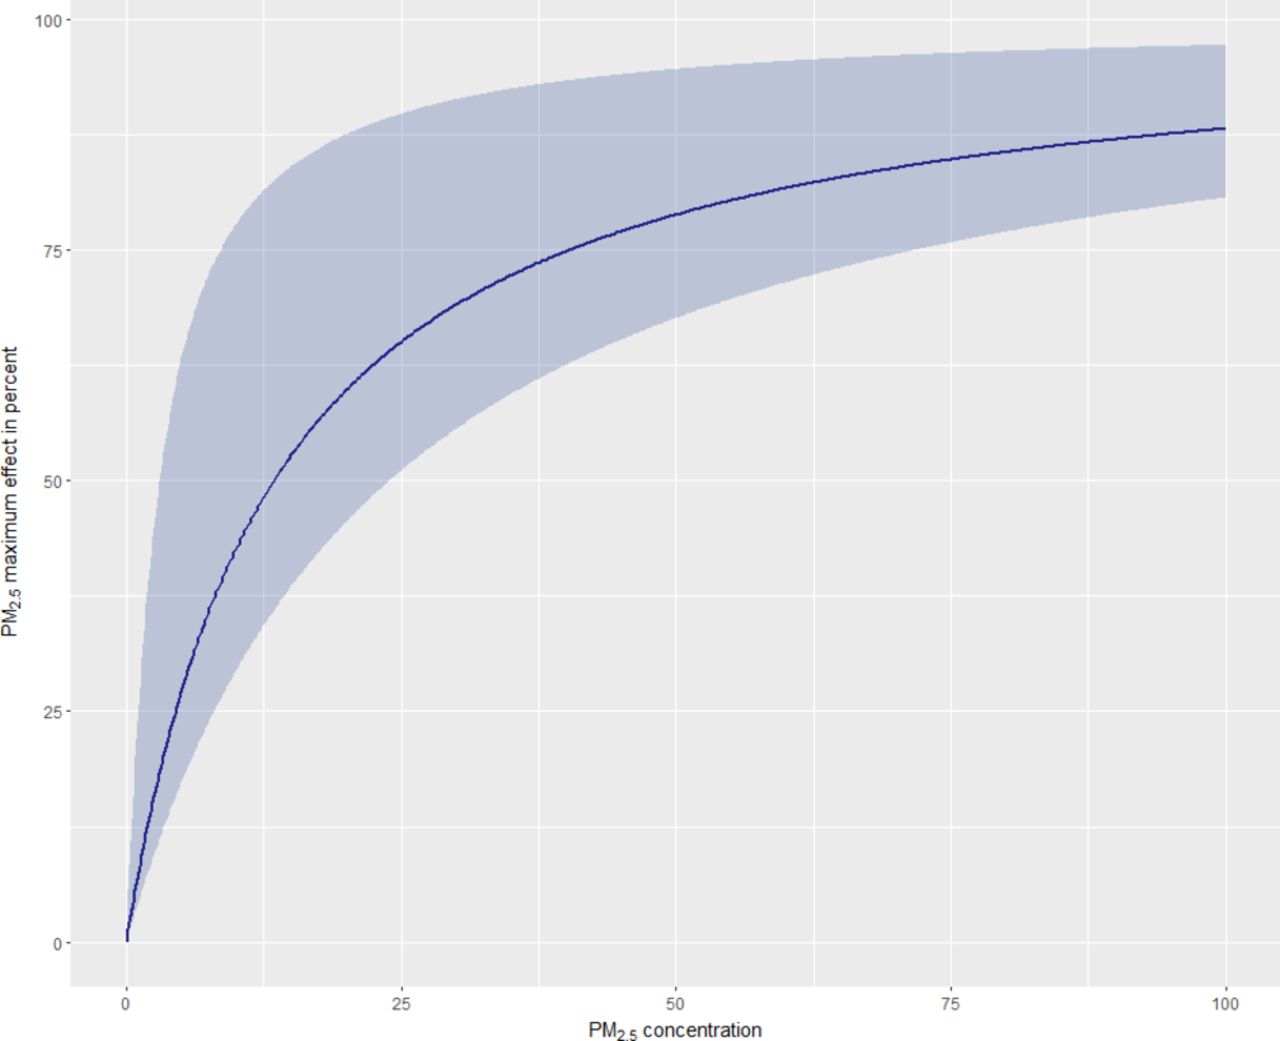
A non-linearity relationship was found between PM2.5 concentrations and the number of visits for asthma exacerbation. The use of a sigmoid function provided a significant drop in the BIC (−2916 units). According to the model, the number of daily visits for asthma appeared to increase gradually, with PM2.5 up to a plateau (estimated Emax: +135%). The PM2.5 concentration, which gave half of this plateau, was estimated at 13.5 µg/m3. Table 2 summarises the results of the final Poisson regression estimates. Regarding meteorological variables, humidity and RSV were positively associated with the number of visits for asthma. Figure 1 shows the observed numbers of ED visits for asthma per day as a function of time in all EDs included in this study. The superimposition of the model prediction, which takes all covariates into account, on the observations provides a visual inspection of the goodness of fit during the period studied.
Poisson regression estimates measuring the association between visits to the emergency department for asthma exacerbation and various meteorological pollen, virus and fine particles

Observed numbers of emergency department visits for asthma per day as a function of time. The blue curve stands for the Poisson model predictions. The area stands for the 95% prediction interval.
The sigmoid function, which describes the relationship between the number of ED visits for asthma and PM2.5 concentrations, is displayed in figure 2. According to the model, European standards and WHO recommendations (annual mean of 25 µg/m3 and 10 µg/m3) stand for 65% and 42% of the maximum estimated effect for PM2.5, respectively.
PM2.5 maximum effect in per cent as a function of PM2.5 concentrations. Blue area stands for the 95% CI. PM2.5, fine particulate matter with an aerodynamic diameter smaller than 2.5 µm.
Discussion and conclusions
Our study has shown a significant association between outdoor air pollution by PM2.5 and the number of visits for paediatric asthma exacerbations in the largest urban French area. The main sources of PMs are power stations, motor vehicles and domestic coal burning. They include a carbon core surrounded by chemicals (sulfates, metals or polycyclic aromatic hydrocarbons). Fine particles (<2.5 μm) can remain suspended longer in the atmosphere compared with the bigger ones and can reach the end of the respiratory tract.11 Currently, in France, emergency procedures in case of pollution peak or persistence of a pollution episode consist of both public recommendations (ie, vulnerable and sensitive individuals are advised to avoid intense physical activities) and restricting measures (ie, suspension of activities contributing to pollution, such as industries and transport, including vehicle traffic).
The results of our study are consistent with those obtained in Seville, which relate hospitalisation for acute respiratory diseases including bronchiolitis, pneumonia, asthma and bronchitis, and other causes to PM2.5 in children.10
In our study, no association of O3 with ED visit for asthma was found. A study conducted in New York City in 2010 found that both PM2.5 and O3 were associated with an increased risk of asthma hospitalisations.12 Gass et al 9 also found a multipollutant joint effects (NO2, O3 and PM2.5) on ED visits for paediatric asthma. However, in our analysis, the overall confounders that could affect the association between pollutants and asthma exacerbations were taken into account: meteorological factors, data for pollen and RSV count. Furthermore, due to a relatively high correlation between NO2 and PM2.5 levels in our study (Spearman’s r=0.7), no additional effect of NO2 was observed after accounting for PM2.5 concentrations.
Other methodological approaches were also previously used in order to assess the association between air pollutant mixtures and clinical endpoints.9 13 These approaches are based on classification and regression tree methods. Our analysis was based on traditional pollutant regression models, which are currently the most commonly used and preferred method in this context.
We observed a non-linearity in the association between asthma exacerbation and PM2.5. According to the model, the number of daily visits for asthma appeared to increase strongly with PM2.5 up to 20 µg/m3, and a change in shape was observed thereafter towards an asymptote. PM2.5 concentration, which gave half of this plateau, was estimated at 13.5 µg/m3. These findings are consistent with the results obtained by Pablo-Romero et al.14 The authors report a constant increase of hospital paediatric admission rate specifically for asthma until a value of around 20 µg/m3.
Our study has several limitations: (1) In the Poisson model, we assumed the population at risk was constant throughout the study period; however, given the massive paediatric population size in Ile de France district, no substantial variation is expected during the study period. (2) Another limitation is the number of stations measuring specifically PMs below 2.5 µm. Only four stations were available in this study for the Paris district area. The median distance between the patient’s home and the nearest pollution station was 4 km, so individual’s PM2.5 exposure may not be highly accurate. However, it is noteworthy that daily levels recorded by these stations were highly correlated (Spearman’s r >0.7), suggesting that the trends in PM2.5 emissions were similar across the different geographical areas. (3) Finally, the observational design of this study cannot lead us to conclude on the causal effects of pollutants, and only associations can be pointed out.
The Air Quality Guidelines set by the WHO are stricter than the EU air quality standards for PM2.5.11 The WHO and EU target values were 10 and 25 µg/m3, respectively. The EU target for PM2.5 is probably too high to significantly reduce the number of ED visits for asthma. It suggests to take further action to reduce pollutant emissions and improve air quality.
Supplementary file 1
![[SP1.jpg]](https://adc.bmj.com/content/archdischild/103/9/828/DC2/embed/inline-supplementary-material-2.jpg?download=true)
Supplementary file 2
![[SP2.jpg]](https://adc.bmj.com/content/archdischild/103/9/828/DC3/embed/inline-supplementary-material-3.jpg?download=true)
Supplementary file 3
![[SP3.jpg]](https://adc.bmj.com/content/archdischild/103/9/828/DC4/embed/inline-supplementary-material-4.jpg?download=true)
Supplementary file 4
![[SP4.jpg]](https://adc.bmj.com/content/archdischild/103/9/828/DC5/embed/inline-supplementary-material-5.jpg?download=true)
Supplementary file 5
![[SP5.jpg]](https://adc.bmj.com/content/archdischild/103/9/828/DC6/embed/inline-supplementary-material-6.jpg?download=true)
Supplementary file 6
![[SP6.jpg]](https://adc.bmj.com/content/archdischild/103/9/828/DC7/embed/inline-supplementary-material-7.jpg?download=true)
Acknowledgments
We thank all participant centers, Sandrine Chipot and Mathias Huitorel from the D-SISIF, and Laurent Tréluyer, Director of Information Systems from APHP.
References
Footnotes
Contributors HC, RG, RC conceptualised and designed the study, drafted the initial manuscript and revised the manuscript. NB, FF, SU conceptualised and designed the study, carried out the initial analyses, and reviewed and revised the manuscript. JMT designed the data collection instruments, coordinated and supervised data collection, and critically reviewed the manuscript for important intellectual content. All authors approved the final manuscript as submitted and agreed to be accountable for all aspects of the work.
Competing interests None declared.
Ethics approval The study was approved by the ethics committee of Necker-Enfants Malades Hospital (Paris).
Provenance and peer review Not commissioned; internally peer reviewed.
Linked Articles
- Editorial