Article Text

Abstract
Objective To quantify reductions in hospital care for clinically vulnerable children during the COVID-19 pandemic.
Design Birth cohort.
Setting National Health Service hospitals in England.
Study population All children aged <5 years with a birth recorded in hospital administrative data (January 2010–March 2021).
Main exposure Clinical vulnerability defined by a chronic health condition, preterm birth (<37 weeks’ gestation) or low birth weight (<2500 g).
Main outcomes Reductions in care defined by predicted hospital contact rates for 2020, estimated from 2015 to 2019, minus observed rates per 1000 child years during the first year of the pandemic (March 2020–2021).
Results Of 3 813 465 children, 17.7% (one in six) were clinically vulnerable (9.5% born preterm or low birth weight, 10.3% had a chronic condition). Reductions in hospital care during the pandemic were much higher for clinically vulnerable children than peers: respectively, outpatient attendances (314 vs 73 per 1000 child years), planned admissions (55 vs 10) and unplanned admissions (105 vs 79). Clinically vulnerable children accounted for 50.1% of the reduction in outpatient attendances, 55.0% in planned admissions and 32.8% in unplanned hospital admissions. During the pandemic, weekly rates of planned care returned to prepandemic levels for infants with chronic conditions but not older children. Reductions in care differed by ethnic group and level of deprivation. Virtual outpatient attendances increased from 3.2% to 24.8% during the pandemic.
Conclusion One in six clinically vulnerable children accounted for one-third to one half of the reduction in hospital care during the pandemic.
- Covid-19
- Child Health
- Healthcare Disparities
- Health services research
Data availability statement
Data may be obtained from a third party and are not publicly available. The data used in this analysis are expected to be available to accredited researchers in 2022 (as part of the ECHILD Database) by applying to the data providers (DfE and NHS Digital).
This is an open access article distributed in accordance with the Creative Commons Attribution 4.0 Unported (CC BY 4.0) license, which permits others to copy, redistribute, remix, transform and build upon this work for any purpose, provided the original work is properly cited, a link to the licence is given, and indication of whether changes were made. See: https://creativecommons.org/licenses/by/4.0/.
Statistics from Altmetric.com
What is already known on this topic
Young children with chronic health conditions have high rates of hospital care.
Rates of planned and unplanned hospital admissions and outpatient care rose steadily in the decade before the pandemic.
Hospital care reduced sharply after the onset of the COVID-19 pandemic for all children.
What this study adds
One in six clinically vulnerable children 0–4 years old accounted for one-third to one-half of reductions in hospital care during the pandemic in this age group.
There were small differences in reductions between black and Asian ethnic groups (vs white) and for children in the most deprived quintile (vs least deprived).
Planned care weekly rates (outpatient or admissions) for children with chronic conditions reduced sharply during the pandemic and returned to prepandemic levels only among infants.
How this study might affect research, practice or policy
Research is needed to understand the reductions in planned care, the types of care or procedures affected and the short-term and long-term implications for children.
Research is needed to ascertain whether contact rates have returned to previous levels since the ending of pandemic restrictions.
Children in vulnerable groups will likely need targeted catch-up funding and resources to mitigate or prevent adverse outcomes accruing from the reductions we report.
Introduction
Rates of hospital contact (outpatient attendances, planned and unplanned hospital admissions) among 0–4 year-olds are highest for infants and have increased steadily in England over the past decade.1–3 Hospital utilisation patterns differ markedly by age and clinical vulnerability: children born preterm, with low birth weight or a congenital anomaly, have substantially more admissions than other children.4 5
Hospital contacts reduced substantially during the COVID-19 lockdown,6–9 which likely most impacted high intensity users of planned hospital care, such as children born too early or too small or with underlying health conditions.1 2 10 Postponed or cancelled planned hospital care may result in delayed diagnoses or treatments, which could be detrimental to health or development.11 Fewer unplanned hospital admissions might reflect fewer infections, injuries or other health problems due to reduced exposure during pandemic restrictions but could also reflect unmet need.
This study aimed to quantify reductions in planned and unplanned hospital care for clinically vulnerable children and non-vulnerable peers during the COVID-19 pandemic using national, longitudinal administrative hospital data for England. We measured planned hospital contacts (admissions and outpatient attendances) and unplanned admissions among children with chronic health conditions or born preterm or low birth weight and children with no recorded clinical vulnerability as well as by ethnicity and area-based deprivation. Reductions were quantified as the difference between predicted and observed rates of hospital contacts during the first year of the pandemic. We also examined whether rates of contact returned to prepandemic levels and described changes in the type of outpatient contact (eg, face to face or virtual).
Methods
Study population and data source
Children were included in the cohort if aged 0–4 years and their birth was recorded in hospital administrative data in the English NHS (Hospital Episode Statistics (HES)) between 1 January 2010 and 31 March 2021. HES records 97% of all births in England.12 Children were followed until the earliest of fifth birthday or 31 March 2021 (online supplemental figure 1). All contacts with NHS hospitals in England (including admitted patient care and outpatient attendances) were linked using the encrypted HES Identifier (ID). Accident and emergency (A&E) attendances could not be included as patient-level linkage is via Token ID.13 We combined consecutive consultant episodes and hospital transfers to form admissions.14
Supplemental material
Outcome and exposure
Our primary outcome was the reduction in hospital care, defined as the difference between observed and predicted rates (per 1000 child-years (cy)) of hospital contacts (stratified into outpatient attendances, planned or unplanned admissions) during the pandemic (23 March 2020–22 March 2021). Inpatient admissions were classified as planned or unplanned using the ‘admission method’ variable (admissions have a predictable clinical need where the decision to admit may be separated in time from the actual admission).15 We also described trends in weekly rates of hospital contacts by age (from 1 January 2020 to 31 March 2021 and averaged for 2015–2019), and uptake (attended, missed, cancelled and postponed) and mode (in person, virtually) of outpatient contacts.
Clinical vulnerability was defined by a chronic condition recorded up to age 4 years, or preterm birth (<37 weeks of gestation) or low birth weight (<2500 g) recorded in birth or delivery records. A child had a chronic condition at a given age if at least one relevant International Classification of Diseases 10th revision (ICD-10) code (identified using code lists developed by Feudtner and Hardelid12 16–18) was recorded in any of their records up to that age including their birth admission. Completeness of demographic variables declined for children born during the pandemic (missingness increase by; 9% Index of Multiple Deprivation (IMD); 3% birth weight; 2% gestational age) but was unchanged for admission characteristics including inpatient admission type (planned, unplanned, birth or maternity) or outpatient attendance type (in-person and virtual), similar to outpatient data metrics published by NHS digital.19 Children with a chronic condition but missing gestation and birth weight were categorised as clinically vulnerable (chronic condition only).
We analysed risk factors associated with health service use: age (0–11 months, 1–4 years),3 quintile/fifth of deprivation derived from the national distribution of the IMD 2004 (an area measure for ~650 households)20 21 and recorded ethnic group (grouped as white, black, Asian or other, including mixed and Chinese).
Statistical analyses
We calculated observed rates of hospital contacts per 1000 cy in the prepandemic period (2015–2019), stratifying by risk factors.
We calculated child-years at risk by averaging the eligible population of births recorded in HES at the beginning and end of a year, assuming no emigration and ignoring deaths. We used Poisson regression (including a linear effect of time and log of the midyear population as an offset) to model rates stratified by risk factors from 1 January 2015 to 31 December 2019. Data from 1 January to 22 March 2020 were excluded from the prepandemic period because reductions in hospital contact rates preceded the first lockdown. To calculate the reduction in hospital contacts, we predicted rates for the pandemic period, assuming that the pandemic had not occurred and previous trends would have continued. The reduction was estimated as the difference between predicted and observed rates. We also calculated reductions within the first national lockdown (23 March–23 June 2020), easing of restrictions (24 June–4 November 2020), second national lockdown (5 November–31 December 2020) and third national lockdown (1 January–22 March 2021).22
We calculated weekly rates between 1 January 2015 and 31 March 2021, using dynamic denominator study populations to accommodate temporal changes in hospital activity. Analyses stratified children with and without chronic conditions (recorded between birth and the relevant week) because we expected the differences to be largest between these comparators. Weekly rates of hospital contact were calculated by dividing the total number of weekly admissions or attendances by the weekly dynamic denominator population of children within each stratification level (ie, a child born in week 1 of 2015 would move into the 1-year-old group in week 1 of 2016 and age out of the cohort in week 1 of 2019). Weekly rates in 2020 and 2021 were plotted against average weekly rates for 2015–2019. We also modelled weekly rates between 1 January 2015 and 31 December 2019, using a Poisson model that included a linear effect of time, calendar month to account for seasonality, log of the weekly denominator population as an offset and second-order lagged residuals. A similar approach was used to estimate weekly reductions during the pandemic. Analyses were performed in Stata V.16.23
Results
Population characteristics
Of the 3 813 465 children aged 0–4 years, 394 384 (10.3%) had a record indicating a chronic condition (including congenital anomalies); 363 950 (9.5%) were born preterm or low birth weight; and 83 283 (2.2%) had both vulnerabilities. Overall, 675 051 (17.7%) had one or more of these clinical vulnerabilities (table 1).
Demographic characteristics of children born between 1 January 2015 and 31 March 2021 by vulnerability status
Hospital contacts prepandemic
Hospital contacts were much higher among infants than children aged 1–4 years: 60.1% (95% CI 60.0 to 60.3) of infants and 8.2% (8.1–8.2) of 1–4 year-olds had ≥1 outpatient attendance each year, reflecting 1538 outpatient attendances per 1000 cy for infants and 302 for 1–4 year-olds (online supplemental figure 2, online supplemental table 1). Overall, 31.2% (31.1–31.3) of clinically vulnerable children had ≥1 outpatient attendance compared with 14.1% (14.1–14.2) of those with no known vulnerability reflecting 1483 attendances per 1000 cy for children with any vulnerability and 295/1000 cy for those without. Patterns were similar for planned and unplanned hospital admissions. Children with chronic conditions had the highest rates of admissions across all strata (online supplemental figures 3 and 4). Children born preterm or low birth weight but with no chronic condition had similar admission rates to their peers born at term or weighing ≥2500 g (online supplemental figure 2).
Hospital contacts during the pandemic
There were stark reductions in rates of all hospital contact types during the pandemic (table 2, online supplemental tables 2-4). Reductions were much larger for children with a chronic condition (outpatient: −492 (−505 to –480) contacts per 1000cy; planned: −91/1000 cy (−95 to –86); unplanned: −230/1000 cy (−236 to –224)) than those without and particularly high for children with a chronic condition who were also born preterm or with a low birth weight (outpatient: −536/1000 cy (−563 to –508); planned: −105/1000 cy (−113 to –97); unplanned: −279/1000 cy (−290 to –268)). Relative reductions were lower for children with any known vulnerability compared with those without any known vulnerability (outpatient: −19.0% (−19.0 to −18.9) vs −25.7% (−25.8 to −25.6); planned: −27.6% (−27.9 to −27.3) vs −58.0% (−58.5 to −57.6); unplanned: −45.9% (−46.1 to –45.7) vs −69.4% (−69.6 to −69.3)) (table 2). The 17.7% of children identified as clinically vulnerable accounted for 50.1% (49.9–50.3) of reductions in outpatient attendances, 55.0% (54.6–55.5) in planned hospital admissions and 32.8% (32.6–33.0) in unplanned hospital admissions (table 2).
Difference between predicted and observed rates of hospital contact during the pandemic (March 2020–2021) among children aged 0–4 years by clinical vulnerability group
Reductions were larger for infants than 1–4 year-olds for outpatient attendances and unplanned admissions but not for planned admissions (figure 1). We found small differences in reductions of planned and unplanned admissions across ethnic groups and in all hospital contacts among children in the most (vs least) deprived quintile (online supplemental tables 3 and 4). The largest reductions in care were among children with a chronic condition (online supplemental figures 5 and 6). Overall, the first lockdown was associated with the largest reductions in outpatient attendances and planned admissions. The largest reductions in unplanned admissions were seen in the second lockdown (table 3; online supplemental tables 5–7).

Reduction in care during the pandemic (March 2020–2021), estimated from predicted minus observed rates of hospital contacts per 1000 child-years for children aged 0–4 years, by clinical vulnerability status and risk factors. CC, chronic conditions; LBW, low birth weight.
Difference in predicted and observed rates of hospital contact per 1000 child-years among children aged 0–4 years during the pandemic (March 2020–2021) by period and clinical vulnerability
Trends in hospital contacts
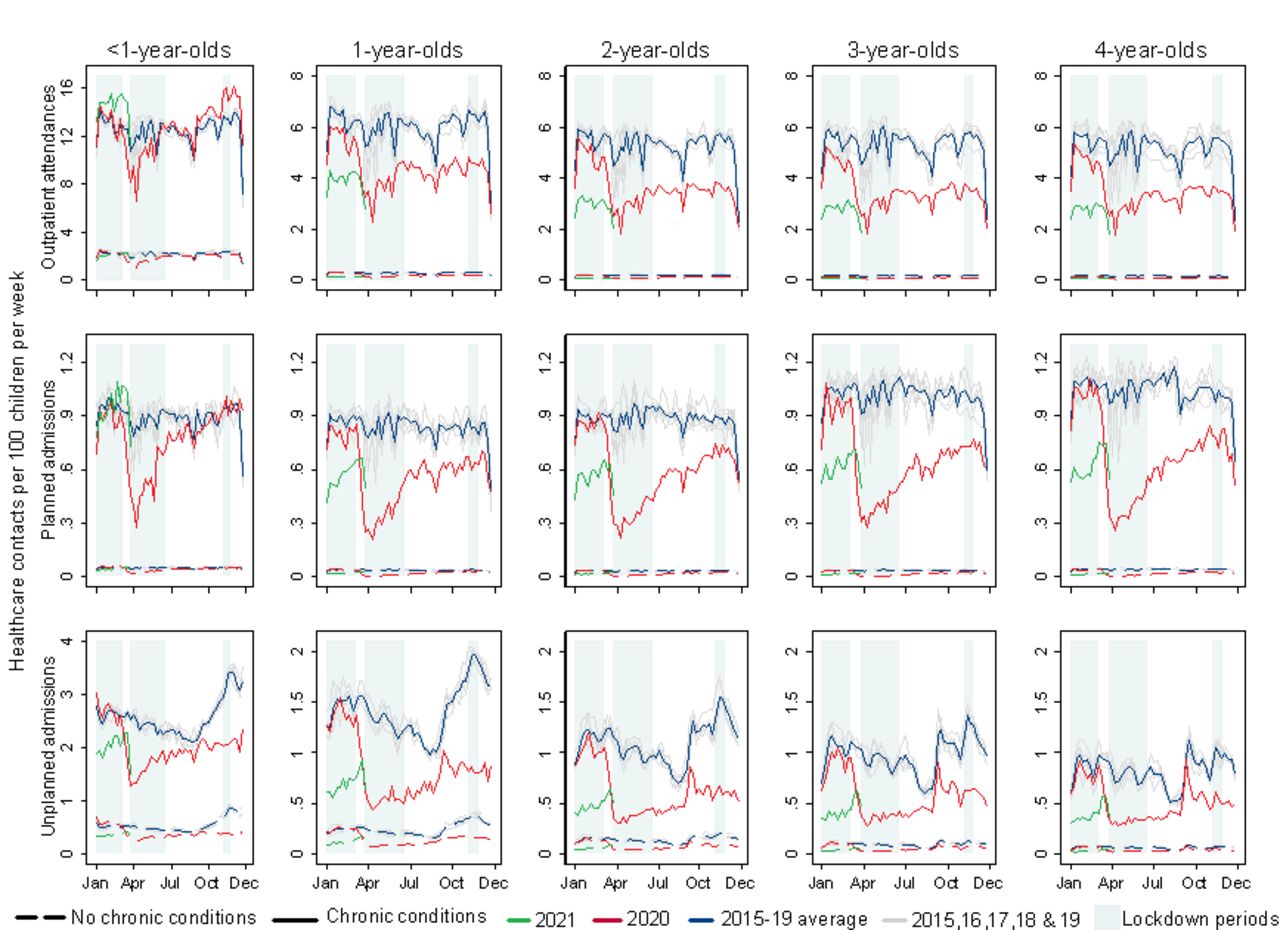
Outpatient attendances reduced sharply before and during the first national lockdown, among children of all ages with a chronic condition, with less perceptible changes among those without a chronic condition. Outpatient attendances rapidly returned to prepandemic rates for infants but remained below 2015–19 averages for older children. Planned admissions followed a similar pattern, with a return to prepandemic rates only for infants (figure 2).
Weekly rates of hospital contacts among children aged 0–4 years during the pandemic (March 2020–2021) and averaged for 2015–2019 by age and presence of a chronic condition. Note: lockdown 1: 23 March–23 June 2020; lockdown 2: 5 November–6 December 2020; lockdown 3: 1 January–8 March 2021.
A similar pattern was observed for reductions in rates of unplanned admissions, and these remained below prepandemic levels for both groups at all ages (figure 2). In 2020, the autumn–winter peak in unplanned admissions was diminished relative to previous years; however, following the reopening of primary schools at the end of the third lockdown on 8 March 2021, there was an increase in unplanned admission rates for all children, particularly those with a chronic condition (figure 2, online supplemental figure 7). Trends did not consistently differ across deprivation levels (online supplemental figures 8 and 9) or by ethnic group (online supplemental figures 10–12).
For all age groups, a spike in cancellations and postponement of outpatient appointments preceded the first lockdown by 3 weeks (online supplemental figure 13). There was an increase in tele/virtual outpatient attendances during the pandemic and face-to-face visits did not return to prepandemic levels in any age group (online supplemental table 8 and figure 14).
Discussion
This population-based cohort study of all children aged <5 years in England found large and disproportionate reductions in planned and unplanned hospital contacts during the COVID-19 pandemic for clinically vulnerable groups. The one in six clinically vulnerable children accounted for over half the reduction in outpatient attendances and planned admissions, and one-third of the reduction in unplanned admissions. While absolute reductions were larger for vulnerable children, they were smaller in relative terms compared with children with no recorded vulnerability suggesting that hospitals prioritised these children. We saw some evidence of recovery in planned care during the pandemic among infants, but not among older children.
This study’s main strength is the use of a birth cohort of all children born in an NHS hospital in England (97% of all births). This large sample size gave us enough data to calculate weekly rates of hospital contacts. The longitudinal nature of the data allowed us to identify chronic conditions from diagnostic codes recorded in all admissions since birth, using a clinically developed coding system.16
Limitations include underascertainment of chronic conditions for children who could not be admitted to hospital due to the pandemic. These children may have been managed in primary care, or as outpatients, where chronic conditions coding is mostly missing. Furthermore, older children would have had more time for chronic conditions to be diagnosed. This likely explains the decline in prevalence of chronic conditions in more recent years. Analyses were restricted by variables available in HES (eg, use of IMD 2004). Vulnerability may be underestimated for the 10% of children who were excluded from the study due to missing gestational age and birth weight data. Multiple imputation of missing data was not feasible given the study size. We could not quantify the reduction in A&E attendances, as this dataset is not yet linkable to admission records. However, recent studies investigating A&E attendances in children reported similar reduced service use during the pandemic.24 25 Our rates did not account for deaths in the denominator (0.5%), non-NHS healthcare or emigration, but these events are rare. Our modelling approach required several assumptions, and our estimates of impacts are likely conservative.
Reductions in hospital care for children during the pandemic have been reported in Europe,7 26–33 Asia,34 North35–38 and South America.39 Most studies investigated A&E attendances or unplanned admissions.25–39 Other studies report a reduction in asthma-related paediatric emergency department attendances29 and reduced likelihood of admission, assessment and surgery for children with epilepsy.40 Furthermore, significant reductions in infection-related hospitalisations have been observed,30 34 36 41 particularly for children under 5 years.41 Two studies conducted national level analyses.30 32 We believe our study reports the first population-level reductions in planned care (admissions and outpatient) for children with health risk-factors for a full year of the pandemic. Previous research in adult populations has reported on the disproportionate burden of COVID-19 infection, hospitalisation and death in minority ethnic groups.42 43 Our study did not examine COVID-19 related contacts because hospitalisation is rare as children typically experience mild asymptomatic disease.44 45 However, we identified small differences in reductions of hospital care for children in the Asian ethnic group and for children in the most deprived quintile. This suggests that inequalities exacerbated by COVID-19 in adult populations might also extend to children from more deprived, minority ethnic backgrounds.
Potential mechanisms underpinning reductions in planned care likely represent restrictions to access, supported by a rise in postponed outpatient care. Our findings show these restrictions were mitigated in infants, who have a high frequency of hospital care and for whom interventions are likely to be more time critical than in older children.3 However, reductions remained large in older children and may reflect unmet need or postponed care that could have longer term health consequences.11 A move to virtual appointments may have exacerbated existing inequalities for families without access to the internet at home.
Reductions in unplanned care may be driven by opposing factors. Previous studies reported decreases in unplanned infection-related hospitalisations due to reduced social exposure and increased hygiene, with little change in admissions for non-infectious causes like appendicitis.27 30 31 34 41 Others have reported reductions in injury.46 The spike in unplanned admissions after schools reopened in autumn 2020 and in March 2021 when the third lockdown ended likely reflects increased socialisation. Other positive effects could include reduced exposure to triggers for respiratory disease (eg, air pollution)47 and improved medication adherence through increased parental supervision. Negative implications could include reduced extrinsic interventions through education, health and social care professionals,7 48 or delaying or avoiding medical care due to fears of hospital-acquired COVID-19 infection.38 49–51 Additionally, these reductions could represent missed opportunities for earlier and more effective intervention.11 52
This analysis was the first step in quantifying deferred or foregone hospital care during the pandemic. Studies using routine administrative data report only acute hospital presentations,37 38 which may reflect late or missed diagnoses.11 52 Our findings confirm and quantify the reduction in hospital contacts for preschool children in England during the first year of the COVID-19 pandemic. Research is needed to understand reductions in planned care, the types of care, procedures or treatments affected and the short-term and long-term implications for children with specific conditions. More research will be needed to ascertain whether contact rates have returned to previous levels since the end of restrictions. Further research will also be needed to identify vulnerable groups likely to experience adverse outcomes from unmet healthcare in order to target ‘catch-up’ funding and resources to prevent or mitigate these adverse outcomes.53
Data availability statement
Data may be obtained from a third party and are not publicly available. The data used in this analysis are expected to be available to accredited researchers in 2022 (as part of the ECHILD Database) by applying to the data providers (DfE and NHS Digital).
Ethics statements
Patient consent for publication
Ethics approval
This study involves human participants and was approved by London—South East Research Ethics Committee (reference 16/LO/0012). Participants gave informed consent to participate in the study before taking part.
Acknowledgments
The data for this project are part of the Education and Child Health Insights from Linked Data (ECHILD) project. The ECHILD project is in partnership with National Health Service Digital and the Department for Education (DfE), and we would like to thank the following individuals for their valuable contributions to the project: Garry Coleman, Richard Caulton, Joanna Geisler, Catherine Day (NHS Digital), Chris Douglass and Gary Connell (DfE). We would like to thank all the children, young people, parents and carers who contributed to the ECHILD project, as well as Dr Erin Walker (UCL Partners) who led this involvement. We would particularly like to thank members of the National Children’ Bureau Young Research Advisors, National Children’ Bureau Family Research Advisory Groups, National Institute for Health Research (NIHR) Great Ormond Street Hospital (GOSH) Biomedical Research Centre Parent and Carer Advisory Group, GOSH Young People’s Forum and GOSH Young Persons Advisory Group for their input to this project. We also gratefully acknowledge all children and families whose deidentified data are used in this analysis. We would like to thank Nicolas Libuy, Pia Hardelid, Chloe Parkin and Matthew Lilliman for their contributions to this project. We would also like to thank the editor and reviewers for their helpful comments during the peer-review process that greatly improved the final paper.
References
Supplementary materials
Supplementary Data
This web only file has been produced by the BMJ Publishing Group from an electronic file supplied by the author(s) and has not been edited for content.
Footnotes
Twitter @mind_the_gap___
Contributors The study was conceived by RG, KLH and RB. DE conducted all the analyses with input from KLH and RG. DE wrote the manuscript with input from all the authors. All the authors approved the final manuscript. DE acts as guarantor.
Funding This work is supported by ADR UK (Administrative Data Research UK), an Economic and Social Research Council (part of UK Research and Innovation) programme (grant number ES/V000977/1). This research was also supported in part by the National Institute for Health Research (NIHR) Great Ormond Street Hospital Biomedical Research Centre and Health Data Research UK (grant number LOND1), funded by the UK Medical Research Council and eight other funders. This research benefits from and contributes to the NIHR Children and Families Policy Research Unit but was not commissioned by the NIHR Policy Research Programme. RG and RB are in part supported by the NIHR Children and Families Policy Research Unit. RB is supported by a UKRI Innovation Fellowship funded by the Medical Research Council (grant number MR/S003797/1). KH is funded by NIHR (grant number 17/99/19).
Disclaimer The views expressed are those of the authors and not necessarily those of the NIHR or the Department of Health and Social Care.
Competing interests None declared.
Provenance and peer review Not commissioned; externally peer reviewed.
Supplemental material This content has been supplied by the author(s). It has not been vetted by BMJ Publishing Group Limited (BMJ) and may not have been peer-reviewed. Any opinions or recommendations discussed are solely those of the author(s) and are not endorsed by BMJ. BMJ disclaims all liability and responsibility arising from any reliance placed on the content. Where the content includes any translated material, BMJ does not warrant the accuracy and reliability of the translations (including but not limited to local regulations, clinical guidelines, terminology, drug names and drug dosages), and is not responsible for any error and/or omissions arising from translation and adaptation or otherwise.