Article Text

Abstract
Objectives To describe the characteristics of high-cost high-need children and young people (CYP) (0–24 years) in England.
Methods Retrospective observational study using data from the Clinical Practice Research Database linked to Hospital Episode Statistics in 2014/2015 and 2015/2016. Healthcare utilisation of primary and secondary care services were calculated, and costs were estimated using Healthcare Resource Group for secondary care and Personal Social Services Research Unit for primary care. High-cost high-need CYP were defined as the top 5% of users by cost.
Results 3891 of 73 392 CYP made up the top 5% that were classified as high-cost high-need, and this group accounted for 54% of total annual costs. In this population, 7.3% were males <5 years and 11.0% were females 20–24 years. Inpatient care (acute) accounted for 63% of known spending in high-cost high-need patients. Total mean monthly cost per patient was 22.7 times greater in the high-cost high-need group compared with all other patients (£4417 vs £195). 29% of CYP in the high-cost high-need group in 2014/2015 were also classified as high-cost high-need in the following year.
Conclusions These findings indicate the importance of further understanding and anticipating trends in CYP health spending to optimise care, reduce costs and inform new models of care. This includes integrated services, a further look into societal factors in reducing health inequalities and a particular focus of mental health services, the demand of which increases with age.
- epidemiology
- health care economics and organizations
- health services research
Data availability statement
Data may be obtained from a third party and are not publicly available.
This is an open access article distributed in accordance with the Creative Commons Attribution Non Commercial (CC BY-NC 4.0) license, which permits others to distribute, remix, adapt, build upon this work non-commercially, and license their derivative works on different terms, provided the original work is properly cited, appropriate credit is given, any changes made indicated, and the use is non-commercial. See: http://creativecommons.org/licenses/by-nc/4.0/.
Statistics from Altmetric.com
What is already known?
In adults, the top 5% of patients by cost account for over 50% of total costs, with the majority of this being acute inpatient care.
Cost in adults is strongly associated with proximity to death.
Age, multimorbidity and deprivation are strong drivers of being in a high-cost high-need group.
What this study adds?
The top 5% of children and young people (CYP; high-cost high-need patients) account for more than half of annual spending for CYP, with costs heavily skewed towards acute inpatient settings.
In this research, the most common categories of long-term condition diagnoses among high-cost high-need CYP are in order: mental health, metabolic, respiratory, neurological conditions.
There is a high turnover of high-cost high-need CYP: the majority of CYP who are high-cost high-need 1 year are not high-cost high-need the following year. This highlights the potential for early intervention to reduce future healthcare costs in children, while improving clinical experience, outcomes and quality of life.
Introduction
Advances in technology and care mean that children with complex needs are surviving for longer than they would have previously resulting in a growing cohort of children with complex needs who require prolonged intensive treatment.1
Previous research demonstrates that in adults the top 5% of patients by cost account for over 50% of total costs in England, with the majority of this being inpatient care costs.2 In other countries, this varies between 40% and 60%.2 3 Furthermore, cost is strongly associated with proximity to death.4 It is known that age, multimorbidity and deprivation are strong drivers of being in a high-cost high-need group.2 3
Research to date has been focused on the whole population or on adult only populations and this has proved useful in identifying areas to reduce costs or improve efficiency.2 However, there is limited research into the distribution and concentration of costs for children and young people (CYP). CYP have different patterns of morbidity and healthcare utilisation compared with adults.
The aim of this study was to describe the characteristics of high-cost high-need children and young people (0–24 years) in England (defined as top 5% by cost).
Clinical illustrative vignettes
A previously fit and well 9-year-old boy who has a severe road traffic accident and requires admission to the paediatric intensive care unit (PICU) has a long hospital stay and requires ongoing rehabilitation. This child previously received preventative care and care for minor illness which were relatively low cost. After this acute incident, this child incurs high costs for the NHS and is now part of the high-cost high-need (top 5% by cost) group of spending within the NHS for that year. There were moderate ongoing costs due to rehabilitation, and 2 years after the incident, he was back to only requiring routine preventative care and care for minor illness. This case highlights the importance of preventative public measures including road safety measures, for example, seatbelts.
A 3-year-old child with viral wheeze who normally has regular GP and outpatient care. This child then has a PICU admission and multiple emergency department (ED) attendances over the winter months. This child did incur some NHS costs in the primary and outpatient care settings. With the acute admission and ED attendances, the costs incurred are much higher in that year and this child is now part of the high-cost high-need group. With good control of the child’s condition and symptoms, this child goes back to requiring primary care and outpatient follow-up. They are back to their baseline in regards to need and cost and no longer in the high-cost high-need group in future years.
Methods
Study data
We used a nationally representative sample of 300 000 patients from the Clinical Practice Research Database (CPRD) in England linked to Hospital Episode Statistics (HES), Office for National Statistics (ONS) mortality and Index of Multiple Deprivation deciles based on patients’ registered home localities for 2014/2015 and 2015/2016. Previous research has shown that CPRD is broadly representative of the English population in terms of age, sex and ethnicity.5 This dataset is the same dataset used for a study examining high-cost high-need patients in the adult population and allows for comparisons between the two studies. CYP are defined as people under the age of 25 in accordance with the NHS Long Term Plan. To enable a full year of exposure, the dataset was filtered for CYP and all deaths and de-registrations were excluded. The final sample was 77 823 patients, with 3891 patients in the top 5% of patients by healthcare expenditure.
Variables of interest
Total costs were estimated for primary care, outpatient care, inpatient care, emergency care and primary care–prescribed drug therapy.2 Costs for outpatient, inpatient and emergency care were estimated by using the HRG4+ Reference Costs Groupers to find a reference cost Healthcare Resource Group (HRG) code for each attendance, using the relevant grouper.6 NHS Improvement Reference Costs were used to cost each attendance.7 Primary care costs were estimated by calculating the time recorded for each consultation and multiplying it by the Personal Social Services Research Unit (PSSRU) 2015 unit costs.8 Finally, primary care–prescribed drug therapies were costs by using cost data from the NHS Business Services Authority Dictionary of medicines and devices.9
Data analysis
Diagnoses and comorbidities were identified in HES using ICD10 codes, based on all admissions 1 year prior to the analysis period, using the methodology set out in Wijlaars et al.10 A long-term condition was defined as a health problem that requires clinical follow-up for more than 12 months in at least half of the cases.10 Costs were calculated per patient per month to account for deaths and de-registrations during the year. Analysis was undertaken using descriptive statistics comparing costs and utilisation across the high-cost high-need group (top 5% by total healthcare cost) and not high-cost high-need, referred to as all other patients (lowest 95% by total healthcare cost). An equality of proportions test was used to test whether the proportion of CYP in the high-cost high-need group are significantly different from one another across deprivation deciles. A Cochrane-Armitage test was used to investigate any linear trend across deprivation deciles.
Ethics
The data used for this analysis were pseudonymised and governed through a data sharing agreement with CPRD registered in England in 2015/2016, ISAC protocol number 17_150R.
Results
In total, 3891/73 392 (5%) CYP were classified as high-cost high-need. The high-cost high-need group accounted for 54.4% of total annual healthcare costs (figure 1). Inpatient care accounted for 62.7% of known spending in high-cost high-need patients (figure 1). Mean monthly cost was 22.7 times higher among high-cost high-need CYP versus all other patients (£4417.39 vs £194.65) (figure 1). Mean inpatient costs were 137.3 times higher in the high-cost high-need group (£2769.93 vs £20.18) (figure 1). Moreover, 29.0% of CYP in high-cost high-need group in 2014/2015 were classified as high-cost high-need in the following year. Males were more likely to be high-cost high-need in younger groups (380/630 (60.3%) 0–4 years) and progressively less likely to be high-cost high-need in older groups (328/1050 (31.2%) 20–24 years) (figure 2, online supplemental appendix 1).
Supplemental material

Bar graphs showing (A) total costs by area within NHS by top 5% and bottom 95% by cost; (B) mean costs per patient by area within NHS by top 5% and bottom 95% by cost. This figure was created by the authors. ED, emergency department.

Line graph showing the proportion of children and young people classified as high-cost high-need (top 5%) by age and sex. This figure was created by the authors.
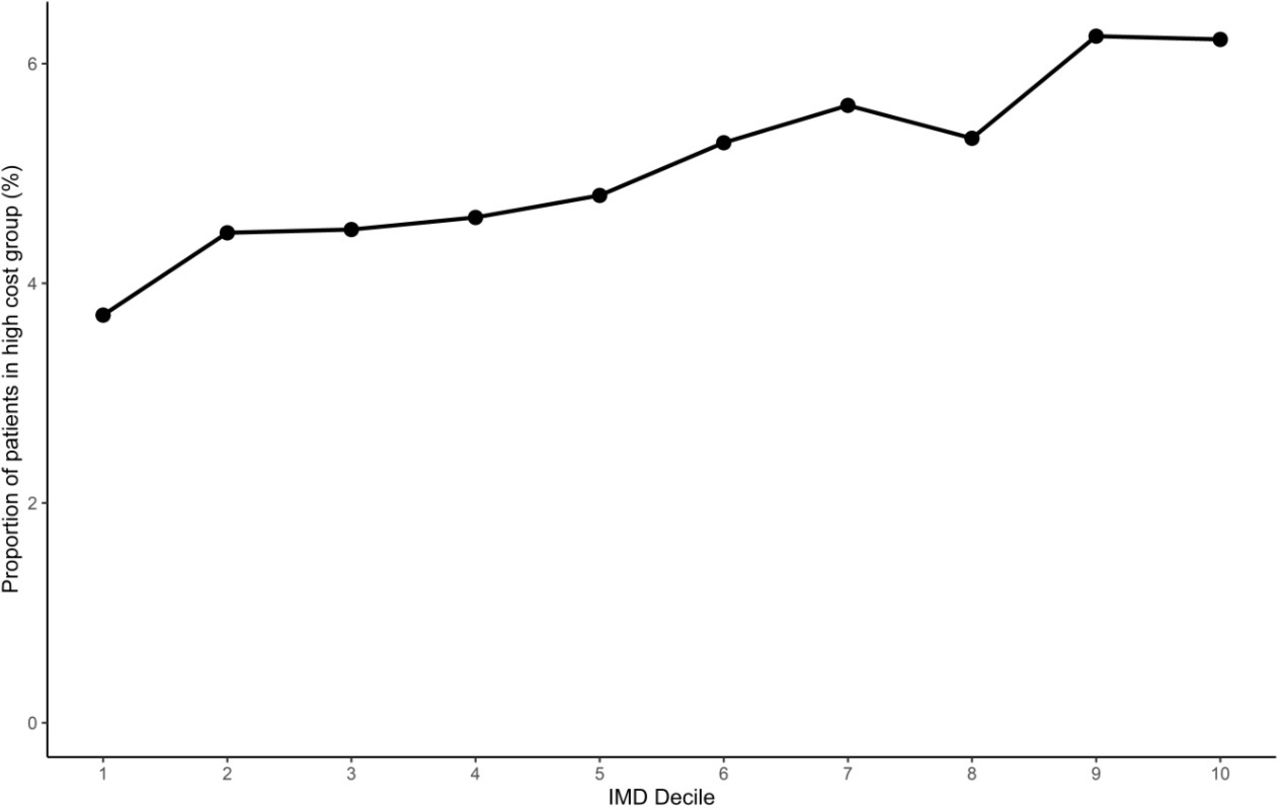
Spending was skewed towards more deprived CYP; 6.2% of CYP were classified as high-cost high-need in the most deprived decile compared with 3.8% in the least deprived decile (figure 3). The proportion of CYP in the high-cost high-need group are significantly different from one another across deprivation deciles (p<0.05). Further analysis confirmed that there is a significant linear trend across deprivation deciles with high-cost high-need CYP being over-represented in the most deprived decile (p<0.05).
Line graph showing the proportion of children and young people classified as high-cost high-need (top 5% by cost) by deprivation decile (IMD decile). This figure was created by the authors. IMD, Index of Multiple Deprivation.
Of CYP in the high-cost high-need group, just over half (50.9%) have no identified long-term conditions that require long-term clinical follow-up, while 2.5% have four or more long-term conditions (online supplemental appendix 2). The majority (97.2%) of all other patients have no recorded long-term conditions that require long-term clinical follow-up (online supplemental appendix 2). Patients in the high-cost high-need CYP group with two or more comorbidities have a mean cost of £8172.81 compared with £3159.43 for those with no comorbidities (online supplemental appendix 3).
Mental health conditions accounted for 20.5% of the high-cost high-need diagnoses during the 12-month period (table 1). However, mental health conditions were rarely the first ICD-10 code (table 1). Within the high-cost high-need group, the prevalence of mental health condition diagnoses in the year prior to analyses increased markedly with age from 6.5% of CYP aged under 5 to 39.3% in CYP aged 20–24 (online supplemental appendix 4).
Presence of specific conditions based on (1) all ICD-10 codes and (2) first ICD-10 code only recorded on admissions from April 2014 onward (1 year prior to analysis year)
Respiratory conditions, neurological conditions and metabolic conditions were also prevalent in the high-cost high-need group (table 1). The prevalence of metabolic conditions increased with age to 18.3% while the prevalence of neurological conditions decreased.
Discussion
The top 5% of CYP (high-cost high-need patients) account for more than half of annual spending for CYP, with costs largely driven by inpatient settings. The most common categories of long-term condition diagnoses in high-cost high-need group are in order: mental health, metabolic, respiratory, neurological conditions. Within the high-cost high-need group, there is a high turnover—29% of CYP who are high-cost high-need one year are high-cost high-need the following year.
This is the first study, to our knowledge, which has linked CPRD and HES/ONS data to quantify the CYP high-cost high-need group and identify areas of high spending. Socioeconomic deprivation impacts the health of children and their healthcare costs. We know there is a strong association between deprivation and the risk of death throughout childhood, with children in deprived areas more likely to die.11 This is reflected in our findings demonstrating a strong relationship between deprivation and proportion of patients in the high-cost high-need group, revealing a distinct social gradient which is steeper than the gradient seen in adults.2
The proportion of children in the high-cost high-need group varied by age: the highest was seen in males aged under 5 and females aged between 20 and 24. The diagnoses, as expected, differ significantly between age groups and comorbidities were common in the high-cost high-need CYP group. For example, mental health conditions were common in older age groups although were rarely the primary diagnosis in an admission. Similarly, extremely pre-term neonates are often high-cost high-need due to requiring longer-term intensive care and frequently have multiple comorbidities including neurological and respiratory problems. As expected, having an increased number of comorbidities was linked to a higher mean cost.
Some limitations of this study include being unable to include all costs. This study only includes costs associated with primary and secondary care and does not capture all cost associated with healthcare. In particular, this study does not include costs associated with community care, some specialist mental healthcare services, specialised drugs and social care. The impact of this is that we may be underestimating the true costs as we are unable to capture the costs of care delivered in these other settings. We used ICD-10 codes on admission records to identify long-term conditions and only identified long-term conditions that required clinical follow-up for more than a year in at least half of cases. This will not capture any conditions that a CYP may have been treated for in other settings and will not include acute conditions with shorter follow-up periods. It is likely that the proportion of CYP in the all other patients group with a chronic condition is underestimated due to a reduced likelihood of admission. ICD-10 coding of hospital episodes is captured by coders, which may be incomplete and inaccurate. However, HES data are extensively used in similar research. Moreover, recording some conditions more often could be influenced by payment practice in the hospital. It was not possible to determine whether costs of care were appropriate for a given level of patient need.
Clinical and policy implications and areas for further research
The NHS’s long-term plan has encouraged clinicians to re-think care delivery for CYP aged 0–24, focusing on better outcomes, a better experience and lower costs. This study allows further quantification of spending in high-cost high-need CYP highlighting areas of high spending by age and condition where approaches to improving efficiency and perhaps reducing long-term costs could be targeted. For example, the high prevalence of comorbid mental health conditions and increased spending in the most deprived areas on high-cost high-need admissions warrants further investigation.
In adult populations, there is a strong association between high medical expenditure and proximity to death.4 12 Current age-specific mortality for England and Wales is 369 per 100 000 for infants, and vary between 6 and 34 per 100 000 for children aged 1–18 years.13 Hence, a small number, approximately 0.1%–0.2%, of children will die in any given year.13 Therefore, even if some of those CYP who died were from the high-cost high-need group, this would be a low proportion of the high-cost high-need group overall and be different to the adult cohort. Further work is needed to understand this relationship in CYP populations.
In this study, we found that costs are not sustained year on year and that 29% of high-cost high-need CYP were still high-cost high-need in the following year. In CYP, some high-cost high-need individuals required expensive treatment, for example, mental health stays, neonatal intensive care unit stays and cancer treatments, which they do not necessarily require the following year. The most common causes of death by age group are 1–4 years old: cancer, accidents, congenital conditions; 5–9 years old: cancer, respiratory causes, accidents; 10–24 years old: external preventable causes which included intentional self-harm, cancer.11 14 This demonstrates that some CYP do not have a pre-existing long-term condition and are high-cost high-need, for example, accidents, external preventable causes (including intentional self-harm) and hence this could potentially account for the high turnover seen in CYP where costs are not sustained year on year for any single individual. This highlights an opportunity for certain treatments in the CYP population to improve quality of life and reduce spending in future years.
This study is a novel study which raises questions for future research priorities. It also highlights the need to invest further in linked datasets, such as CPRD, to include other linkages such as the Mental Health Services Data Set, Community Services Data Set, as well as education data sets and youth justice system datasets. These linkages would enable CYP to be tracked across different settings and for their needs to be analysed holistically.
Further research into particular groups of CYP and conditions is necessary. In particular, key groups of interest are vulnerable CYP, including Looked After Children, and CYP with special educational needs with one or more long-term condition. Further work into key conditions within the mental health category, especially for females aged 20–25 years, including conditions such as eating disorders, is important especially as in-patient Child and Adolescent Mental Health Services (CAMHS) admissions are very expensive, costing up to £285 000 annual operating costs for a secure CAMHS bed.15 Further research on which mental health conditions are high-cost high-need would be helpful to inform thought processes relating to what can be done in practice by way of prevention and cost reduction. Moreover, research into use of maternity services is pertinent to improve our understanding of demands on these services and target investment accordingly. Looking closer at metabolic conditions in CYP, these would include common conditions such as obesity, which are primarily managed by general practitioners, especially for less severe cases, and hence likely not incurring inpatient costs captured by this study. The National Paediatric Diabetes Audit identified 790 patients with type 2 DM out of over 30 000 patients with diabetes in total.16 The prevalence of both type 1 and other forms of diabetes also increases with age.16 Hence, the majority of endocrine spending is likely to be on type 1 DM. In regard to obesity, we know poor coding can lead to underestimation of this group. It is possible that a small number of patients having bariatric surgery may have been included in the high-cost high-need group.
Furthermore, further research to improve ascertainment of long-term conditions and to link this data with population health management system tools would allow for identification of CYP in the community setting with the greatest need with the aim of targeting these individuals and reducing hospital admissions.
Further studies alongside our findings may support national and local initiatives to develop more integrated care for high-cost high-need CYP, which both prevent and shorten inpatient admissions. In turn, this may free up much needed funds for investment in preventive and early intervention services, addressing deprivation and inequality and focusing on mental health.
Data availability statement
Data may be obtained from a third party and are not publicly available.
Ethics statements
Patient consent for publication
Acknowledgments
We would like to acknowledge support from the National Institute for Health Research (NIHR) through the National School for Public Health Research Programme and the Applied Health Research (ARC) programme for North West London.
Supplementary materials
Supplementary Data
This web only file has been produced by the BMJ Publishing Group from an electronic file supplied by the author(s) and has not been edited for content.
Footnotes
NP and KM are joint first authors.
Twitter @shahrakhee
Contributors NP and KD contributed equally to this manuscript.
Funding This work was supported by the Health Foundation, an independent charity, as part of the core activity by staff members. KD and SD had full access to the data.
Disclaimer This work uses data provided by patients and collected by the NHS as part of their care and support. The views expressed in this publication are those of the authors and not necessarily those of the funding bodies or institutions mentioned.
Competing interests None declared.
Provenance and peer review Not commissioned; externally peer reviewed.
Supplemental material This content has been supplied by the author(s). It has not been vetted by BMJ Publishing Group Limited (BMJ) and may not have been peer-reviewed. Any opinions or recommendations discussed are solely those of the author(s) and are not endorsed by BMJ. BMJ disclaims all liability and responsibility arising from any reliance placed on the content. Where the content includes any translated material, BMJ does not warrant the accuracy and reliability of the translations (including but not limited to local regulations, clinical guidelines, terminology, drug names and drug dosages), and is not responsible for any error and/or omissions arising from translation and adaptation or otherwise.