Article Text

Abstract
Objectives We used national data to study differences in academic achievement between 5-year-old children with an isolated oral cleft and the general population. We also assessed differences by cleft type.
Methods Children born in England with an oral cleft were identified in a national cleft registry. Their records were linked to databases of hospital admissions (to identify additional anomalies) and educational outcomes. Z-scores (signed number of SD actual score is above national average) were calculated to make outcome scores comparable across school years and across six assessed areas (personal development, communication and language, maths, knowledge of world, physical development andcreative development).
Results 2802 children without additional anomalies, 5 years old between 2006 and 2012, were included. Academic achievement was significantly below national average for all six assessed areas with z-scores ranging from −0.24 (95% CI −0.32 to −0.16) for knowledge of world to −0.31 (−0.38 to −0.23) for personal development. Differences were small with only a cleft lip but considerably larger with clefts involving the palate. 29.4% of children were documented as having special education needs (national rate 9.7%), which varied according to cleft type from 13.2% with cleft lip to 47.6% with bilateral cleft lip and palate.
Conclusions Compared with national average, 5-year-old children with an isolated oral cleft, especially those involving the palate, have significantly poorer academic achievement across all areas of learning. These outcomes reflect results of modern surgical techniques and multidisciplinary approach. Children with a cleft may benefit from extra academic support when starting school.
- congenital abnorm
- isolated oral cleft
- educational outcomes
This is an Open Access article distributed in accordance with the Creative Commons Attribution Non Commercial (CC BY-NC 4.0) license, which permits others to distribute, remix, adapt, build upon this work non-commercially, and license their derivative works on different terms, provided the original work is properly cited and the use is non-commercial. See: http://creativecommons.org/licenses/by-nc/4.0/
Statistics from Altmetric.com
What is already known?
Children with isolated oral clefts tend to have poorer educational outcomes than unaffected children.
The reported size of the educational gap is variable, and reported differences in academic achievement between cleft types are inconsistent.
What this study adds?
Compared to the general population in England, 5-year-olds with isolated clefts, especially those involving the palate, have significantly lower academic achievement scores and higher rates of special educational needs.
Early educational interventions may benefit children with isolated oral clefts.
Introduction
Craniofacial abnormalities are among the most common of all birth defects.1 In England, about 900 children a year are born alive with a cleft lip (CL) and/or cleft palate (CP).2 A cleft can affect hearing,3 4 speech and language,5 6 dental health7 8 and psychosocial health.9 Children with a cleft may experience cognitive dysfunction,10–13 learning difficulties14 15 and lower levels of school achievement.15–19
Previous studies have explored the impact of the effect of oral clefts on school attainment in a range of populations varying in year of birth, age and type of educational outcome. Most of these studies were small and they reported inconsistent findings with respect to the overall impact of oral cleft and the specific impact of different cleft types.15–19 By far the largest study to date presents the school attainment at the age of 16 years for 1992 individuals born with an oral cleft between 1973 and 1986 in Sweden.17 This study found that individuals with a cleft involving the palate were more likely not to receive their leaving certificate than the general school population, while there were no differences for individuals with a CL and no involvement of the palate.
The other studies, all carried out in the USA, present various school attainment outcomes in relatively small cohorts (with the largest study including 112 individuals with a cleft)15 16 19 or in a larger cohort (including 588 individuals with cleft) created by including individuals born over a 20-year period (between 1983 and 2003).18 The smaller studies did not explore the impact of cleft type on outcomes,15 16 19 whereas the larger study found very similar results, irrespective of whether or not the palate was involved.18
In England, the outcomes for children born with an oral cleft have gradually improved over the last two decades partly as the result of the further development of surgical techniques, the implementation of a multidisciplinary approach and the centralisation of cleft services.20 21 It is likely that similar improvements took place in many other countries.
To address the lack of information on school attainment in children whose cleft treatment most likely reflects current cleft care practice, we identified the records of children born with an oral cleft in England between 2001 and 2007 in a national clinical database and linked these to records of a national database of educational outcomes for all pupils in state schools in England. In this way, we could determine the differences in early school attainment between children with a cleft and the general population. The cohort that we created was also large enough to study whether there are differences in attainment between children with different cleft types.
Methods
Study cohort, databases and record linkage
The study cohort was identified in the Cleft Registry and Audit Network (CRANE) database. CRANE collects information on all children born with an oral cleft in England, Wales and Northern Ireland (www.crane-database.org.uk). A total of 4587 children born in England who were 5 years old between 1 September 2006 and 31 August 2012 and whose parents had given consent for their records to be included in the CRANE database were eligible for linkage to the Hospital Episode Statistics (HES) database and the National Pupil Database (NPD) (see figure 1). Given that about 900 children are born with an oral cleft in England each year,2 22 about 85% could be considered for inclusion in this study.
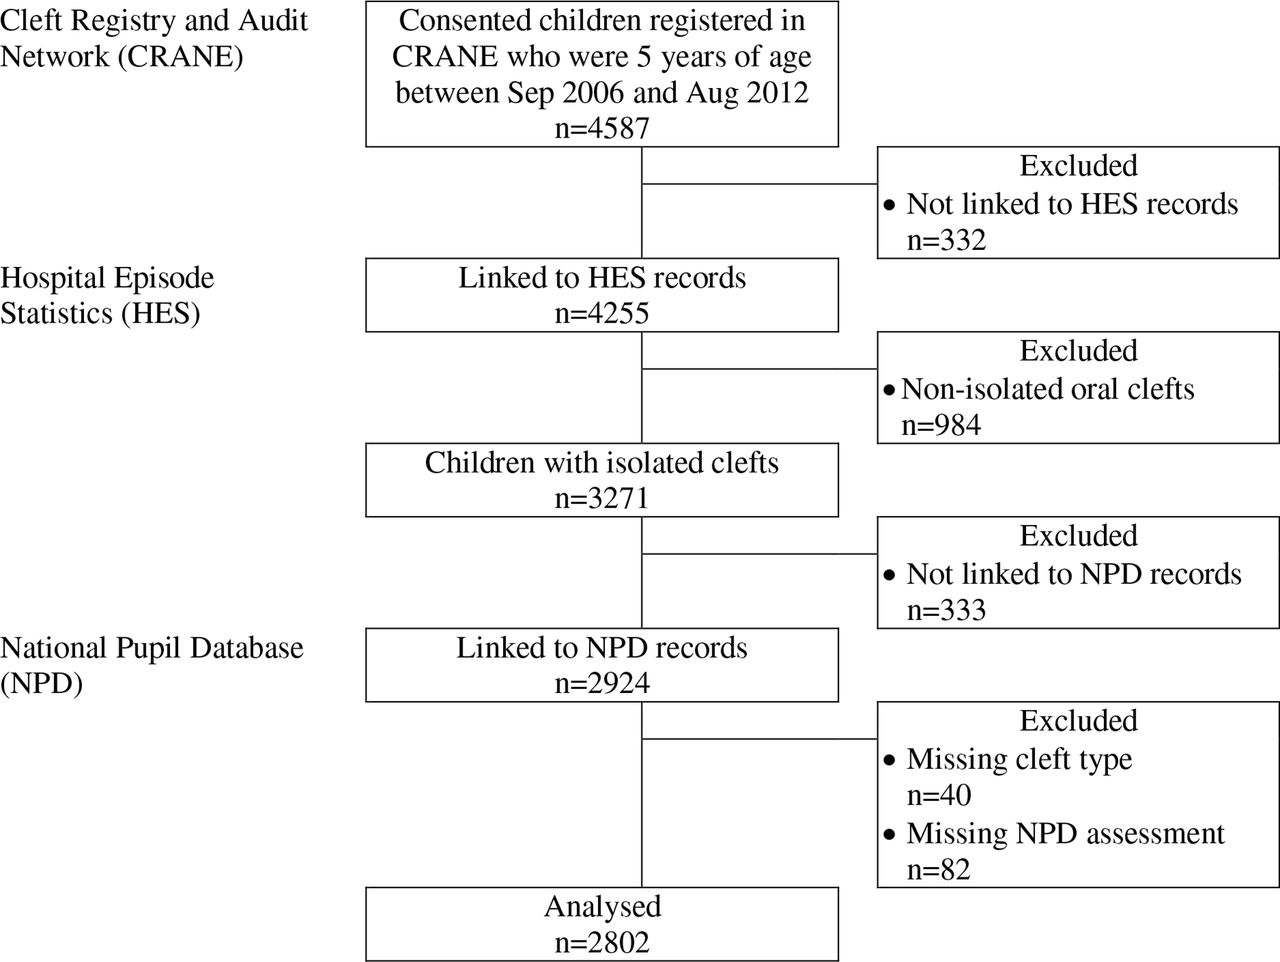
Identification of study cohort.
Of the 4587 identified children with an oral cleft, 4255 (92.8%) had a linked record in HES, which at the time of analyses contained records on all admissions to National Health Service (NHS) hospitals in England up to 31 March 2015. The NHS is a state-funded healthcare system which treats practically all children born with a cleft in England. Linkage to HES was used to exclude 984 of the 4255 children with a linked HES record (23.1%) because they were identified as having additional anomalies or syndromes (ie, a non-isolated cleft) based on the presence of 33 specific International Classification of Diseases, 10th edition (ICD-10) diagnostic codes (see online Supplementary file 1) representing congenital malformations and chromosomal abnormalities in any of the diagnosis code fields of their HES records.
Supplementary file 1
Of the remaining 3271 children with an isolated cleft, 2924 (89.4%) had a linked record in the NPD.23 The NPD is a national database containing records on educational outcomes for all pupils of state schools in England from the 1995/1996 school year onwards. Between the 2006/2007 and 2011/2012 school years, the NPD contained the teacher-assessed the Early Years Foundation Stage Profile (EYFSP), collected for all children in the school year that they turned 5 years of age.
A further 122 children were excluded because we did not have information on cleft type (n=40) or the EYFSP scores (n=82). As a result, the linked CRANE–HES–NPD records of 2802 children were available for analysis.
Ethics
The study is exempt from NHS Health Research Authority ethics approval as it involves the analysis of an existing anonymised dataset that is collected for the purpose of service evaluation.24
Patient characteristics
Cleft type was categorised into four groups: CL), CP, unilateral CL and palate (UCLP) and bilateral CL and palate (BCLP).
Indicators of deprivation were obtained from NPD records. The Income Deprivation Affecting Children Index (IDACI) is an index of socioeconomic deprivation that is calculated for small areas (mean population about 1500) as the proportion of children under the age of 16 that live in low income households. National IDACI quintiles divide the areas into five roughly equal sized groups.25 Eligibility for free school meals is another indicator of the economic circumstances of the pupil’s family.26 Data on ethnicity was taken from NPD records as was whether or not pupils had special educational needs (SEN).
School attainment
The EYFSP consists of 13 assessment scales with a maximum of nine points within each scale and a score of ≥6 is the expected standard. These 13 scores are combined into mean scores representing six areas of learning (see table 1). We included children for whom we had EYFSP scores obtained between the school years of 2006/2007 and 2011/2012, because the EYFSP assessment changed significantly in 2012/2013.
The Early Years Foundation Stage Profile
Statistical analyses
Between 2006/2007 and 2011/2012, national mean EYFSP results have improved each year.27 To account for this trend and for potential inconsistencies over time in scoring, z-scores were calculated for each assessment scale and area of learning within each assessment year using national population means and SD. Z-scores also allow a comparison of the effect that oral clefts have across the six areas of learning. A z-score represents the signed number of SD by which the child’s actual score is above the national average.27 The SD within the national distributions for all six areas of learning fluctuated between 1.3 (physical development) and 1.8 (communication, language and literacy) which indicates that a difference of 1 between z-scores roughly corresponds to a difference of 1.5 points on the original 9-point scales. A negative z-score indicates that the score is below the national average. The primary outcomes were the mean z-scores combining all six school years for each of the six areas of learning.
Multivariable linear regression was used to examine the effect of cleft type on the z-scores. The model included IDACI quintile and free school meal eligibility as measures of economic deprivation, ethnicity coded as ‘white’ or ‘other’ (including ‘any other ethnic group’, ‘Asian’, ‘Black’, ‘Chinese’ ‘mixed’ and ‘unclassified’) and sex. Likelihood ratio tests were used to determine the significance of each covariate in the regression model. All statistical calculations were performed in Stata 14 (Statacorp, College Station, Texas, USA).
Results
Table 2 presents the characteristics of the 2802 included children with an isolated oral cleft. About 1 in 3 had a CP, 1 in 4 a CL), another 1 in 4 a UCLP and 1 in 10 a BCLP. Table 2 also demonstrates that more boys (58.7%) than girls (41.3%) were included, which is to be expected in a cleft population, and that children in the most deprived national IDACI quintile were over-represented (with 24.5%) and those in the least deprived quintile under-represented (with 14.8%) given that per definition 20% of children should be in each IDACI quintile. This discrepancy is to be expected as only state schools report data to NPD and the IDACI distribution observed for the included group of children with an isolated oral cleft closely matches the national distribution.28
Characteristics of the included 2802 5-year-old children with an isolated oral cleft
School attainment
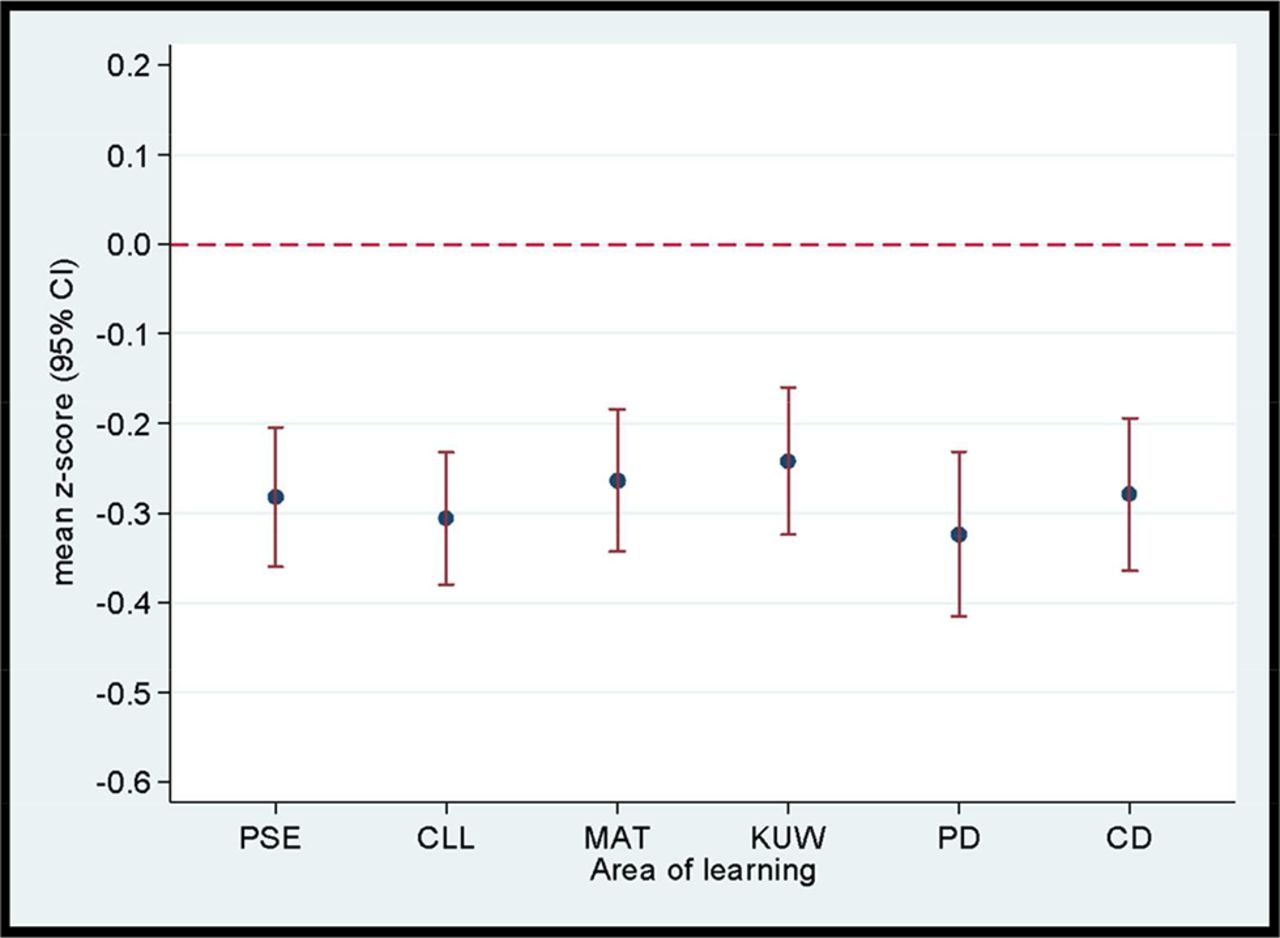
Children with an isolated oral cleft had z-scores that were significantly below the national average across all six assessed areas of learning (figure 2). The z-scores for the six areas of learning varied around −0.3, which roughly corresponds to differences of between −0.4 and −0.5 points below the national average on the original 9-point scales.

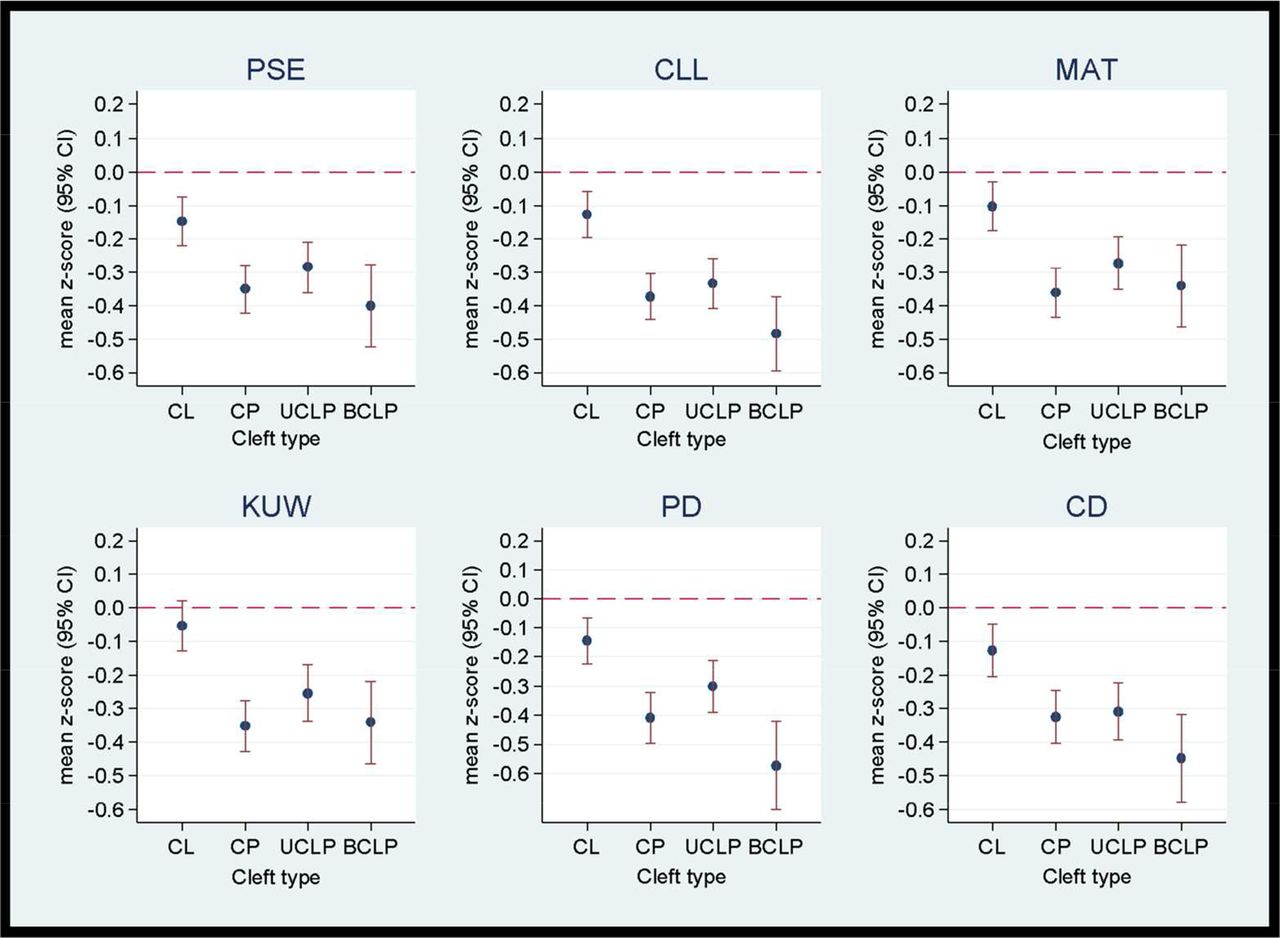
Mean z-scores and 95% CIs for each area of learning at 5 years of age in children with an isolated cleft compared with the general population mean. See the text for further explanation. CD, creative development; CLL, communication, language and literacy; KUW, knowledge and understanding of the world; MAT, mathematical development; PD, physical development; PSE, personal, social and emotional development.
The z-scores for the six areas of learning varied according to cleft impact (p always <0.001). Figure 3 demonstrates that children with CL had better z-scores (varying around −0.1 for all six areas) than children with (figure 3) a cleft affecting the palate (varying between −0.3 and −0.5). Children with CL had z-scores that were not statistically significant (p>0.05) from the general population mean in the knowledge and understanding of the world area.
Mean z-scores and 95% CIs according to each area of learning at 5 years of age according to cleft type and compared with the general population mean. See the text for further explanation. BCLP, bilateral cleft lip and palate; CD, creative development; CL, cleft lip; CLL, communication, language and literacy; CP, cleft palate; KUW, knowledge and understanding of the world; MAT, mathematical development; PD, physical development; PSE, personal, social and emotional development; UCLP, unilateral cleft lip and palate.
The results of the linear regression analyses confirm that the effect of cleft types that involves the palate was considerably larger than that of clefts that only involves the lip (table 3). Adjusted for socioeconomic deprivation, free school meals, ethnicity and sex, differences in z-scores between children with a CL and those with a cleft involving the palate vary between 0.2 and 0.4 across the six areas of learning.
Results of multivariable linear regression analyses of effect of cleft type on the z-scores for the six assessed areas of learning of the Early Years Foundation Stage Profile (difference compared with CL with 95% CI)
The effects observed for the other factors included in the linear regression models can be used to appreciate the size of the effect of an isolated oral cleft on school attainment. For example, differences in z-scores between the least and most socioeconomically deprived IDACI quintile vary between 0.5 and 0.7 across the six areas. These differences are about twice as large as the overall effect of a cleft involving the palate. Differences in z-scores between children who are and who are not entitled to free school meals are of similar size as the effect of a cleft involving the palate. Table 3 also shows that scores for boys are typically lower than for girls across all areas of learning with the greatest differences being seen in physical development and creative development.
Special educational needs
The SEN status was documented for 2769 of the 2802 included children (98.8%). Of these 2769 children, 815 (29.4%) were identified as having SEN at 5 years of age. The proportion of children with SEN varied according to cleft type. Children with CL were least likely to have SEN (13.2%), whereas SEN were documented in 33.1% of children with CP, in 34.1% with UCLP and in 47.6% with BCLP. Among children with SEN identified, 565 (66.6%) had the type of SEN specified and 105 (18.6%) of these had more than one type of SEN recorded. Speech, language and communication needs was the most commonly documented type of SEN, which was specified for almost three-quarters of those children for whom a SEN type was documented (table 4).
The frequency (number and percentage) of specific types of SEN in the 565 children with a documented special educational need*
Discussion
This English population-based study demonstrates that academic achievement of 5-year-old children born between 2001 and 2007 with an oral cleft but without additional anomalies or syndromes is below the national average for all six assessed areas of learning. The differences were relatively small for children with a CL but substantially larger for children who have a cleft that involved the palate. The effect of an isolated oral cleft is similar across all assessed areas and therefore not limited to communication, language and literacy.
Another important finding from our study is that 29.7% of children with an isolated oral cleft were identified as having SEN which is about three times higher than the national rate of 9.7% among 5 years old in England during the same time frame.27 Again, differences were relatively small for children with a CL but larger for children with a cleft involving the palate.
Only one other study has examined academic attainment among a cleft population at a national level.17 A Swedish study of school outcomes of 1992 16-year-old children found that compared with the general population individuals with a cleft had lower grade point averages and higher odds of not receiving a school leaving certificate. However, this study included individuals born between 1973 and 1986 and their academic outcomes may not reflect those that can be achieved by current cleft care.20 21
The largest study carried out in Iowa included 588 children between 1983 and 2003 with an isolated cleft. Their academic outcomes between 7 and 17 years were significantly lower in all subject areas compared with classmates.18 This study did not find statistically significant differences between cleft types. A related study, including 256 children of this Iowa cohort, found no significant differences in academic achievement scores compared with 387 unaffected siblings.29 The researchers suggest that exposures shared by the affected and the unaffected siblings, such as a ‘genetic vulnerability to learning problems’ and the family environment, may explain the lack of differences.
A much smaller study carried out in the USA found no significant differences in early language and reading skills between 57 children with an oral cleft and 77 controls.30 Apart from lack of statistical power, the authors suggest as a possible explanation for the lack of differences that up to half of all children with a cleft had received speech interventions. In England, a large proportion of children with a cleft involving the palate receive speech and language therapy prior to starting school. Our findings show that, in spite of this, a significant attainment gap exists between those with a cleft and the general population.
A major strength of our study is the use of a national population-based sample, including 2802 children who represent about two thirds of the total eligible population. The registration of children with a cleft in the CRANE database strongly depends on the cleft centre where the children received their cleft care rather than on particular patient characteristics.22 Also, parental consent rate for registration is very high (around 98%). All this indicates that our results are nationally representative.
Another strength of our study is that it consisted solely of children in the first year of the English state school system. Further follow-up will allow us to explore whether attainment gaps narrow or broaden as children progress through the school system. Nearly all other studies reporting educational outcomes in children with an oral cleft are based on samples of children including a wide age range.
A limitation of our study is that the identification of children with additional anomalies or syndromes was based on the presence of certain ICD-10 codes, including those representing DiGeorge syndrome and Pierre-Robin syndrome in the children’s hospital records. It is possible that some children included in our analyses had additional conditions that were not in our prespecified list of diagnoses, which for example may include prenatal exposure to valproate. However, we feel that only very few children with additional conditions will be included because we checked the records of all hospital episodes in their first 5 years of life.
A further limiting factor is that academic attainment was based on teacher assessment.31 Future work will examine the impact of a cleft on externally assessed exams at later years, which will overcome the potential limitation of teacher assessment bias.
Conclusions
Children with isolated oral clefts, especially those that involve the palate, have significantly poorer academic achievement results across all assessed areas of learning and they are more frequently documented as having SEN than the general school population.
These academic differences already exist at the start of the school system when the children are just 5 years old, which demonstrates that early educational interventions may be of benefit. All children were born after August 2001 and their cleft-related outcomes largely reflect those that can be achieved with the use of modern surgical techniques and a well-coordinated multidisciplinary team approach.
Acknowledgments
HES data were made available by the NHS Health and Social Care Information Centre (©2012, reused with permission of the Health and Social Care Information Centre. All rights reserved).
References
Footnotes
Handling editor Martin Ward Platt
Contributors KJF: conceptualised and designed the study, carried out the analyses and interpretation of data, drafted the initial manuscript, revised the manuscript, approved the final manuscript as submitted and agreed to be accountable for all aspects of the work. JHvdM and SAD: conceptualised and designed the study, reviewed and edited the manuscript, approved the final manuscript as submitted and agreed to be accountable for all aspects of the work. LPC: conceptualised and designed the study, coordinated and managed the data collection from the three datasets, processed the Hospital Episode Statistics data, commented on the initial manuscript, approved the final manuscript as submitted and agreed to be accountable for all aspects of the work. LD: critically reviewed the manuscript, approved the final manuscript as submitted and agreed to be accountable for all aspects of the work. ES: carried out the dataset linkage rate analyses, commented on the initial manuscript, approved the final manuscript as submitted and agreed to be accountable for all aspects of the work. SCC: assisted in the statistical analyses of the data, commented on the initial manuscript, approved the final manuscript as submitted and agreed to be accountable for all aspects of the work.
Funding This work was funded by the National Specialised Commissioning Group for England and the Wales Specialised Health Services Committee and was carried out by the team of the CRANE database (the National Cleft Database of England, Wales, and Northern Ireland), which is overseen by the UK NHS Cleft Development Group. The funders did not have a role in in study design; in the collection, analysis, and interpretation of data; in the writing of the report; and in the decision to submit the paper for publication. JvdM is partly supported by the National Institute for Health Research Collaboration for Leadership in Applied Health Research and Care North Thames at Bart’s Health NHS Trust.
Provenance and peer review Not commissioned; externally peer reviewed.
Data sharing statement The study cohort was identified in the Cleft Registry and Audit Network (CRANE) database. CRANE records were linked to Hospital Episode Statistics and National Pupil Database. Data can be shared if approval has been obtained from the owners of these three databases.