Article Text

Abstract
Over the last ten years there has been a steady rise in short paediatric admissions. This is likely to be multi-factorial but is in part attributed to the introduction of the four hour Emergency Department (ED) target and changes in primary care provision. Head injury is the most common paediatric injury presentation. The National Institute for Health and Care Excellence (NICE) published guidance for head injury management in 2003 and 2007. Both prioritised early definitive diagnosis by early brain imaging although paediatric practice often includes a period of observation. We aimed to establish whether introduction of national guidance resulted in significant change of death or admission rates.
Methods A retrospective observational study of admissions and deaths due to paediatric head injury between 2000 and 2012 was performed using Hospital Episode Statistics and Office for National Statistics publications.
Results See Figures 1-3.
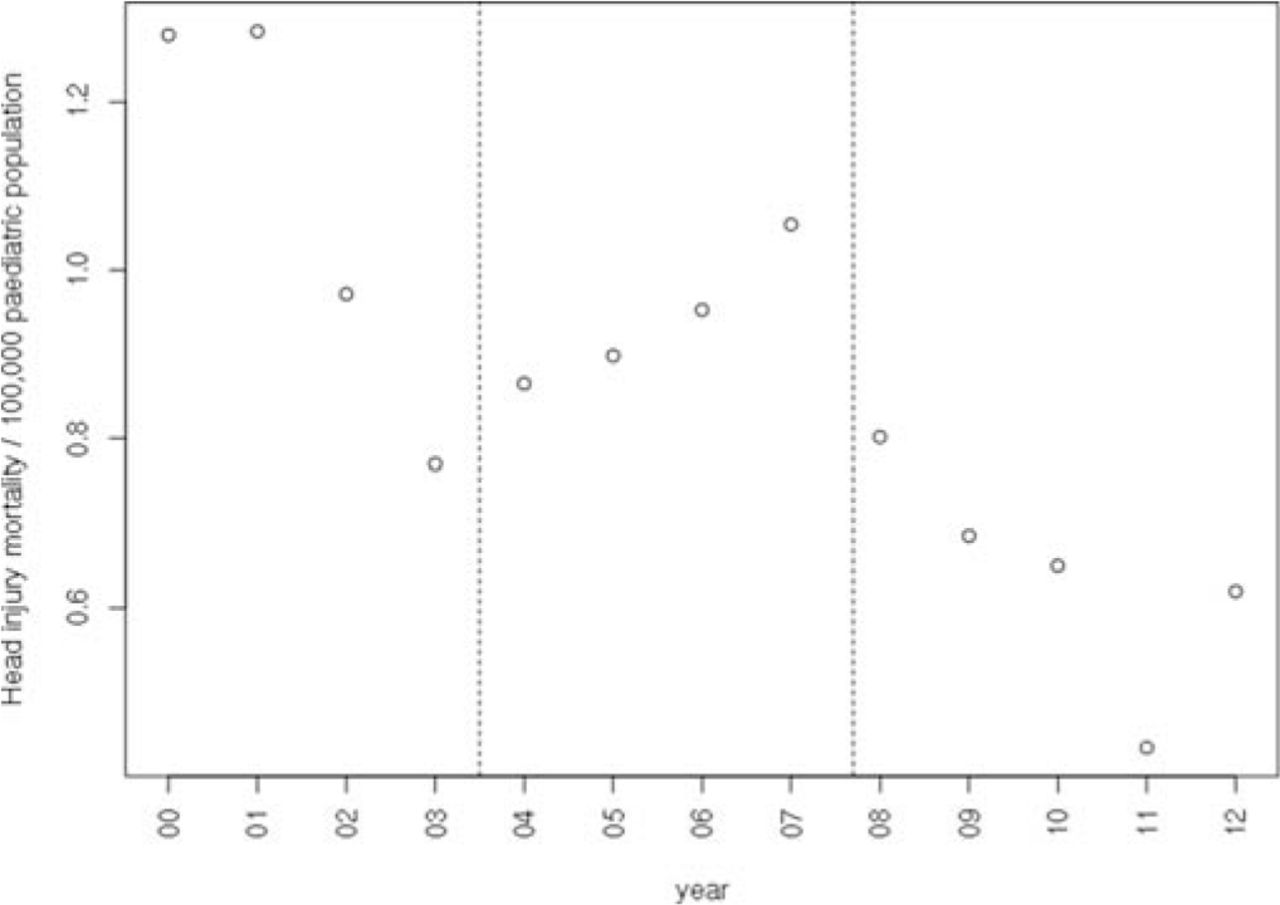
Correcting for changes in population size, per 100,00 children aged 0–14 years there is a downward trend in mortality (Figure 1) (R2 = 0.7 p < 0.001) but an upward trend in admission rates (Figure 2) (R2 = 0.3 p = 0.05). Admission rates for paediatric head injury as a percentage of all admissions decreased (Figure 3) (R2 = 0.65 p < 0.001).

Annual number of head injury admissions per 100 000 paediatric population 2000–2012.

Percentage of paediatric admissions due to head injury (HI) 2000–2012.
Annual number of head injury deaths per 100 000 paediatric population 2000–2012.
Conclusion We have found statistically significant changes in rates of death and admission due to paediatric head injury over this time period. However even accounting for implementation delays, the trends that we have demonstrated do not directly correlate with the timings of national guidance, ED targets or changes to primary care provision. For a more complete understanding of the impact of the guidelines this analysis should now be expanded to incorporate ED attendance rates and length of stay. However these existing data provide a useful benchmark against which to compare the effect of the 2014 update to NICE guidance.