Article Text

Abstract
Objective Cerebral oedema is a potentially devastating complication of diabetic ketoacidosis (DKA). The relationship between osmolar changes, acid–base changes and development of cerebral oedema during therapy is unclear.
Design Retrospective cohort study on 53 children with severe DKA (mean pH at presentation 6.92±0.08). Cerebral oedema was diagnosed using neurological status, response to osmotherapy, and neuroimaging, and classified as: early (occurring ≤1 h after presentation, n=15), late (1–48 h, n=17) or absent (controls, n=21). The temporal profiles for various osmolar and acid–base profiles were examined using a random coefficients fractional polynomial mixed model, adjusted for known risk factors.
Results The three groups could not be differentiated by demographic, osmolar or acid–base variables at presentation. All osmolar and acid–base variables showed non-linear temporal trajectories. Children who developed late onset oedema showed dramatically different temporal profiles for effective osmolality and glucose-corrected serum sodium (both p<0.001). Glucose-corrected sodium provided better qualitative discrimination, in that it typically fell in children who developed late oedema and rose in controls. The maximum between-group difference for both variables approximated the median time of clinical cerebral oedema onset. Blood glucose and acid–base temporal profiles did not differ between the groups. Late onset oedema patients received more fluid in the first 4 h, but this did not influence the osmolar or glucose-corrected sodium trajectories in a predictable fashion.
Conclusions Glucose-corrected serum sodium may prove a useful early warning for the development of cerebral oedema in DKA.
Statistics from Altmetric.com
Introduction
Diabetic ketoacidosis (DKA) is common in children, occurring in up to 10% of diabetic patients per year.1 Cerebral oedema is a potentially devastating complication, accounting for 80% of all diabetic in-hospital deaths.2 The incidence of clinically apparent cerebral oedema is 0.9%, with an associated mortality of 22%, and 29% of survivors suffering neurological sequelae.3,–,5 The incidence of subclinical cerebral oedema is considerably higher; MRI studies have shown that up to 54% of children manifest ventricular narrowing and/or diffusion abnormalities consistent with oedema.6 7
What is already known on this topic
During the treatment of diabetic ketoacidosis (DKA):
▶ changes in blood osmolality and excessive early fluid administration have been linked to development of cerebral oedema.
What this study adds
During the treatment of DKA:
▶ A failure of the glucose-corrected serum sodium to rise may have value as an early warning sign of cerebral oedema.
▶ Patients who develop cerebral oedema do not manifest different acid–base temporal profiles compared to those who do not.
▶ Although patients who develop cerebral oedema generally receive more fluid in the first 4 h of treatment, this does not influence the temporal profile of the glucose-corrected sodium or effective osmolality in a predictable fashion.
The aetiology of cerebral oedema is unclear.8 Several risk factors have been identified; some relate to disease severity at presentation and others are associated with therapy.1 Changes in blood osmolality and its components (sodium, glucose, urea) during treatment have been highlighted as potential risk factors.3 5 9,–,19 Of these, serum sodium is the most important extracellular osmole influencing intracellular volume (and hence cerebral oedema).20 Unfortunately, interpretation of this electrolyte is confounded by changes in blood glucose. In the setting of hyperglycaemia, extracellular osmolality rises, resulting in movement of water from the intracellular to the extracellular space with subsequent dilution of serum sodium.20 When insulin therapy is commenced, glucose moves from the extracellular to the intracellular space, producing two consequences: (1) a fall in serum glucose and (2) a rise in sodium. These opposing concentration changes do not occur in an equimolar fashion; sodium typically rises less than glucose falls.21 An attenuated rise in serum sodium, producing a greater than expected fall in osmolality, can thus be easily missed at the bedside. This phenomenon may be better quantified by calculating the glucose-corrected serum sodium.21 This represents the expected sodium concentration in the absence of hyperglycaemia. If, during treatment of DKA, the rise in sodium and the fall in glucose are ‘as expected’, the glucose-corrected sodium should stay the same. Conversely, excessive falls in osmolality will be reflected by a fall in the corrected sodium. Surprisingly, this variable has not been extensively investigated in the setting of DKA.
We have evaluated the association between osmolar changes (including glucose-corrected sodium) and development of clinically apparent cerebral oedema in a cohort of children with severe DKA. After adjustment for known risk factors, we wished to see if the trajectory of these variables could discriminate between children who did and did not develop cerebral oedema. As the trajectories were likely to be non-linear, we modelled them by combining two statistical techniques: (1) a random coefficients, linear mixed model; (2) with the effect of time modelled using fractional polynomials. Our primary hypothesis was that the trajectory of glucose-corrected sodium would provide an early marker for development of cerebral oedema.
Methods
The study was approved by our local research ethics committee, who waived the need for informed consent.
Study subjects
We identified retrospectively 53 children referred to our regional paediatric intensive care unit (PICU) between January 2003 and December 2007.22 DKA was defined as the presence of blood glucose greater than 11 mmol/l (200 mg/dl), venous pH <7.3 or bicarbonate <15 mmol/l and the presence of ketonaemia/ketonuria.1 23
Definition of study and control groups
Cerebral oedema was classified on the basis of neurological status, neuroimaging and response to osmotherapy.3 Neurological status was assessed from the notes using Marcin's score: a five-point, ordinal scale developed for use in DKA (table 1).16 Cerebral oedema was defined as a Marcin score ≥3, in the absence of other possible causes (eg, sepsis, intracranial pathology), and either an improvement in the Marcin score with osmotherapy or radiological evidence of oedema.
Marcin symptom score for neurological status in diabetic ketoacidosis (from Marcin et al16)
We classified patients into three groups: (1) early oedema, occurring within 1 h of hospital presentation, (2) late oedema, occurring between 1 and 48 h after presentation and (3) controls, in whom neurological abnormalities were mild or absent (Marcin score <3).
Two reviewers (AD, IAM) calculated sequential Marcin scores independently for each patient; both were blinded to the biochemical variables and fluid therapy. In episodes where the Marcin scores did not agree (seven episodes, four patients), two other investigators (SMT, DT) repeated the process. We stipulated a priori that a Marcin score would be designated only where three investigators' scores agreed; this occurred in all seven episodes.
Data collection
The following data were recorded by one investigator (LPF), from time of presentation to the referring hospital until discharge from the PICU: demographics, treatment, biochemical and acid–base variables and neuroimaging (if performed). Data were abstracted directly from the notes and the hospitals' laboratory reporting systems. As both venous and arterial blood gases were measured, values were expressed in arterial terms using the conversion factors:24 25
Arterial pH = venous pH + 0.05
Arterial HCO3 = venous HCO3 −1.9 mmol/1
Arterial partial pressure of carbon dioxide (PCO2) was then calculated via the Henderson–Hasselbalch equation.
Calculated biochemical values utilised the following formulae3 19 21. Units are mmol/kg H2O for effective osmolality and mmol/l elsewhere.


The median (IQR) number of biochemical measurements made per patient was 7 (6–8). These were evenly spread over time for the study population, with approximately 56 measurements made per 4 h time period (range 52–64).
Accuracy of data collection involved re-examination of 10 sets of randomly selected notes by a second investigator (DT). Inter-rater agreement was assessed via a quadratic-weighted κ statistic,26 yielding a median κ of 0.92.
Treatment
Although therapy varied within district hospitals, treatment was standardised from the time of first telephonic contact with the PICU.27 The protocol mandated (1) exclusive use of 0.9% saline, with a variable concentration of glucose, via the ‘two bag’ system;28 (2) fluid replacement at a standard rate, regardless of the degree of dehydration; and (iii) an insulin dose of 0.1 units/kg/h. The preferred osmotherapeutic agent was 3% saline (3–5 ml/kg).
Statistical analysis
We compared demographic and treatment variables across the three groups using one-way analysis of variance; with post-hoc Scheffe's-adjusted t tests. Temporal biochemical profiles were compared between groups using a random coefficients, linear mixed model (see appendix), with intercept adjustment for two proposed cerebral oedema risk factors measured at presentation: blood urea and PCO2.29 30 A third risk factor, bicarbonate administration, was not incorporated as only four patients received this therapy.
Because the trajectories of the variables were unlikely to follow a straight line, we estimated trajectory coefficients after applying a range of transformations for time (x-axis), based upon a fractional polynomial approach.31 32 For each dependent variable, all 44 recommended fractional polynomial functions were evaluated, with model selection aided by the Akaike Information Criteria (AIC), whereby a smaller number indicates a better model fit.30 Interaction effects between the three groups and time were also screened for. Model checking involved inspection of residual and normal plots.29 30
Cox proportional hazards regression models were also used with cerebral oedema occurrence as the outcome variable, and sequentially measured variables included as time-varying covariates. All models were adjusted for presentation values of blood urea and PCO2. Routine tests of proportional hazard assumption and postestimation were performed. Analyses were done using SPSS V.15 (SPSS, Chicago, Illinois, USA) and Stata V.11 (StataCorp, Texas, USA).
Results
Demographics, biochemical variables at presentation, early treatment and outcome
The three groups had comparable demographics (table 2). The median (first and third quartile) time to cerebral oedema development in the late onset group was 9 h (4–15). Of note, the groups could not be differentiated on the basis of osmolar-based variables at presentation; this included urea, a risk factor identified in other studies.3 5 16 There were borderline differences for the majority of acid–base variables at presentation; however, these were largely due to the late cerebral oedema group manifesting a less severe metabolic acidosis. In the eight patients in whom blood lactate was measured, the median (IQR) level at presentation was 1.1 (1.0, 2.1) mmol/l.
Demographics and early treatment
Of note, children with late onset cerebral oedema received more fluid and had a lower urine output than controls over the first 4 h, and were admitted to the PICU 6 h later. One patient died from cerebral herniation (late onset group); the remainder were discharged from the PICU without obvious neurological deficit; however, the long-term status of these children is unknown.
Temporal profile of osmolality and acid–base variables
Intercept
After adjustment for PCO2 and urea, there was a difference between the three groups in presentation values for serum sodium only (p=0.03, figure 1 and table 3). However, this difference was largely due to a lower serum sodium in the early oedema group, with controls and the late oedema group yielding similar values (p=0.30). There were no other differences between the three groups for the presenting values of the remaining osmolar or acid–base variables.

Prototypical trajectories of osmolality-based variables for the three groups. Units of measurement are the same as seen in table 2.
Osmolar and acid–base temporal models
Blood urea at presentation was associated positively with initial values for effective osmolality (+1.0 mmol/kg per 1 mmol/l increase in urea, p=0.01), serum-corrected sodium (+0.44 mmol/l per 1 mmol/l increase in urea, p=0.03) and PCO2 (+0.7 kPa per 10 mmol/l increase in urea, p=0.001). Blood PCO2 was associated positively with base excess (+0.94 mmol/l per 1 kPa increase in PCO2, p=0.004).
Trajectory
None of the osmolar or acid–base variables demonstrated a linear trajectory (figures 1 and 2, table 3). The three groups could be separated clearly on the basis of trajectories for effective osmolality, glucose-corrected serum sodium and to a lesser extent, serum sodium, as seen by the significant p values for interaction effects in table 3. Compared to controls, those with late onset oedema manifested a dramatic early fall in effective osmolality; they also showed an early drop in glucose-corrected serum sodium (in contrast to the rise seen among controls) and an attenuated rise in serum sodium (figure 1). The nadir values among the late oedema group for effective osmolality and glucose-corrected sodium corresponded to the median time of clinical onset of cerebral oedema (9 h). The pronounced rise in all three variables within the early oedema group was most likely due to aggressive osmotherapy. The pattern of glucose decrement was comparable across all groups.

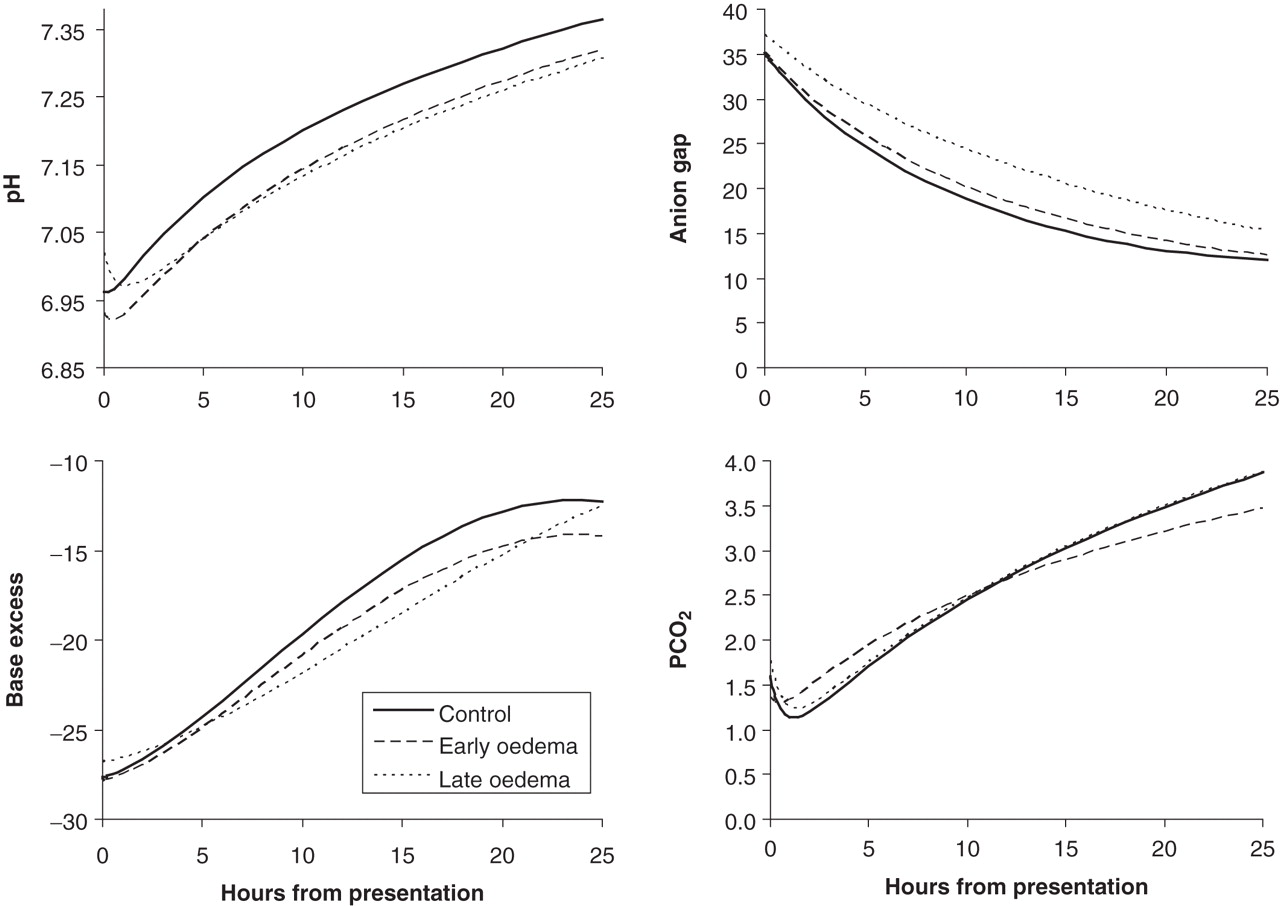
Prototypical trajectories of acid–base variables for the three groups. Units of measurement are the same as seen in table 2.
Individual trajectories of glucose-corrected sodium for the late onset oedema group, up until the development of cerebral oedema, are shown in figure 3. For comparison, the trajectories of the control group over a similar time period are also shown. This confirms the prototypical trajectory modelled in figure 1, with late onset oedema patients manifesting a fall in glucose-corrected sodium, not seen in control patients.

Comparison of early trajectories for corrected serum sodium between the late onset oedema and control groups. Actual trajectories are shown for individual patients. For the late oedema group, the final time point for each patient corresponds to the last measurement taken before onset of clinical cerebral oedema. This figure also gives an idea of the spread of individual trajectories around the prototypical trajectories shown in figures 1 and 2.
The anion gap decreased similarly for all groups, suggesting an equivalent rate of ketosis resolution. The remaining acid–base changes also showed similar profiles, with the exception of the late onset oedema group, which demonstrated a slower rate of resolution for the base excess; this may have been due to hyperchloraemia (figure 2).
Influence of fluid therapy on trajectory
There were significant differences between the three groups in terms of the amount of fluid received and urine output over the first 4 h (table 2). We thus investigated the influence of early fluid balance on the trajectory for glucose-corrected sodium (table 4). First, we estimated the net fluid balance in the first 4 h (calculated as: fluid received minus urine output). We then compared a range of models with 4 h net fluid balance as an independent variable (table 4). These showed that net fluid balance was not a better predictor than oedema group for the glucose-corrected sodium trajectory (model AIC 2057.2 vs 2037.7); nor did net fluid balance improve the prediction when added as a higher-order interaction effect to a model containing oedema group (AIC 2045.2). Similar results were seen for models examining the trajectory of effective osmolality (data not shown).
Models exploring the effect of 4 h net fluid balance on the trajectory of glucose-corrected sodium
Comparison with Cox models
Cox models showed predictive value for all osmolar and acid–base variables, with the exception of glucose (table 5). Likelihood of developing cerebral oedema increased with lower values for effective osmolality, sodium, glucose-corrected sodium, pH, base excess and higher anion gap. However, unlike the random coefficients approach, the Cox models could not estimate the predictive value for trajectories of these variables. In addition, several models suggested problems on postestimation procedures, including possible violation of the proportional hazards assumption for effective osmolality and pH (p=0.09 and 0.06, respectively), poor overall model fit for base excess (from Cox–Snell residuals) and possible misspecification for sodium, anion gap and glucose (Martingale residual plots). Overall, the most stable model was that which included glucose-corrected sodium.
Cox proportional hazards models evaluating development of cerebral oedema
Discussion
Similar to previous studies, we have shown that the risk of developing cerebral oedema in DKA increases with the degree of acidosis (pH, base excess), ketosis (anion gap) and lower values for effective osmolality and sodium.3 5 9,–,19 However, we have extended these findings, by highlighting the relationship between osmolar changes and cerebral oedema. Compared to controls, children who develop cerebral oedema during treatment exhibit a profound fall in serum osmolality, typically reaching a nadir at a time approximating development of clinical cerebral oedema. The major discriminating component of the osmolality change was a lower than expected rise in serum sodium, as glucose (and probably ketones) fell similarly in all groups. In this respect, our findings are consistent with previous studies.3 5 9,–,19 However, by using a mixed model allowing for non-linear trajectories, we were better able to elucidate the temporal profile of osmolar and acid–base variables.
In contrast to previous studies, we highlighted the role of glucose-corrected serum sodium as a potential early marker of cerebral oedema development. This is because the directional change (rather than the rate of change) can be utilised: in that, the typical trajectory for a patient developing late cerebral oedema was a fall in glucose-corrected sodium, compared to the slow rise seen among those who did not (figures 1 and 3). This is in contrast to the directional changes for effective osmolality and glucose, where both variables changed in the same direction for the control and late onset oedema groups, albeit at different rates.
The significance of our findings should be interpreted in light of the possible aetiologies of cerebral oedema in DKA.8 One theory proposes a two-stage insult. Initially, the brain is subjected to an ischaemic insult from reduced cerebral blood flow secondary to severe dehydration and hypocapnia.3 33 In addition, several ion transporters important in neuronal and glial cell volume regulation (sodium-hydrogen exchanger 1 and sodium-potassium-chloride co-transporter 1) are hyperstimulated by extreme intracellular acidosis, resulting in excessive accumulation of intracellular sodium.34 Both processes may lead to cytotoxic oedema. This is supported by animal studies, and may explain why oedema formation can precede treatment for ketoacidosis33 35 The second insult occurs during therapy. Cerebral blood flow is restored by fluid therapy and acidosis correction, and may even result in relative hyperaemia, presumably due to loss of autoregulation.33 36 37 At this stage, the blood–brain barrier is disrupted, via a multitude of potential mechanisms including stimulation of inflammatory mediators,38 endothelial glycocalyx disruption39 and activation of the sodium exchangers/co-transporters.34 The latter may be exacerbated by several therapies including insulin and sodium bicarbonate.8 The net result is vasogenic oedema, or accumulation of fluid in the brain interstitium.
Both mechanisms for oedema formation are likely to be exacerbated by the inappropriate decreases in blood osmolality and glucose-corrected serum sodium shown in this study. Like others, we showed that patients who developed late onset cerebral oedema received more fluid in the first 4 h,5 10 15 17 which was exacerbated by a lower urine output. However, this did not produce a consistent effect on the trajectory for corrected serum sodium or effective osmolality (table 4, models 3 and 4). Unfortunately, because we did not measure urinary electrolytes, we were unable to clarify this mechanism. Nonetheless, it is possible that excessive fluids may require a second stimulus to promote oedema formation, such as blood–brain barrier disruption or disordered urinary electrolyte and water handling.
Two important differences exist between the findings in this study and those from previous studies. First, we did not discover a temporal relationship between the trajectory of acidosis and level of consciousness.18 Second, we were unable to show group differences in terms of the presenting values of blood urea and PCO2.3 5 Both findings may merely represent the selective nature of the study population in this study, in that we were treating the extreme end of the spectrum of DKA, as opposed to that seen in population-based studies. This is highlighted by the degree of acidosis at presentation, which was, on average, 0.1 pH points lower than that found in other studies.3 5 10 11 15 17 Indeed, this may also explain the high incidence of neurological abnormality seen in the patients in this study.
The present study has several limitations. First, although the diagnosis of cerebral oedema was consistent with that recommended in other publications,1 3 16 23 it was largely a clinical one, relying on response to osmotherapy. Although neurological status in DKA correlates with radiological cerebral oedema,40 a minority of children have other causes for neurological deterioration,7 and we cannot exclude this. However, our policy mandated neuroimaging in all cases of ongoing neurological deficit. Second, a retrospective study means that we may have missed important confounders. This is most likely for treatment received at the referring hospital. Third, our sample size meant that the study was limited in the number of variables that could be adjusted for, and indeed the significance of some of these may have been underestimated (eg, urea and PCO2). Fourth, a potential criticism is that data were included within the trajectory estimates that were collected after the development of cerebral oedema, meaning that aspects of treatment (eg, administration of hypertonic saline) may have altered the trajectories. Thus, the current study must be viewed as predominantly hypothesis generating in terms of the potential utility of glucose-corrected sodium as a marker of cerebral oedema development. This requires prospective evaluation in a multicentre study.
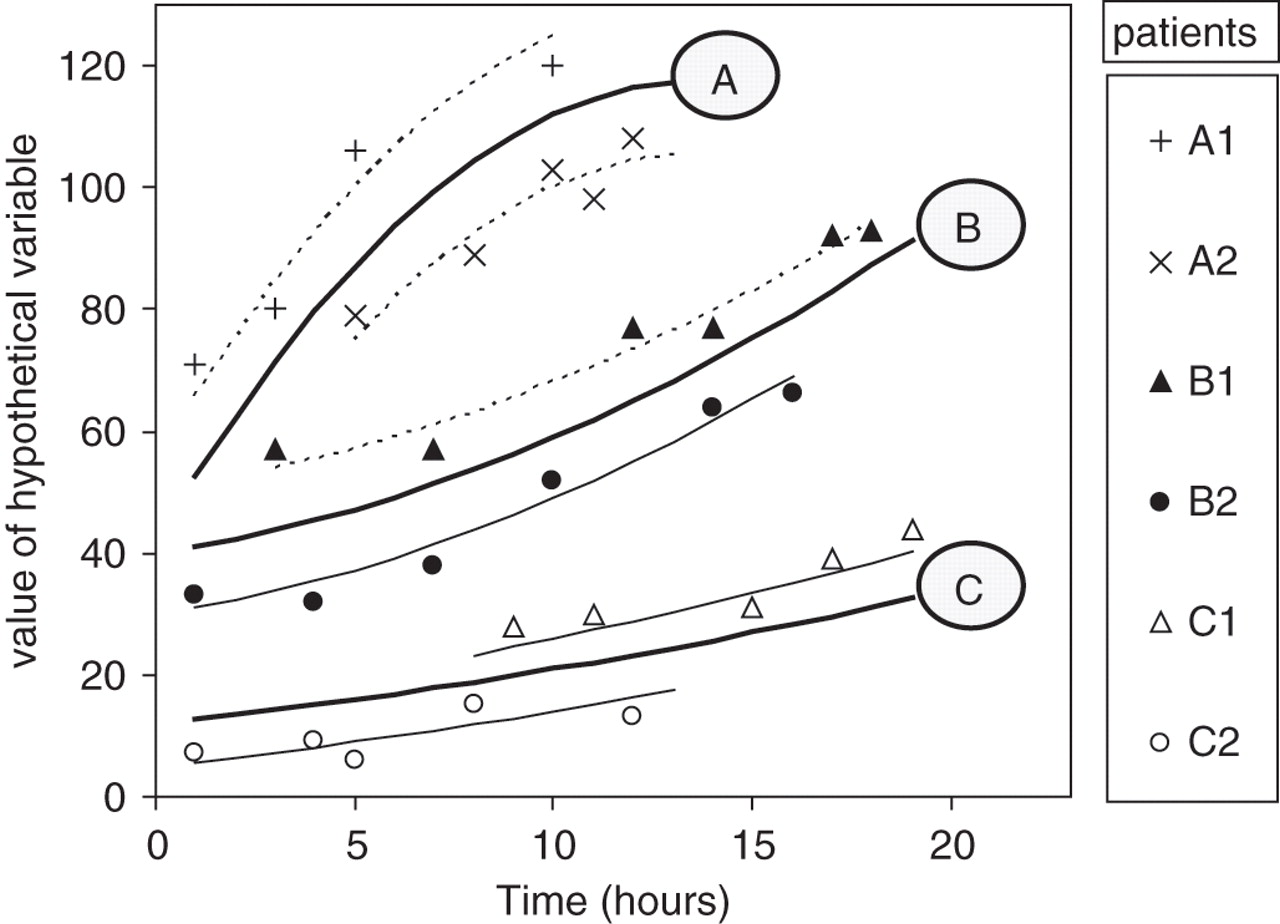
Appendix. Interpreting a random coefficients linear mixed model.
The figure shows a hypothetical y variable measured over time among six patients: A1, A2, B1, B2, C1, and C2. The patients belong to three groups (A, B and C); two patients per group. Between four and six measures are made per patient, at differing time points. We are interested in three clinical questions: (1) is the y variable's starting value the same for the three groups, (2) does the y variable change over time for the six patients when taken as a whole, and (3) does the rate of change with time differ for the three groups (A, B and C)? Of the three questions, (3) is typically of greatest clinical interest.
A random coefficients mixed model will calculate a prototypical trajectory for each group (A, B, C: solid lines) based upon individuals' regression analyses (dotted lines). The prototypical trajectories take account of both the number of measurements and the goodness of fit for each patient's regression analysis. In this example, the trajectories are not of a straight line, but rather are quadratic (y = a + bx + cx2, an example of a fractional polynomial).
In this example, overall the three groups have different starting values (intercepts), despite A and B perhaps having similar prototypical values (y = 40 and 42 respectively). The y variable clearly changes with time, but in a different way for each of the three groups (group-time interaction). This model adjusts for a single variable (group membership) only; other more complex models are possible. For example, we may add a third variable, urea, and test whether this variable influences the starting y value (intercept) for each patient. If urea is positively associated with the starting value (as it is in table 3 for the y-variable effective osmolality), we would expect patient A1 to have a higher starting urea value than A2, B1 than B2, and C1 than C2.
For the interested reader, Singer and Willet provide an excellent, non-mathematical explanation of random coefficients models and other longitudinal analyses.30
References
Footnotes
-
Competing interests None.
-
Ethics approval This study was conducted with the approval of the St Thomas' Hospital REC 09/H0802/25.
-
Provenance and peer review Not commissioned; externally peer reviewed.