Article Text

Abstract
Background Understanding donor, government and out-of-pocket funding for early child development (ECD) is important for tracking progress. We aimed to estimate a baseline for the WHO, UNICEF and World Bank Nurturing Care Framework (NCF) with a special focus on childhood disability.
Methods To estimate development assistance spending, the Organisation for Economic Cooperation and Development’s Creditor Reporting System (OECD-CRS) database was searched for 2007–2016, using key words derived from domains of the NCF (good health, nutrition and growth, responsive caregiving, security and safety, and early learning), plus disability. Associated funds were analysed by domain, donor, recipient and region. Trends of ECD/NCF were compared with reproductive, maternal, newborn and child health (RMNCH) disbursements. To assess domestic or out-of-pocket expenditure for ECD, we searched electronic databases of indexed and grey literature.
Results US$79.1 billion of development assistance were disbursed, mostly for health and nutrition (US$61.9 billion, 78% of total) and least for disability (US$0.7 billion, 2% of total). US$2.3 per child per year were disbursed for non-health ECD activities. Total development assistance for ECD increased by 121% between 2007 and 2016, an average increase of 8.3% annually. Per child disbursements increased more in Africa and Asia, while minimally in Latin America and the Caribbean and Oceania. We could not find comparable sources for domestic funding and out-of-pocket expenditure.
Conclusions Estimated international donor disbursements for ECD remain small compared with RMNCH. Limitations include inconsistent donor terminology in OECD data. Increased investment will be required in the poorest countries and for childhood disability to ensure that progress is equitable.
- early child development
- official donor assistance
- nurturing care framework
- tracking
- responsive care
This is an open access article distributed in accordance with the Creative Commons Attribution Non Commercial (CC BY-NC 4.0) license, which permits others to distribute, remix, adapt, build upon this work non-commercially, and license their derivative works on different terms, provided the original work is properly cited, appropriate credit is given, any changes made indicated, and the use is non-commercial. See: http://creativecommons.org/licenses/by-nc/4.0/.
Statistics from Altmetric.com
Key findings
HOW MUCH? Absolute investment: a total of US$79.1 billion donor funding was disbursed between 20/07 and 2016 for early child development (ECD) domains included in Nurturing Care Framework (NCF) (health, nutrition, responsive caregiving, security and safety and early leaning), plus disability.
WHAT IS NEW? Relative investment: donor investment for ECD is dominated by health and nutrition (US$70.4 billion), with safety/security (US$3.6 billion), responsive care (US$3 billion) and early learning (US$1.4 billion) following. Disability has a tiny allocation of US$0.7 billion. Health represented 78% of all investments and, on average, US$11.3 per child per year was disbursed for health, while only US$2.3 per child per year was disbursed for the remaining domains.
WHEN? Time trends: Donor funding related to Nurturing Care over the last 10 years has increased faster than Official Development Assistance to health. Overall rate of increase in disbursements between 2007 and 2016 averaged 8.3% but varied by domain; nutrition and growth (24.5%), responsive care (22%), early learning (21.9%), security and safety (7.9%), good health (6.5%), and disability (−11.4%).
KEY GAPS? Data on domestic and out-of-pocket funding are lacking: In most countries, government expenditure is challenging to track, especially for specific programmes such as early child development. Improved data are also needed on out-of-pocket payments for childcare and healthcare services, which are likely to be large. Children with disabilities appear particularly under-funded.
Background
Early child development (ECD) and human capital is central to the Sustainable Development Goals (SDGs). There have been increasing calls for investment to ensure that every child is supported to reach their developmental potential.1–3 In 2017, the WHO together with UNICEF and the World Bank launched the Nurturing Care Framework (NCF) to guide policymakers on inputs to optimise ECD.1–3 However, there have been no assessments of relevant investments for ECD.
For other areas of reproductive, maternal, newborn and child health (RMNCH), methods for tracking donor funding in low- and middle-income countries (LMIC) are well established, particularly through Countdown to 2015/2030.4–7 These analyses have been an important part of promoting accountability.4–7 For example, the almost negligible investments in newborn deaths and stillbirths have been highlighted, as well as falling investments in sexual and reproductive health in the years before 2010.7–9
Funding for any area of global health or international development, including ECD, is a mix of: (1) international donor disbursements that promote development (eg, from high-income countries or private foundations, which we have collectively termed Official Development Assistance+ (ODA+)) here; (2) domestic investments made by governments; and (3) out-of-pocket payments by families. Tracking all three of these funding types is important to hold donors and governments accountable for investment in ECD and ultimately equitable progress towards child development-related SDGs.4
Analysing international donor funding disbursements is possible through the Creditor Reporting System Aid Activity (CRS) database run by the Organisation for Economic Cooperation and Development (OECD).9 The CRS collects data on donor development assistance and enables analysis of where development aid goes, what purpose it serves and what policies it aims to implement.10 Committee DA. Converged Statistical Reporting Directives for the Creditor Reporting System (CRS) and the Annual DAC Questionnaire - Addendum 3: Reporting instructions for the RMNCH policy marker. Paris: Organisation for Economic Co-operation and Development, 2016. The term ODA+ has been used for ODA that includes disbursements from the BMGF.6 Each record in the CRS includes the project title, a description of the project and financial data. The donor categorises the sector the spending is intended for within a predefined list. Hence, similar to a systematic search of published literature, the CRS database can be searched for related key words as a means of identifying donor investments towards specific interventions and programmes.
For RMNCH or any other international development issue, tracking domestic funding has not been possible in a systematic and comparable way due to lack of standardised national databases.11 National Health Account data are available for a limited number of countries, and even with special studies, it is complex to disaggregate spending for specific conditions or programmes. Out-of-pocket funding by families can be estimated as a whole for health costs, but it is not simple to delineate by programme without special studies. In this paper, we aim to estimate and track donor funding for ECD at the national level over time using the CRS database. Data on domestic government and out-of-pocket expenditure will also be explored.
Scope and structure of series
This paper is part of a series examining evidence to inform design and implementation of ECD programmes in LMIC, structured around a programme planning cycle (figure 1). Other papers have reviewed overall design and partnerships,12 monitoring and evaluation13 14 and process of scaling-up.15 This paper focuses on funding flows for ECD.

Programme cycle for design, implementation and scaling of early child development programmes.
Aims and objectives
The aim of this paper is to estimate international donor, national/domestic and family out-of-pocket funding related to ECD in LMIC. Specifically, this paper will:
Define domains for assessing and tracking funding for ECD: as outlined in the NCF1
Analyse donor funding: using the CRS database, international donor disbursements for ECD, described and disaggregated by NCF domain and relative to investments for RMNCH.
Review domestic and out-of-pocket funding: other data sources, relevant to these funding streams, will be searched with results described and consideration of implications for improved tracking of financial resources for ECD.
Methods
Objective 1: use the WHO NCF to identify domains to inform search terms and estimation strategy
The NCF lists and defines five domains of policy change, for improving child development in LMIC including: good health, adequate nutrition, responsive caregiving, security and safety, and opportunities for early learning.1 We also considered disability as an additional and closely linked domain, which is implicit in the NCF.
The ‘Good Health’ domain, as defined by the Nurturing Care Framework1
Young children’s good health is the result of caregivers:
Monitoring children’s physical and emotional condition.
Giving affectionate and appropriate responses to children’s daily needs.
Protecting young children from household and environmental dangers.
Having hygiene practices which minimise infections.
Using promotive and preventive health services.
Seeking care and appropriate treatment for children’s illnesses.
These actions depend on caregivers’ physical and mental well-being. For example, when mothers are anaemic, it can cause apathy that makes them less able to engage in responsive caregiving. The situation can be made worse if the child is also apathetic or listless because of being undernourished or frequently ill. Nurturing care therefore means we need to pay attention to the health and well-being of caregivers as well as children.
Objective 2: donor funding database searches and analysis
Databases
The CRS database includes data from 51 countries, 44 multilateral organisations and 4 private donors, including the BMGF.6 16 Yearly CRS datasets from 2007 to 2016 were downloaded from the OECD statistics website. We excluded disbursements that are not considered ODA such as other official flows and equity investments. All sectors in the CRS database were included. The Countdown to 2015 initiative published includes all projects between 2003 and 2013 that were targeted to RMNCH.17 18 This dataset is the basis for the estimating disbursements for the good health NCF domain (box 1). Data were managed in SQL Server and processed in Excel.19
Estimation strategy
We developed different strategies to assess disbursements and time trends for each domain of the NCF. For the good health domain, we used the database produced by the Countdown to 2015 initiative. We included in our estimates all maternal and child health disbursements and excluded reproductive health and nutrition disbursements. Because the Countdown database only covers the period 2003–2013, we estimated the next 3 years using an autoregressive integrated moving average model.
For the adequate nutrition, responsive caregiving, security and safety, early learning and disability domains, we developed lists of keywords/search terms based on the descriptions of each domain (supplementary web appendix table 1). Water and sanitation, which constitute part of the security and safety domain, were estimated using the G8 health working group.20 Supplementary web appendix table 2 summarises the approach taken to estimate disbursements for each domain.
Supplemental material
Supplemental material
Search terms
We developed lists of keywords/search terms based on the NCF descriptions of interventions in each domain (supplementary web appendix table 1).1 Keywords lists were developed in English and translated into other languages used in disbursement reporting. Entries in the database were then searched for these key words and coded as relevant or not to ECD. To avoid double counting projects already coded for the good health domain, we matched our resulting list of records with the dataset produced by the Countdown to 2015/2030 initiative using donor name and/or CRS identification number, or by combining the project title, short description and long description fields. We excluded false positives (records that contained at least one keyword but that were not relevant to ECD) by reading titles and project descriptions of all records that did not match the Countdown to 2015 initiative database and coding them as either relevant or not to ECD.
Financial disbursements
For each search result, the linked financial input in 2015 US dollars was apportioned proportionally to the relevant domains to which the search terms were linked in the NCF. Project descriptions frequently name more than one search term and may link to more than one domain, especially overlapping with health. We analysed this by showing the overlap between health and every other domain.
Analyses and trends
We compared trends of ECD disbursements to RMNCH, health and to all ODA disbursements. We analysed trends of ECD disbursements disaggregated by each NCF domain. We produced estimates by recipient country for all domains, excluding good health, due to uncertainty in projections for individual countries for the 2013–2016 period. Because of variation in population size across countries, we analysed trends of ECD disbursements per child under 5 years, excluding good health. We obtained the population under 5 years from the World Development Indicators from the World Bank Data Bank.21 Statistical Analyses were undertaken in R using the forecast package.
Objective 3: domestic, out-of-pocket and other funding sources
We searched electronic databases of indexed publications and grey literature to identify sources that described or estimated domestic or out-of-pocket funding of ECD interventions. Data from the UNESCO Institute for Statistics (UIS) were used to estimate domestic funding for preprimary education. Where available, national education accounts were reviewed to estimate out-of-pocket payments for preprimary education.
Results
Donor funding analyses
Search terms
The CRS database contains 2,201,531 records for the period 2007–2016, of which 80,984 (3.7%) contained at least one keyword. The nutrition and growth domain is the most frequently mentioned, while disability is the least (figure 2). The time trend shows an overall increase in mentions for all domains, with a steeper slope for nutritional interventions, except for disability, which shows a flat trend across the observed period (figure 2). Mentions for all domains appear to peak in 2010 before declining between 2011 and 2013. Mentions later increase from 2013 to 2016.

Number of records from the OECD Creditor Reporting System database with at least one keyword coded as relevant to ECD (2007– 2016) disaggregated by domains of the Nurturing Care Framework.
Financial disbursements
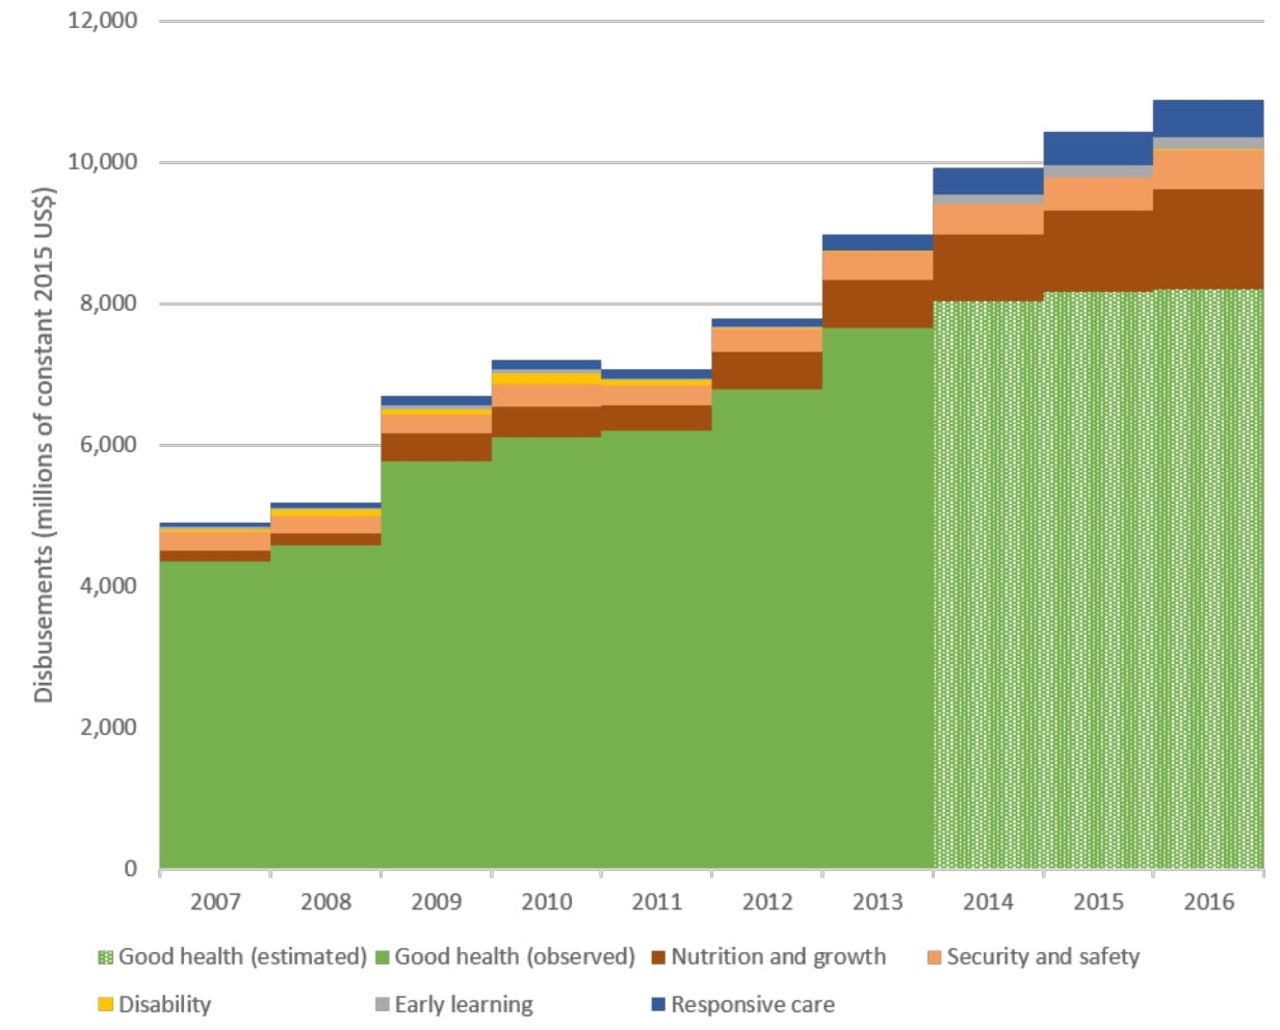
We estimated that US$79.1 billion were disbursed between 2007 and 2016 for NCF domains (figure 3). We observed a constant increase over time in ECD disbursements, except in 2011 (table 1). Disbursements for the good health domain make up the largest share of total disbursements in all years (78.2%), followed by nutrition and growth (10.7%).

Trends in disbursements for early child development (2007–2016) disaggregated by Nurturing Care Framework domains (millions of constant 2015 US dollars).
Disbursements for early child development by Nurturing Care Framework domain (millions of constant 2015 US dollars)
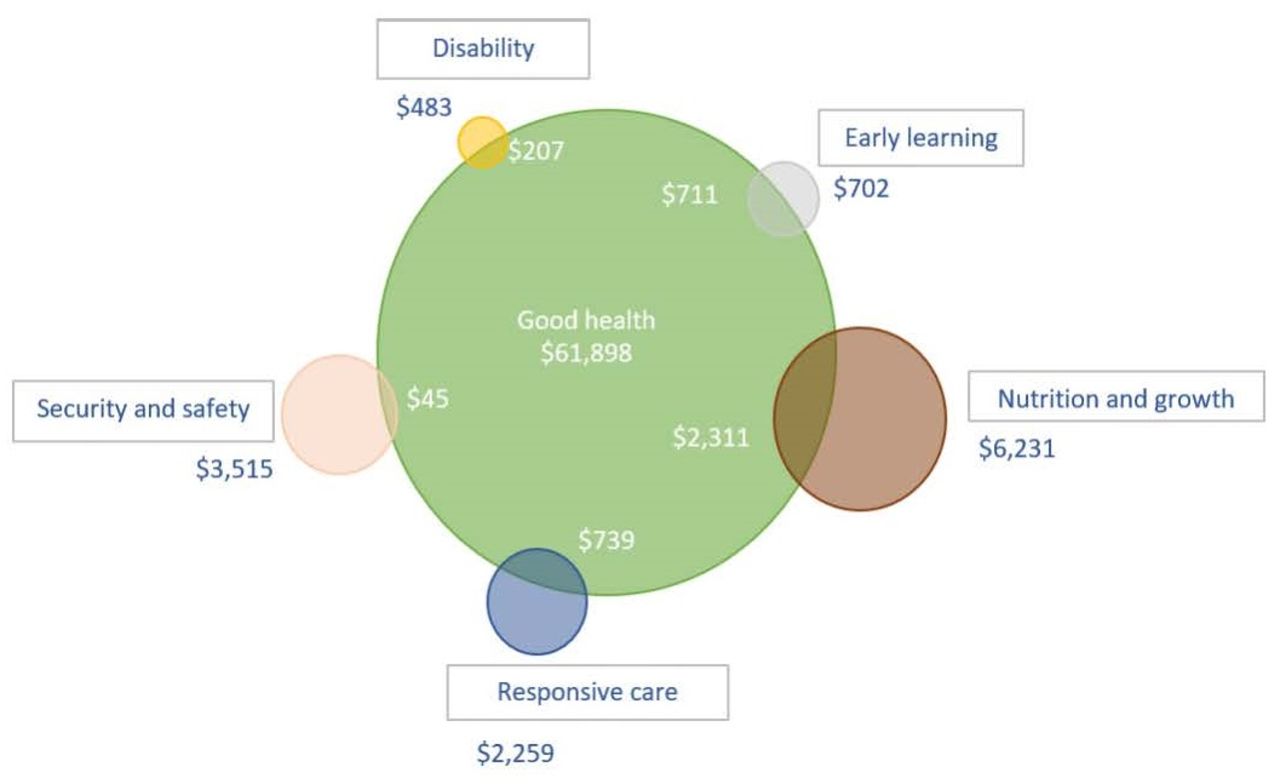
There is substantial overlap between the good health and other domains (figure 4). Many records that have at least one keyword include interventions aimed at improving child health; indeed, almost 25% of disbursements for disability, safety and security, responsive care, early learning, nutrition and growth are included within projects that target improved health.

Venn diagram showing proportionate overlap of disbursements between good health and other domains of the Nurturing Care Framework (millions of constant US dollars).
Analyses and trends
We estimated an increase in NCF-related disbursements of 121% between 2007 and 2016 (table 1). Disbursements for early learning, responsive caregiving, and nutrition and growth have the largest compound average growth rates, reaching over 20% per year (table 1). The overall ECD disbursements growth rate is estimated at 8.3% per year for the observed period and is heavily influenced by the good health domain.
Total ODA+ disbursements also shows an increasing trend over the observed period, as do ODA+ to health, RMNCH and ODA+ to ECD (figure 5). Disbursements for ECD have grown at a faster rate compared with ODA to health or RMNCH. The compound average growth rates are: 6% for ODA+ to health; 7.2% for ODA+ to RMNCH; and 8.3% for ODA+ to ECD (supplementary web appendix table 3).
Supplemental material
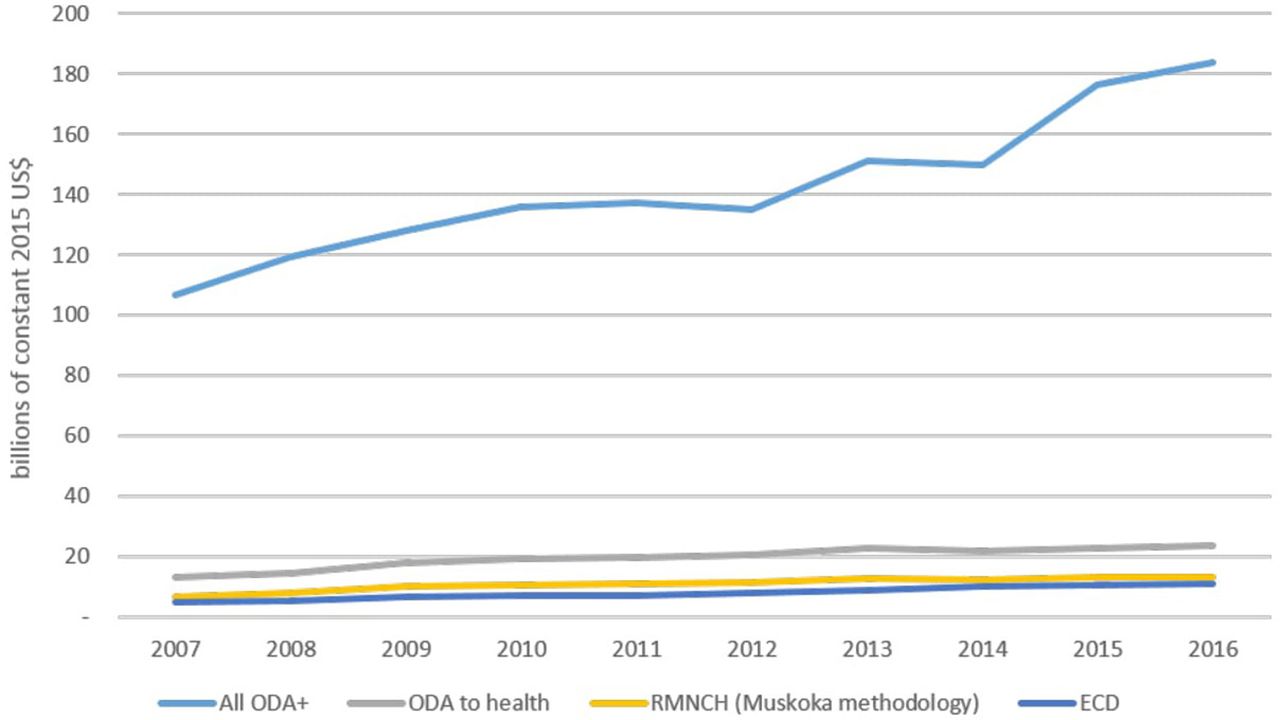
Time trends of total Official Development Assistance to health, reproductive, maternal, newborn and child health (RMNCH) and early child development (ECD) between 2007 and 2016 (billions of constant 2015 US dollars). ODA, Official Development Assistance.
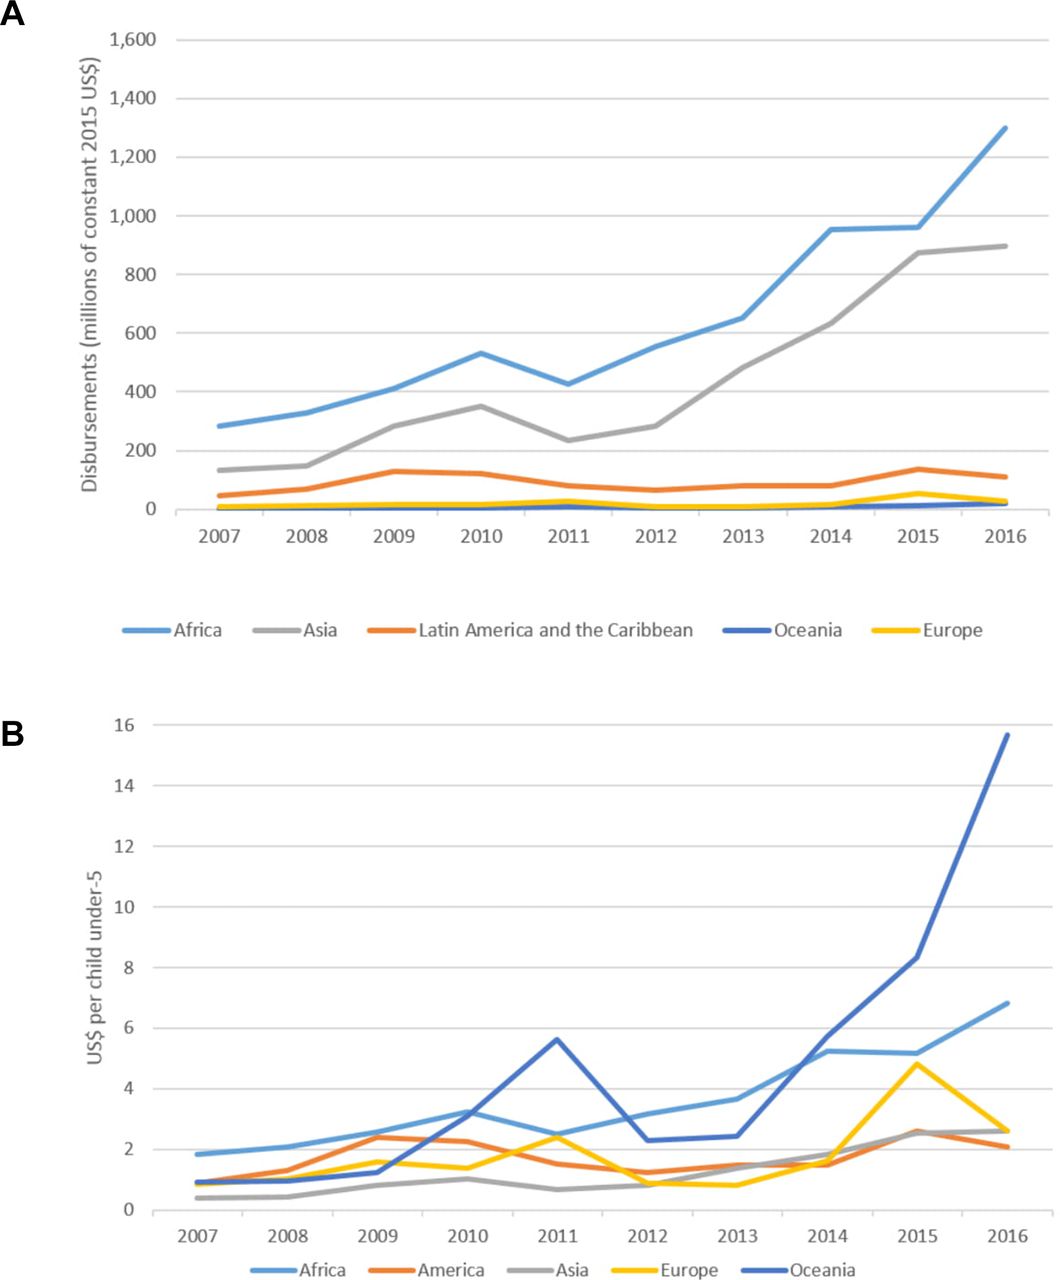
Table 2 shows disbursements per year per child disaggregated by domain. On average, US$2.3 per child per year were disbursed over the 10-year period to fund activities other than health. Disbursements for good health were on average US$11.3 per year per child, which is five times larger than the remaining five domains together. Figures 6A and B show total disbursements and disbursements per child by world region, excluding good health (excluded as country-specific estimates for the 2013–2016 period were not estimated at the recipient level). Africa and Asia show an increasing trend, particularly after 2011, while Latin America and the Caribbean, Europe and Oceania receive a smaller total amount of assistance with minimal changes across the observed period (figure 6A). When disbursements are adjusted by population sizes, results differ (figure 6B). Small states in the Pacific received over US$15 per child in 2016, while Latin America and the Caribbean, Europe and Asia received just close to US$2 per child. African countries showed an increasing trend that more than tripled between 2007 and 2016, increasing from US$2 to US$6.8 per child. Although disbursements for European LMIC were more volatile, they shared similar trends to Latin America and the Caribbean and Asian countries.
Disbursements per year per child under 5 years by Nurturing Care Framework domain (millions of constant 2015 US dollars)

Trends and disbursements by world region between 2007 and 2016. (A) Total disbursements by world region (2007–2016) (millions of constant US dollars). (B) Disbursements per child under 5 years old (millions of constant 2015 US dollars) by world region (2007–2016).
One supplementary web appendix table 4 shows ECD disbursements by recipient. The table includes disbursements exclusive to ECD domains other than health and shows total disbursements and average yearly disbursement per child under 5 years between 2007 and 2016. Countries are divided by priority countries as defined by the Countdown to 2015/2030 initiative.4 6 22 In both groups, disbursements per child varied widely from under US$1 to over US$20. A population-weighted average shows that priority countries received more money per child than non-priority countries (US$3.6 vs US$2.8).
Supplemental material
Domestic, out-of-pocket and other funding sources
We did not find detailed information at national level for domestic and out-of-pocket spending for the NCF domains (supplementary web appendix table 5). Data on domestic funding for responsive caregiving were not found.
Supplemental material
Health spending per capita across low-income countries and lower middle-income countries was US$120 and US$267, respectively, in 2014, with wide variation.10 Health spending in low-income countries ranges from US$33 in Somalia to US$347 in Uganda. In low-income countries, only 18% of total health spending per capita is from the government (including donor inputs).10 In lower middle-income countries, still only 35.9% of total health expenditure is from the government. Consequently, low-income countries rely heavily on out-of-pocket spending by families. While projects funded by donors (outside government channels) do help fill this gap, much of the cost is borne by families. In low-income countries, at least 29% of total health spending per capita came from out-of-pocket expenditure.10
Using the most recent data available, government expenditure in nutrition programmes in low-income countries was US$53 million in 2014, representing 1.4% of total government health expenditure.23 For lower middle-income countries, government expenditure in nutrition programmes was US$2.2 billion for the same year, representing 1.6% of total government health expenditure.24
Data on domestic preprimary education expenditure in low-income and lower income countries are limited. Among the 82 countries considered low or lower middle income by the World Bank, UIS data on preprimary education spending as a share of gross domestic product are only available for 45 countries for at least 1 year between 2012 and 2017. Low-income countries spent 2.9% of their education budgets on preprimary education, compared with 6.5% in lower middle-income countries.25 In Uganda and Nepal, household contributions account for most of the total preprimary spending.26 In the Ivory Coast and Vietnam, household contributions account for 29% and 21% of total contributions, respectively.
Discussion
At a time when global calls for ECD investment are increasing, this paper provides the first analysis to estimate these funding flows, setting a baseline for the United Nations’ NCF launched in 2017, to enable tracking of investments and hold governments and donor organisations accountable for commitments made in the SDGs.
Our analysis shows that there are available data to track international donor funding, with important implications now, and for further data improvement. There are consistent and increasing mentions of terms related to ECD, which suggest increased donor awareness. Disbursements for ECD have grown in the last decade, at a faster rate than those for RMNCH and total ODA, yet most of the assistance disbursed for ECD is targeted to health and nutrition. Despite this increase, only US$2.3 per child per year were disbursed to fund early learning, responsive care, disability, safety and security, and nutrition and growth interventions between 2007 and 2016. This amount is much smaller than the estimated US$11.3 per child for child health. Immunisations are a large proportion of child health funding, leaving important funding gaps of major causes of child deaths, especially given that 47% occur in the neonatal period.5 There is not an agreed package with running costs for ECD or the NCF, but it is likely that our estimated amount is insufficient. It has been estimated that incorporating just two interventions into existing health and nutrition services (care for child development27 and support for maternal depression) to a high coverage setting would cost half a dollar per year per child.28 Scaling just two interventions would use almost one-fourth of the estimated budget.
We did not identify detailed sources of domestic funding, including out-of-pocket payments that matched the detail of donor development assistance data and could give details on specific programmes such as ECD. In most countries, most of the costs would be met by families and less likely by national governments. These investments are less well tracked overall and cannot presently be disaggregated for ECD. Our data search was performed 2 years after Results for Development’s (R4D) report, Financing early child development: an analysis of international and domestic sources in low- and middle-income countries, was published, which also reported major data gaps for these funding flows.29
Strengths and limitations
Analysis of OECD data has limitations due to variable descriptions of projects by donor. However, our analysis builds on the work of other published literature that has also used OECD data and worked to address these limitations, notably the Countdown to 2015/2030 initiative. Our findings, particularly for nutrition, closely match those from the detailed exercise performed by R4D in 2015, with less than 1% difference between our estimates.24 This agreement is due to use of a similar set of keywords for identifying nutrition projects, which adds reassurance regarding the replicability of our analyses.
Earlier work, aiming to track funding for other topics (eg, neonatal health7 8), has shown that the more specific the terms, the more dependent the results are on donor reported descriptions, and so keyword counts can be considered tracers of donor interest and attention to a particular topic. For example, the notable lack of mention of stillbirths by donors, as found by Pitt et al, is very convincing of an absence of awareness and attention.7 8
Finally, we have described overlaps between all domains assessed (figure 5). Since these domains are not mutually exclusive, apportioned disbursements to projects mentioning more than one term by implicitly assuming proportionality. This assumption might not change overall estimates for domains but may have had an impact on the estimated trends observed for each domain.
Changes over time on donor reporting behaviour on project descriptions might affect our estimates. For example, it might explain in part the decrease in funding for disability. Although we used a broad set of keywords, it is possible that disability disbursements are now included within other projects that are not being captured.
Improving the data
ODA funding data can be improved by reducing the inconsistency of donor reporting. Just as keywords and search terms have improved systematic reviews in electronic bibliographic databases, more consistency by donors could improve the specificity of ODA searches. An agreed set of keywords or a controlled vocabulary could facilitate more precise tracking of funds.
However, the biggest data gaps are not regarding ODA reporting, but for government and out-of-pocket expenditure in ECD. Localising data on domestic spending, even for health, education, and water and sanitation, has been challenging. This is likely to be even more difficult when focusing on a particular period of the life course, as with ECD and the NCF. Different methods for measuring health expenditure have been described, with specific recommendations for LMIC settings.30–33 Further adaptations of these methods to enable ECD expenditure can be formulated, allowing a clearer picture of the flows of funds from the international community and governments to families in need.
Gustafsson-Wright et al 34 suggest that accurate and consistent cost data for ECD interventions are required. Clear recommendations of effective ECD interventions and the requirements for their scaling up and implementation allows more precise costing, which can lead to their inclusion within donor and government budgeting. Although we have estimated development assistance for ECD, the lack of domestic expenditure data did not allow us to ascertain whether international donor assistance is supplementing government investments or replacing it.
Conclusion
This first assessment of funding for the NCF suggests increasing donor funding over time for ECD, although this is still weighted towards child health, notably immunisation and nutrition.5While there are still 5.6 million child deaths and a heavy burden of morbidity, it is crucial to also invest in ensuring that surviving children can thrive and reach their developmental potential. Although funding for ECD has grown over the last decade, funding for responsive care and early learning and disability are lagging, and there is surprisingly little funding allocated to children with disability. Currently, it is likely that the poorest families continue to pay the most out of pocket, for health, ECD and disability. Closing these data gaps regarding domestic and family out-of-pocket spending is important for government and donor accountability.
Acknowledgments
We would like to thank all the innovators, participants and researchers involved in projects included in the Saving Brains® portfolio and evaluation. We would like to thank Grand Challenges Canada® as funder of unpublished data. We would also like to thank the Early Child Development Expert Advisory Group for their guidance, and we are grateful to Claudia da Silva and Fion Hay for administrative assistance.
References
Footnotes
Contributors Technical oversight of the series was led by JEL and KMM, and the idea for this paper came from JEL. The methods, data management, analysis and first draft of the paper was undertaken by LA. Other specific technical contributions were made by VPH, AU and JEL, and all authors reviewed the text. The Early Child Development Expert Advisory Group (Pia Britto, Tarun Dua, Esther Goh, Sally Grantham-McGregor, Melissa Gladstone, Jena Hamadani, RH, Karim Manji, James Radner, Muneera Rasheed, Karlee Silver and AU) contributed to the conceptual process throughout. All authors reviewed and agreed on the final manuscript.
Funding This supplement has been made possible by funding support from the Bernard van Leer Foundation. Saving Brains impact and process evaluation funded by Grand Challenges Canada.
Competing interests None declared.
Provenance and peer review Commissioned; internally peer reviewed.
Patient consent for publication Not required.