Article Text

Abstract
Objective To describe the demographics, mechanisms, presentation, injury patterns and outcomes for children with traumatic injuries.
Setting Data collected from the UK’s Trauma and Audit Research Network.
Design and patients The demographics, mechanisms of injury and outcomes were described for children with moderate and severe injuries admitted to the Major Trauma Network in England between 2012 and 2017.
Results Data regarding 9851 children were collected. Most (69%) were male. The median age was 6.4 (SD 5.2) years, but infants aged 0.1 year (36.5 days) were the most frequently injured of all ages (0–15 years); 447 (36.0%) of injuries in infants aged <1 year were from suspected child abuse. Most injuries occurred in the home, from falls <2 m, after school hours, at weekends and during the summer. The majority of injuries were of moderate severity (median Injury Severity Score 9.0, SD 8.7). The limbs and pelvis, followed by the head, were the most frequently and most severely injured body parts. Ninety-two per cent were discharged home and 72.8% made a ‘good recovery’ according to the Glasgow Outcome Scale. 3.1% of children died, their median age was 7.0 years (SD 5.8), but infants were the most commonly fatally injured group.
Conclusions A common age of injury and mortality was infants aged <1 year. Accident prevention strategies need to focus on the prevention of non-accidental injuries in infants. Trauma services need to be organised to accommodate peak presentation times, which are after school, weekends and the summer.
This is an open access article distributed in accordance with the Creative Commons Attribution Non Commercial (CC BY-NC 4.0) license, which permits others to distribute, remix, adapt, build upon this work non-commercially, and license their derivative works on different terms, provided the original work is properly cited, appropriate credit is given, any changes made indicated, and the use is non-commercial. See: http://creativecommons.org/licenses/by-nc/4.0/.
Statistics from Altmetric.com
What is already known on this topic?
Mortality for children’s trauma is low.
Head injuries are the most common cause of severe trauma and mortality in children.
Different injury patterns are present in different ages.
What this study adds?
The very youngest infants aged around 0.1 year (36.5 days) are the most commonly injured and require a high degree of suspicion for non-accidental injury.
The most severe injuries involve multiple injured body parts (most often limbs and pelvis and/or head) which require a collaborative multispecialist approach.
Major trauma networks need to provide services to accommodate the demands of peak presentation times for injured children: after school, at weekends and during summer.
Introduction
In 2014, the Royal College of Paediatrics and Child Health reported that injuries were the most common cause of death in children over the age of 1 year,1 and a leading cause of death and disability worldwide.2 Injury can also result in long-term disability and is a chief cause of socioeconomic burden.3 Reports have shown suboptimal care and poor outcomes in the UK for patients with traumatic injury.3–5
In 2012, major trauma services in the UK were reconfigured to create national Major Trauma Networks (MTN) with an aim to improve access to, and consistency of specialist care. The networks consist of Major Trauma Centres (MTC) and Trauma Units (TU) so that patients with serious and/or multiple injuries are triaged to an MTC, while those less seriously injured are triaged to a TU. MTCs are defined as hospitals which provide 24 hours, 7 days a week of consultant-led trauma teams with the resources, facilities and staff to manage all types of serious/multiple injuries. In order to monitor standards of care and outcomes, MTCs and TUs submit data for all patients with moderate or severe injury (defined as a predicted Injury Severity Score (ISS) >8) to the national Trauma Audit and Research Network (TARN). These data relate to care provided throughout the trauma pathway from prehospital care to hospital discharge and involve patients with a minimum length of stay (LOS) of 3 days and/or who are admitted to a critical care unit, and/or who die in hospital. Hospitals are given the option to submit data regarding patients who stay less than 3 days, but such patients are not represented on performance dashboards/reports. A full description of TARN eligibility criteria can be found at http://www.tarn.ac.uk/. Since 2012, submission of data to TARN has been mandatory for all trauma-receiving hospitals in the MTNs.
A large study of children’s injury patterns and mortality in England and Wales was conducted using TARN data from 1990 to 2005, before MTNs were implemented.6 After MTNs were established, TARN has produced two reports which focus on severe injury (ISS>15) from 2012 to 2014.7 8 This study provides a detailed description of moderate and severe children’s trauma (ISS>8) and spans the 5 years following the introduction of MTNs.
We describe the demographics, mechanisms, presentation, injury patterns and outcomes for children with moderate to severe injuries to inform service delivery, optimise resources and direct accident prevention strategies.
Methods
An anonymised data set was requested from TARN to include all children (aged <16 years) who suffered moderate to severe trauma (ISS>8) and were admitted to hospitals within the MTNs in England from 1 April 2012 to 31 March 2017, with any LOS. The time frame was chosen, as it covers the point at which the MTNs were implemented (2012) and 100% of trauma-receiving hospitals submitted data to TARN. March 2017 was the most recent data available at the time of request.
Health Research Authority (PIAG Patient Information Advisory Group, section 20) approval has been given for TARN to undertake research on anonymised data held on its database. Data cleaning checks were performed and through consultation with the study team, key patient descriptive variables were categorised a priori to adequately represent the data, combined with suitable groups to maximise sample sizes.
Age was categorised as <1 year (infants), 1–2.9 years (toddlers), 3–5.9 years (pre-school/reception age), 6–10.9 years (juniors/primary age), 11–13.9 years (younger teenage/middle school) and 14–15.9 years (older teenagers).
Injured body region was recorded as the most severely injured area categorised as: head, chest, spine, abdomen, limbs and pelvis, multiple or ‘other’ (such as frostbite, drowning, hypothermia, electrocution, hanging or asphyxia).
Injury severity. ISS9 range from 1 to 75 with a score of 9–15 denoting a moderate injury, and >15 indicating severe trauma.10
Outcomes were determined by a member of the clinical team on the day of discharge from hospital and recorded in the medical notes.
The Glasgow Outcome Score (GOS) records the degree of disability on discharge from hospital into five categories: death, prolonged disorder of consciousness, severe disability, moderate disability and good recovery.11 The GOS is sourced from the medical notes and recorded any member of the clinical team.
LOS was the number of days between admission and discharge from hospital.
Discharge destination is categorised as discharged; home; to another institution (eg, another hospital/rehabilitation unit); still an inpatient 30 days following admission or ‘unknown’.
SPSS Statistics V.23 was used to produce standard descriptive statistics such as percentages and frequencies to address the research aims. For each patient, the variables containing the unique injuries were aggregated to create a categorical variable representing all combinations of injuries experienced by patients in the data.12 These combinations were then used to categorise the injuries as isolated (one or more injuries affecting only one type of body part) or combined (injuries affecting more than one different body part).
Results
Data regarding 9851 injured children were included. Most (n=6755, 68.6%) were male and 1462 (14.8%) had a pre-existing medical condition. A bimodal age distribution relating to infants (<1) and children over 1 was observed (online supplementary figure 1). The median age was 6.4 years (SD 5.2). Boys were more frequently injured than girls at all ages, except for infants who showed similar frequency between boys and girls (695 males, 56.0% vs 545 females, 44.0%) (online supplementary table 1). Detailed data regarding the age, sex of injured children, the injured body parts and mechanism of injury are shown in online supplementary table 1.
Supplementary file 1
The most severely injured body part and mechanisms of injury
Infants
There were 1240 (12.6%) injured infants, 447 (36.0%) of whom were recorded as having suffered non-accidental injury (NAI) and suspected child abuse. They showed an injury pattern different from other age groups. The very youngest infants aged 0.1 year (36.5 days) were the most frequently injured of all ages (0–15 years) (online supplementary figure 1). Infants under 1 year suffered the most from head injuries (figure 1B), severe injuries (figure 1A) and mortality, and presented later than other age groups; during the evening rather than late afternoon (figure 2 and online supplementary figure 2B).
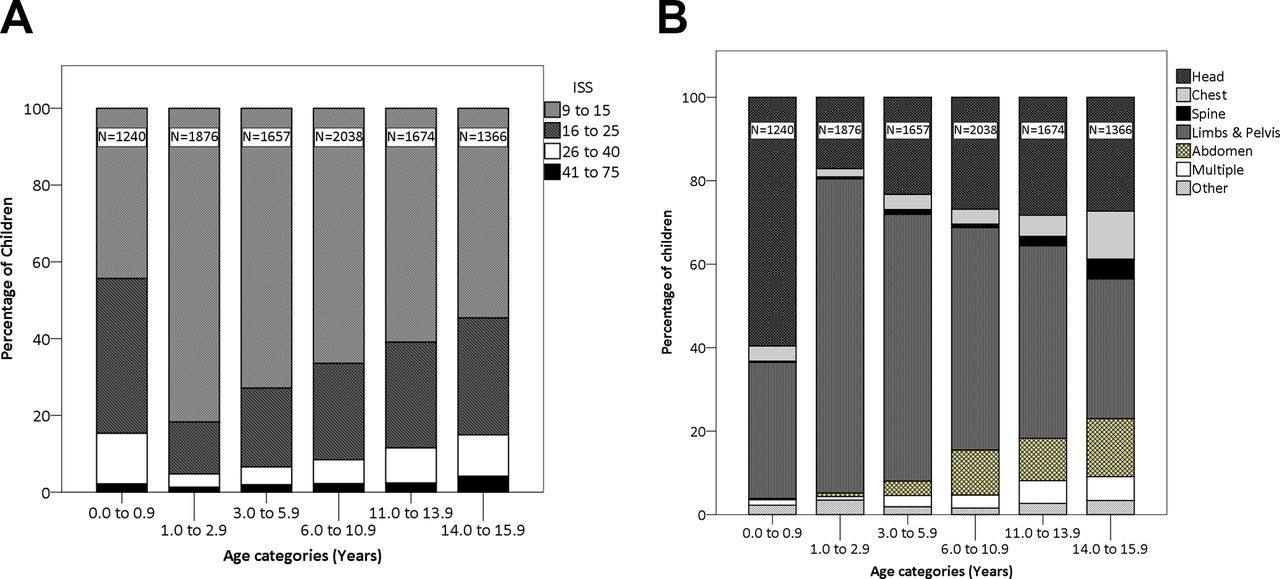
Panel (A) shows the injury severity according to age. Panel (B) shows the most severely injured body parts according to age. (Note: The figures at the top of each column represent the number of injuries in that column.) ISS, Injury Severity Score.

Radar chart to show time of presentation for different age bands.
All ages
The most frequently injured age category was primary/junior age children (6–10.9 years, n=2038, 20.7%) (online supplementary table 1). Toddlers suffered the lowest percentage of head injuries, after which the percentage increased with age. Limb injuries were most frequent in toddlers, which subsequently decreased with age. The proportion of children presenting with all other injured body parts increased with age, resulting in late teenagers presenting with the greatest variability in type of injury (figure 1B).
Injury mechanisms
Time of presentation
Children presented most frequently after school hours between 16:00 and 19:00 (figure 2) and at weekends (n=3150, 32.0%). Summer was the busiest season (n=3123, 31.7%), with fewest injuries occurring during the winter (1872, 19.0%).
Mechanisms of injury
The most severely injured body parts and mechanisms of injury are detailed in table 1. The home environment was the most common location where injuries occurred (n=3827, 38.8%), followed by the road (n=2251, 22.9%) and public areas (n=2227, 22.6%). Falls less than 2 m (falls <2 m) were the most common mechanism of injury (n=4227, 42.9%), followed by road traffic incidents (n=2926, 29.7%) and falls over 2 m (n=888, 9.0%). There were 212 (2.2%) penetrating injuries, including shooting (n=19, 0.2%) and stabbing (n=121, 1.2%). Blast injuries (n=6, 0.1%) and crush injuries (n=118, 1.2%) were the rarest types of mechanism. Stabbings occurred almost exclusively in boys. ‘Blows’ (n=819, 8.3%) and ‘other’ injuries (including burns, n=727, 7.4%) accounted for the remaining injury mechanisms. Road traffic incidents and falls <2 m were the most common injury mechanisms, which were most frequently associated with injuries to the limbs and pelvis, and head (table 1).
Nature of injuries
The median ISS for all injuries was 9.0 (SD 8.7). The limbs and pelvis (5190, 52.7%), followed by the head (2839, 28.8%), were most frequently the most severely injured body parts (table 1). Most (7336, 74.5%) injuries were isolated (affecting only one body part), and most frequently involved the limbs (n=4736, 48.1%), resulted from falls <2 m and were moderate (table 2). However, 2515 (25.5%) injuries were combined (affecting more than one body part). Head and limb injuries were one of the most common combinations. All combined injuries and those which were the most severe were due to road traffic incidents. Injury severity increased with the number of injured body parts.
Injury patterns, injury severity and mechanisms for isolated and combined injuries
Outcomes
Of those who survived, most children (n=7172, 72.8%) made a good recovery (as defined by the GOS on discharge from hospital); 595 (6.0%) had moderate disability, 334 (3.4%) had severe disability and 5 (0.05%) had a prolonged disorder of consciousness. The GOS was unrecorded for 1438 (14.6%). Most children (n=9152, 92.9%) were discharged home; 371 (3.8%) to another institution (eg, another hospital/rehabilitation unit). For 16 (0.2%) children, the discharge destination was unknown. Five children (0.05%) were still an inpatient in the MTC at 30 days following admission. The median LOS was 7.0 days (SD 21.1), 364 (3.7%) were readmitted to hospital after discharge. Three hundred and seven (3.1%) children died, most frequently from a head injury (n=147, 47.9%), 205 (66.8%) of whom were male. The median age of those who died was 7.0 (SD 5.8), but the most frequent (modal) age was <1 year. The median ISS for children who died was 26.0 (SD 13.5).
Discussion
The results of this study demonstrate that infants show an injury pattern different from older children in that they have the most severe injuries, the most frequent head injuries, and are the most frequently fatally injured. Many infants’ injuries (36%) are also recorded by the treating clinical team as suspected to be NAI and caused by child abuse.
For all ages, injures occur most commonly at home and are caused by falls <2 m. Most injuries are isolated, affecting the limbs. There is low mortality rate (3.1%), three-quarters of injured children make a ‘good recovery’ and nearly all are discharged home.
A key strength of this study is that it used comprehensive (all hospitals submit data to TARN, irrespective of their Major Trauma status) routinely collected clinical data from TARN from all of England over a lengthy (5-year) period with stringent quality control processes. Therefore, one can be confident that an accurate presentation of children’s trauma has been presented. However, data completeness can be variable. TARN monitors this by comparing the number of data submissions with the number of expected cases according to Hospital Episode Statistics, which highlights the cases that hospitals have either deemed not eligible or missed. Data completeness has improved over the period of the study, progressing from ~70% in 2012/2013 to ~90% in 2016/2017 (personal communication with TARN). However, the data are dependent on the accuracy of the original data entered and may therefore be open to observer and reporter bias. There may have been some under-reporting as it is not mandatory to enter data to TARN for patients who stay in hospital less than 3 days. This frequently occurs with injured children, as unlike adults, they have people and facilities already in place to be cared for at home. An additional limitation is that the accuracy of the data may be limited by observer and reporter bias. However, one would expect the impact of any individuals to be negligible in such a large data set.
The frequency of injures in infants was similar between boys and girls, presumably because infants were unlikely to be responsible for their own accidents; rather it is usually their parents. These findings are supported by previous reports13–15 and present a strong case for MTNs to continue to view injured infants with a high degree of suspicion of child abuse until investigations prove otherwise and to focus future accident prevention strategies on NAI in infants.
Infants tend to present later in the day (evening rather than late afternoon) than other age groups and the very youngest infants aged 0.1 year (36.5 days) are the most frequently injured of all ages. This coincides with the ‘crying cycle’ where the amount babies cry increases from the second week of life and peaks during the second month.16 There is an obvious demand to introduce measures to help parents understand and cope with this period such as those implemented by Barr et al.17 18
Major trauma injuries in other ages mainly affected boys, which is attributed to their greater tendency towards risk-taking behaviour,19–21 and occurred most commonly at home which may reflect a growing trend towards technology-based activities, structured lifestyles (eg, afterschool clubs), two-parent working families22 and parental concern about the risks associated with playing outdoors.23 Lower socioeconomic position has been identified as a risk factor for traumatic injury,24 the exact role this plays in home accidents is unclear, but lower education levels and lack of supervision may be a contributory factor.
Unlike previous studies,25–29 we found that falls <2 m, rather than road traffic incidents, were the most common cause of injury. This may be because our selection criteria included moderately severe injuries, rather than focusing solely on severe trauma.26–28 In the studies based in South Africa25 and West Africa,26 less stringent road safety laws may explain why road traffic incidents were the most common injury mechanism. While an American study using national data, also found road traffic incidents to be the most common injury mechanism, included children up to 19 years old who would be able to drive, our study excludes children 16 years and above (and thus all drivers).29
Peak demand for emergency hospital services is after school, over the weekend and during the summer. Healthcare services in the UK are often cited as being affected by ‘winter pressures’,30 but this study shows that Children’s MTNs experience ‘summer pressures’. Services should be configured to accommodate peak demands outside the ‘normal’ 9–5, 5-day working week and during holiday periods. This aligns with government plans for the National Health Service to provide a 7-day service so patients can access the same care at the weekend.31
As with other studies, limbs were the most frequently injured body part.6 29 However, one of the most severe was combined head and limb injuries. Such complex, multiple injuries require input from multiple specialties including orthopaedic and plastic surgeons, neurologists and neurosurgeons, and their management is often lengthy, costly and multifaceted requiring a collaborative, multispecialty approach. Further work to investigate the most effective way to deliver such an approach is warranted.
Most injured children made a ‘good recovery’, defined as the ‘resumption of normal life despite minor deficits’ according to the GOS11 assessed on discharge from MTCs/TUs. The GOS was developed to measure recovery in adults with severe brain injuries and to predict return to work and everyday life in broad categories ranging from ‘death’ to ‘good recovery/minimal disability’.11 Its use to assess short-term outcome in children with all types of injury has obviously limited validity. A more sensitive measure which addresses individuals’ activity and participation in the short, medium and long terms is needed to adequately inform service provision, act as a benchmark to improve services and prescribe the input to meet individuals’ needs, in addition to providing a global measure of outcome. In the UK, the Pediatric Quality of Life Inventory32 has been piloted as an alternative, but found to be unsuitable for the wide range of ages, injuries and disabilities seen in comprehensive children’s MTNs. Work is under way to develop a new assessment tool which will identify injured children’s impairment, activity, participation and their needs.
Conclusions
This study highlights the need for 7-day services, a multispecialist approach and more effective measures of longer term morbidity and outcomes in Major Trauma services. Infants show an injury pattern different from other age groups with more frequent, more severe and more frequently fatal injuries, often from suspected child abuse. Accident prevention needs to focus on this group.
Acknowledgments
We thank Lorcan Duane (consultant in Emergency Medicine, Royal Manchester Children’s Hospital, Manchester) for his interpretation of the data and insights into Major Trauma Networks. We also thank Thomas Lawrence (registry manager) and Antoinette Edwards (executive director) of Trauma and Audit Research Network (TARN), The University of Manchester, Salford, for their assistance with data provision and clarification of TARN processes.
References
Footnotes
Contributors ST contributed to the conception, design of the work, analysis/interpretation of the data and produced the manuscript drafts. MY has contributed to the acquisition of the data and data analysis. MG has contributed to data analysis and interpretation of the data. ND has contributed to the conception of the work and interpretation of the data. SJ contributed to the conception, design of the work, analysis/interpretation of the data and produced the manuscript drafts. All authors have been responsible critically appraising the work and approving the final version.
Funding This manuscript is an independent research supported by the National Institute for Health Research (HEE/ NIHR ICA Programme Clinical Doctoral Research Fellowship, SJ, ICA-CDRF-2016-02-021).
Disclaimer The views expressed in this publication are those of the author(s) and not necessarily those of the NHS, the National Institute for Health Research or the Department of Health.
Competing interests None declared.
Patient consent Not required.
Provenance and peer review Not commissioned; externally peer reviewed.
Data sharing statement Manchester Foundation Trust has a data sharing agreement with TARN, which permits the sharing of anonymised TARN data for research purposes. TARN data must only be viewed/analysed by agreed members of the research team and stored on a University of Manchester/Manchester Foundation Trust computer drive.
Collaborators Professor Fiona Lecky, Research Director of the Trauma and Audit Research Network (TARN). The collaborative group are the the TARNlet Committee from the Trauma and Audit Research Network (TARN).