Article Text

Abstract
Objective To compare the predictive performance of 18 paediatric early warning systems (PEWS) in predicting critical deterioration.
Design Retrospective case-controlled study. PEWS values were calculated from existing clinical data, and the area under the receiver operator characteristic curve (AUROC) compared.
Setting UK tertiary referral children's hospital.
Patients Patients without a ‘do not attempt resuscitation’ order admitted between 1 January 2011 and 31 December 2012. All patients on paediatric wards who suffered a critical deterioration event were designated ‘cases’ and matched with a control closest in age who was present on the same ward at the same time.
Main outcome measures Respiratory and/or cardiac arrest, unplanned transfer to paediatric intensive care and/or unexpected death.
Results 12 ‘scoring’ and 6 ‘trigger’ systems were suitable for comparative analysis. 297 case events in 224 patients were available for analysis. 244 control patients were identified for the 311 events. Three PEWS demonstrated better overall predictive performance with an AUROC of 0.87 or greater. Comparing each system with the highest performing PEWS with Bonferroni's correction for multiple comparisons resulted in statistically significant differences for 13 systems. Trigger systems performed worse than scoring systems, occupying the six lowest places in the AUROC rankings.
Conclusions There is considerable variation in the performance of published PEWS, and as such the choice of PEWS has the potential to be clinically important. Trigger-based systems performed poorly overall, but it remains unclear what factors determine optimum performance. More complex systems did not necessarily demonstrate improved performance.
- Resuscitation
- Intensive Care
- Monitoring
Statistics from Altmetric.com
What is already known on this topic?
Paediatric early warning systems (PEWS) are widely used to detect deterioration in hospitalised children.
The component parameters, weighting frameworks and scoring thresholds vary between differing PEWS.
Of the numerous PEWS in the literature and clinical practice, only a minority have been previously evaluated for their predictive performance.
What this study adds?
There is wide variation in the performance of PEWS.
There are no clear defining features which characterise the best performing PEWS.
The choice of PEWS may be an important factor in improving outcome for deteriorating hospitalised children.
Introduction
Timely detection of evolving critical illness makes it easier to treat. Paediatric early warning systems (PEWS) should alert staff to deteriorating children and accelerate access to appropriate intervention.1 Despite weak evidence,2 ,3 they are widely recommended.4–8 In 2013, 85% of UK centres caring for children were using PEWS.9
Early warning systems are either ‘score’-based or ‘trigger’-based. Score-based systems assign values to vital signs (or other parameters), describing the variance from normal. These component values are then combined into an overall score. Higher scores should indicate reduced physiological reserve and prompt an escalating series of actions, culminating in senior clinician or rapid response team (RRT) review. The simpler ‘trigger’-based systems contain thresholds for parameters without combining into an overall score. Again, actions such as RRT review are often mandated. Scoring systems provide a more continuous description of the degree of abnormality in the child's physiological state compared with binary ‘all or nothing’ trigger systems.
The logic of standardised risk assessment is compelling, but the majority of PEWS have been developed using expert opinion alone. Comparative data are lacking on the relative performance of the 31 different published PEWS. Only a minority of these (14) have undergone any assessment of predictive validity.1 ,10 Only one study compared the performance of multiple (3) scores.11 Comparisons across studies are confounded by variance in the setting, methodologies and outcomes described.2
Some might argue that the lack of validation or performance data is a secondary issue since the implementation of any system is the most important step. A system provides a structure for communication and builds consideration of risk of deterioration into daily practice. The alternative view is that the validity and calibration of any score are essential for utility. A score consistently providing false alerts while missing critical deteriorations elsewhere carries potential for harm by triaging resources incorrectly and increasing response times through ‘alarm fatigue’.12 Systems have to balance specificity and sensitivity, and so the precision of the thresholds included may be crucial.
We undertook a study comparing the performance of 18 PEWS in predicting critical deterioration in a UK tertiary referral children's hospital. Our null hypothesis was that the scores would show equivalent areas under the receiver operating characteristic curves.
Methods
Evaluation of predictive validity
We undertook a retrospective case–control study of patients below 19 years of age, without a ‘do no attempt resuscitation’ order, who were admitted to our tertiary specialist children's hospital between 1 January 2011 and 31 December 2012. All patients who suffered a respiratory and/or cardiac arrest, unplanned transfer to paediatric intensive care unit (PICU) and/or unexpected death on the ward were designated ‘cases’. They were identified from local data collected for the Paediatric Intensive Care Audit Network (PICANet) database,13 the hospital resuscitation database and cross-referenced against intensive care admission records. Case patients present on the ward for <2 hours before the event were excluded, as this was considered the minimum time for the child to be assessed, clinical signs recorded and action to be taken.
Case patients were each matched with a single control, present on the same ward at the same time. Wards were considered a proxy match for diagnostic specialty. The child closest in age to the case patient was identified. To ensure at least one set of observations could be extracted, control patients present on the ward for <24 hours were excluded, with the exception of wards classified as providing short stay/day case care where the threshold was 4 hours. Patients previously entered into the study were eligible to act as a control, provided they did not suffer a critical deterioration event within the following 48 hours. If healthcare records were unavailable or the vital sign record was missing, the patient was excluded and a new control was sought using the same procedure.
Data extraction
Clinical data were extracted from the healthcare record of case patients for a period of 48 hours before the critical deterioration event. The final hour of data before the deterioration event in the case patient was excluded to establish if the PEWS could identify critical deterioration with at least 1 hour's notice. Data from controls were extracted for the same 47-hour period. Data were extracted by a single researcher (SC) using a standardised pro forma. Vital signs were extracted as continuous variables. Respiratory effort was assessed retrospectively as mild, moderate or severe using standardised criteria.14 Dichotomous variables were assessed using the criteria in online supplementary table S1.
supplementary tables
At the time of the study, standard protocols were in place for recording and documenting vital signs, which nurses were informed of at induction and yearly intervals thereafter. The protocol mandated recording of a full set of vital signs within 2 hours of the start of the 12-hour shift. Elevated PEWS scores required repeat vital sign recording after 30 min. Ongoing frequency of recording was at the discretion of the bedside nurse.
Identification of PEWS
PEWS were identified through our recent systematic review.2 We excluded a priori PEWS where vital signs were assessed subjectively or against individual patient baseline values. Components of the remaining systems were reviewed to confirm that they could be extracted from the healthcare records. Criteria for data extraction were developed for included parameters (see online supplementary table S1) together with the weighting framework for scoring systems. Minor inconsistencies such as overlapping age bandings were modified in a consistent manner to facilitate score calculation (see online supplementary table S2). Our hospital's local unpublished PEWS (Children's Early Warning Score (CEWS)) were also included (see online supplementary table S3).
PEWS score calculation
Data were electronically checked for internal consistency and manually checked for accuracy. Inconsistencies were resolved by reviewing the data extraction proforma and healthcare records.
A recording of one or more vital signs was considered an observation data set. The PEWS value for each system was calculated for each observation data set. Missing observations were presumed to be normal (score 0), consistent with clinical practice and the methodology of previous studies.11 ,15 ,16
Data analysis
Analysis was performed using SPSS and R (http://www.cran.r-project.org). The maximum observed value for each PEWS for each patient in the 47 hours before the event was used in the comparison. Characteristics of cases and controls were compared with the Mann-Whitney U-test for continuous variables and χ2 for categorical variables. Sensitivity, specificity, positive predictive value (PPV), negative predictive value (NPV), likelihood ratio positive test and likelihood ratio negative test were calculated. The area under receiver operator characteristic curves (AUROC) was calculated for each PEWS and compared with the best performing system using Delong’s test for correlated curves.17 Significance testing was adjusted for the multiple comparisons of AUROC with Bonferroni's correction, meaning values of p<0.0025 were considered significant.
The score that maximised sensitivity and specificity for each scoring system was identified as the optimal score.18 The number of case and control patients who would be correctly and incorrectly identified at this threshold was calculated.
Results
Characteristics of the identified PEWS
Thirty-one PEWS were identified by the systematic review.2 Seven contained parameters requiring subjective assessment, six required knowledge of the baseline vital signs and one inadequately described the component parameters: these were excluded. The remaining systems plus our local CEWS resulted in 18 PEWS. Systems with the same name were numbered in order of publication to distinguish between them (table 1).
Key characteristics and parameters
Twelve PEWS were ‘scoring’ and six were ‘trigger’ systems. The number of component parameters varied from 3 to 19. Some systems combined two or more variables within a single parameter, for example, oxygen therapy and saturation values. Forty variables, either alone or in combination, were identified.
Vital signs were prominent. All 18 PEWS included heart rate and respiratory rate, 13 included oxygen saturation (72%) and 11 blood pressure (61%). Temperature was a component of only seven systems (39%). Five weighting frameworks were identified across the 12 scoring systems, with 3 PEWS also incorporating additional points for risk factors. Differences between systems were often minor. The maximum scores varied from 7 to 32 (table 1).
Patient characteristics
We identified 319 critical deterioration events. In eight episodes, the patient was present on the ward for <2 hours, leaving 311 eligible critical deterioration events in 237 patients. A total of 14 case patient records were missing, leaving a case sample of 297 events in 224 patients. A total of 244 control patients were identified for the 311 events.
Overall, 13 551 observations sets were performed, 8360 on cases and 5191 on controls. The median number of observation sets per patient per day was 13 for cases and 6 for controls. Only 36.4% of observation sets contained the five vital sign parameters and assessment of consciousness required for complete recording of the local PEWS.
Case patients were more likely to be female (56.3% vs 46.3%, p=0.009), have been admitted as an emergency (64.6% vs 39.2%, p≤0.01) and have a longer hospital stay (median 57.1 vs 35.9 days, p≤0.01). Mortality was also higher for case patients at 24 hours, 30 days and hospital discharge (p≤0.001). A summary of patient characteristics is shown in table 2.
Patient characteristics (each patient episode)
A total of 186 (62.6%) critical deterioration events were categorised as unplanned transfers to the PICU, 84 (28.3%) respiratory arrests and 27 (9.1%) cardiac arrests. Thirty-one patients remained on the ward after a cardiac or respiratory arrest. Six patients died before transfer to intensive care.
Predictive performance
Three PEWS demonstrated better performance overall (table 3). Comparing each system with the highest performing PEWS resulted in statistically significant differences for 13 systems. Overall trigger systems performed worse than scoring systems, occupying six of the lowest seven places in the AUROC rankings.
Comparative performance
Sensitivity, specificity, PPV, NPV and positive and negative likelihood ratios for the optimal score are given in table 4. Values for trigger systems represent the breech of one or more trigger thresholds.
Performance at optimal score
Trigger systems demonstrated better sensitivity (range 0.90–0.96) than scoring systems (range 0.46–0.83), but worse specificity (range 0.28–0.56 vs 0.65–0.91, respectively).
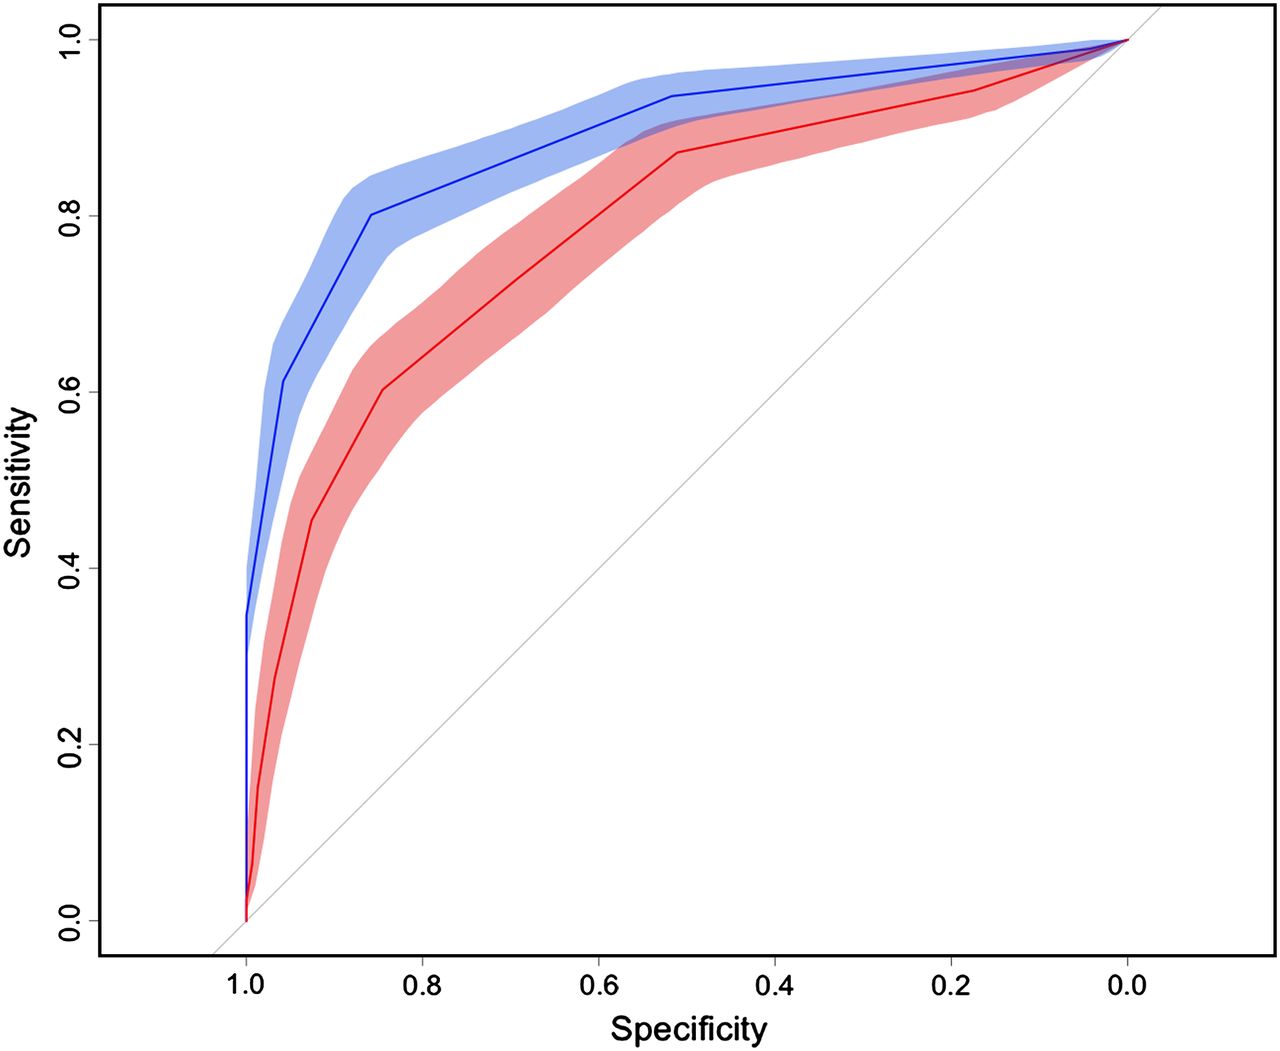
Our local PEWS performed modestly, ranked 10th overall. Comparison with the highest performing PEWS demonstrates the significantly worse predictive ability (figure 1). At the optimal score, the Cardiff and Vale PEWS would correctly identify 59 more deteriorating patients than our local PEWS, with only 4 additional false alerts.

Comparison of AUROC of the highest performing PEWS and the local PEWS. The receiver operator characteristic curve of the local system (CEWS, AUROC 0.79) is shown in pink. The highest performing system (Cardiff and Vale PEWS, AUROC 0.89) is shown in blue. Shaded areas represent the 95% CIs for each system. AUROC, area under the receiver operator characteristic curve; CEWS, Children's Early Warning Score; PEWS, paediatric early warning system.
PEWS demonstrated the ability to detect children at risk of critical deterioration a significant time before the event. Median time from optimal score18 to event ranged from 17 hours (IQR 6.8–35.7) to 39.5 hours (IQR 17.4–46.6) for patients correctly identified by scoring systems. Longer times were demonstrated by trigger systems: 27.9 (IQR 13.7–42.4) to 39.8 hours (IQR 23.8–46.2), reflecting the increased sensitivity (table 4).
Discussion
The choice of PEWS is potentially important. Effective identification of ‘at risk’ children is crucial, but a poorly validated system may also erode staff confidence, waste valuable resources and overburden staff with false alerts. This study found that performance varied widely. Eight PEWS were good predictors, nine were useful and two poor.33 Score-based systems consistently outperformed trigger systems. A larger number of parameters did not appear to improve performance, for instance, the two lowest ranked systems had 16 and 14 parameters, respectively, compared with 8 parameters of the highest ranked system.
The Cardiff and Vale PEWS, Bedside PEWS and Modified PEWS III performed better than the majority of scores, but with no significant differences between them. There were no obvious reasons why these systems outperformed the others. All three systems included heart rate and respiratory rate, oxygen saturation and blood pressure.
At the optimal score, scoring systems demonstrated poorer sensitivity, but superior specificity than trigger systems, which may reduce false alerts and build clinician confidence. Lowering the scoring thresholds improves sensitivity, creating additional opportunities to intervene and potentially improve outcome.34 The ability to select the threshold that balances sensitivity and specificity most appropriate to the local environment gives scoring systems some advantages. However, they are more complex to use, carrying the risk of inaccurate calculation35 ,36 and inappropriate response.37 ,38
The current local PEWS performed only modestly, despite being developed by local clinicians, using local data and expertise. It was considerably outperformed by systems externally validated in similar and differing populations. We have no reason to believe our situation is unique. It is likely that many other locally developed unvalidated PEWS would demonstrate similar performance if evaluated rigorously. We are considering changing to the Bedside PEWS as it has now been evaluated in similar populations, is subject to an international multicentre trial10 and demonstrated equivalent performance with the top-ranked PEWS. This may facilitate further collaborative research in the future.
All PEWS demonstrated the ability to identify deteriorating children a number of hours before the event. Median hours from optimal score to critical deterioration event varied from 17.0 to 39.5 hours for scoring systems and 27.9 to 39.8 hours for trigger systems. This is longer than previous study findings for comparable scoring thresholds.16 Both scoring and trigger systems can act as important ‘early warning’ to front-line staff of ward-based children at risk of critical deterioration, but require appropriate escalation and intervention by healthcare staff. Studies have identified that this may not always be achieved in practice.6 ,39 ,40
Limitations
Values for PEWS were calculated retrospectively from data extracted by a single researcher who was not blinded to the patient's outcome. Although standardised criteria were applied, there was no other verification of data and accuracy of documented vital sign values, and other observations could not be tested. Administration of a fluid bolus could not be reliably extracted affecting three of the PEWS.15 ,20 ,27
Data sets were frequently incomplete. Missing values were assumed to be ‘normal’ (score 0), but a recent study identified a greater proportion of incomplete data sets were associated with ‘critical’ (elevated) score compared with complete data sets.36 Incomplete vital sign recording remains a problem in clinical practice21 ,41 and may underestimate PEWS performance.
The study was conducted in a tertiary specialist children's hospital without an emergency department. Results may not be generalisable to children in other settings. Different results may also be seen for different outcomes and combinations of outcomes. Greater standardisation of reporting and consensus on pragmatic measures to evaluate PEWS and other similar interventions would facilitate meaningful comparison and collaborative research.42
Conclusion
The choice of PEWS may be important. Trigger-based systems performed poorly overall, but it remains unclear what factors determine optimum performance. More complex systems did not necessarily demonstrate improved performance. Variation in performance has important implications for effective identification of children ‘at risk’, staff confidence in the system and effective use of resources.
It is likely that many other hospitals have developed their own systems without rigorous evaluation of their validity.43 The high and increasing number of both published and unpublished PEWS raises concerns that paediatrics may be following a path similar to that of adult track and trigger systems, with multiple poorly validated systems with unknown predictive power. This may explain why studies of PEWS and rapid response systems have so far failed to deliver the expected benefits.
References
Footnotes
Twitter Follow Samiran Ray @DrSamRay
Contributors SMC and MJP conceived the idea for the study. SMC, JW, KO and MJP contributed to the study design. SMC undertook the data collection. SMC, SR and MJP undertook the data analysis. SMC wrote the initial draft of the manuscript. All authors reviewed and revised the manuscript and approved the final draft.
Funding This study received no direct funding but was supported by the National Institute for Health Research, Biomedical Research Centre at Great Ormond Street Hospital for Children, NHS Foundation Trust and University College London.
Competing interests None declared.
Provenance and peer review Not commissioned; externally peer reviewed.