Article Text

Statistics from Altmetric.com
This is the sixth in a series of reviews of statistics about the health of children, collated from routine data. There were approximately 12 million children aged under 16 years in the UK in 1995. This paper looks at the changing demography of the UK, comments on recent trends in infant and childhood mortality rates, and looks at the prevalence of some common chronic diseases of childhood. Social trends, such as breast feeding patterns, family type, and current education provision are described. The proportion of children with special educational needs and on child protection registers is also discussed.
Demography
The population of the UK in 1995 was approximately 58 million. This represents a population increase of two million since 1986.1 Over the same period, the annual live birth rate has fallen from 13.3 per 1000 (1986) to 12.5 per 1000 (1995), and the annual death rate has fallen from 11.6 per 1000 (1986) to 10.9 per 1000 (1995).1 In England and Wales, 7.3% of all live births weighed less than 2500 g at birth.2 Migration has reduced only marginally, from 250 000 (1986) to 245 000 in 1995.1 Figures on emigration are not collected. Table 1summarises the demographic changes seen in the last 10 years in the constituent countries of the UK; England has the highest birth rate and the lowest death rate within Great Britain. Table 2 shows the 1995 mid-year population estimates for the constituent countries of the UK.1 Currently, approximately 20% of the population of the UK are under 16 years of age with little variation across the constituent countries. Population projections into the next century predict that this will fall to 18% by 2011.1 Table 3gives an international perspective, comparing birth and death rates, and life expectancy for 14 countries. However, the rates quoted in table 3 are crude rates, and adjustment for the age distribution of the population will make a difference.
Demographic changes in the constituent countries of the UK, 1986–95
Mid-year population estimates for males and females (in thousands) for the constituent countries of the UK, 1995
Birth and death rates and life expectancy, 1994
Table 4 shows that, between 1986 and 1994, life expectation at birth has improved by two years for both males and females.1However, there are differences between countries within the UK, with infants born in Scotland having, in 1994, only the life expectancy seen in England and Wales in 1986.
Improvement in life expectation at birth for males and females, the constituent countries of the UK, 1986–94
FERTILITY PATTERNS
There were 648 000 live births in 1995 in England and Wales,2 60 000 in Scotland,4 and 23 860 in Northern Ireland.5 These figures continue the decline started in the 1980s. Two factors are contributing to the decline in births; (a) women are older when they start their family; (b) women are having fewer children, possibly as a consequence of delaying the start of a family; with an increasing proportion remaining childless. In England and Wales, the mean age at first birth in 1995, has risen to 26.7 years, and the mean age of all women at childbirth rose to 28.5 years, the highest for 45 years.2 Figure 1shows the age specific fertility rates for the last 20 years. Although women aged 25–29 years remain the most fertile, the fertility rates among women aged 30 years and older are rising, while those in younger women are falling; the rate in women age 30–34 years is now higher than that in women age 20–24 years. The net effect is of smaller average completed family size. Women born in the 1930s had, on average, 2.45 children each; for women born in 1955, this has dropped to 2.00 children each, and projections suggest that women born in the late 1960s are likely to have an average family size of 1.85.6Approximately 10% of women born in the 1930s remain childless; for those born in 1949, 13% remained childless at age 45 years.7 This figure is rising, with rates of up to 25% of women with no children predicted.6 Infants of older mothers have a higher infant mortality and a higher proportion have congenital anomalies when compared with infants of younger mothers.
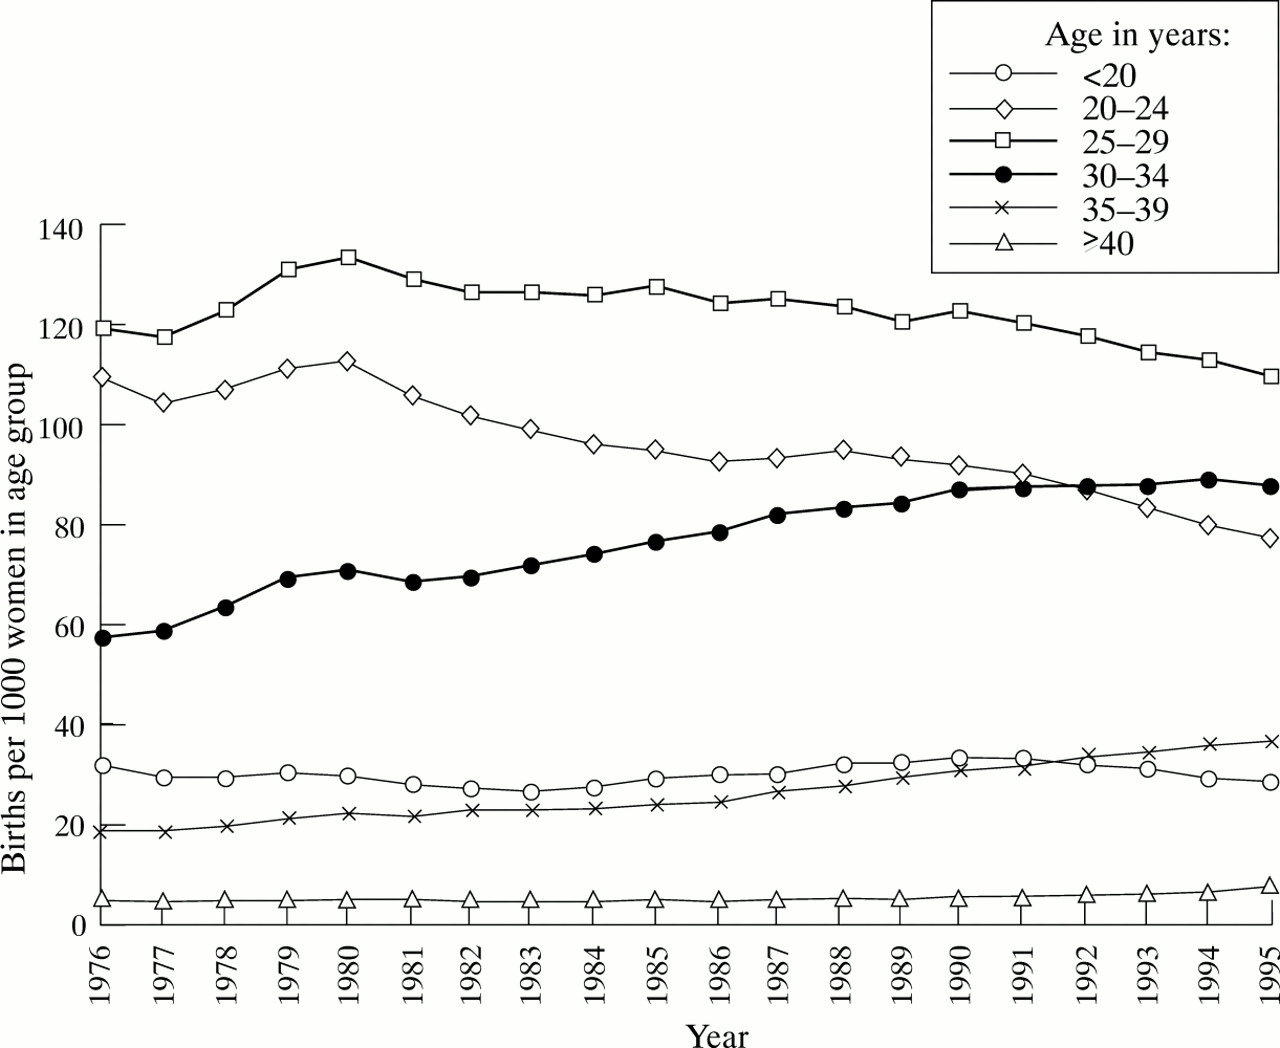
Age specific fertility rates, England and Wales, 1976–95 (source: Office for National Statistics2).
Despite this, the conception rate among teenagers has increased slightly in 1995. Among girls under 16 years in England and Wales, the rate increased from 8.3 conceptions per 1000 females aged 13–15 years in 1994 to 8.5 conceptions per 1000 females aged 13–15 years in 1995. Half of these conceptions were terminated by abortion.8Among older teenagers, there was a similar increase, to 58.7 conceptions per 1000 females aged 15–19 years in 1995.8However, use of family planning clinic services by young people has increased considerably over the last five years; in 1990–91, 3.4% of girls aged 14 and 15 years used the family planning clinic service, the uptake rate in this age group has now increased to 10.2%. Among girls aged 16–19 years, over the same period, the proportion using the family planning services rose from 12.2% to 18.9%. About a half of girls aged 14 and 15 choose oral contraception, the rest use condoms.9
Multiple births have increased over the last 20 years, with a rate in 1995 of 14.1 per 1000 maternities, compared with 9.9 per 1000 maternities in 1975.10 As the birth prevalence of multiple births is highest among women aged 35–39, part of this increase is due to the changing pattern of age specific fertility rates described above. However, comparison of the age standardised multiple maternities rate shows a true increase, from 9.9 per 1000 maternities in 1975, to 12.6 per 1000 maternities in 1995.10 Calculations based on the Weinberg assumption, used to estimate the proportion of monozygotic twinning, shows that this increase is entirely among dizygotic twins.10
Figure 2 illustrates the further increase in 1995 of the proportion of all live births occurring outside of marriage. However, as is also shown in fig 2, this is compensated by the increase in joint registration from the same address; suggesting that couples in stable relationships, who previously would have married, are now choosing to remain unmarried, but are none the less starting families. This is confirmed by statistics on marriage rates, which have fallen substantially in the last 10 years, from 44.6 per 1000 single population in 1986 to 31.8 per 1000 single population in 1995 (first marriages). The remarriage rate has also fallen, from 90.8 per 1000 divorced population in 1986 to 56.1 per 1000 divorced population in 1995.1 The proportion of births solely registered by the mother, an indication of an unsupported mother, has remained stable over the last 10 years.2
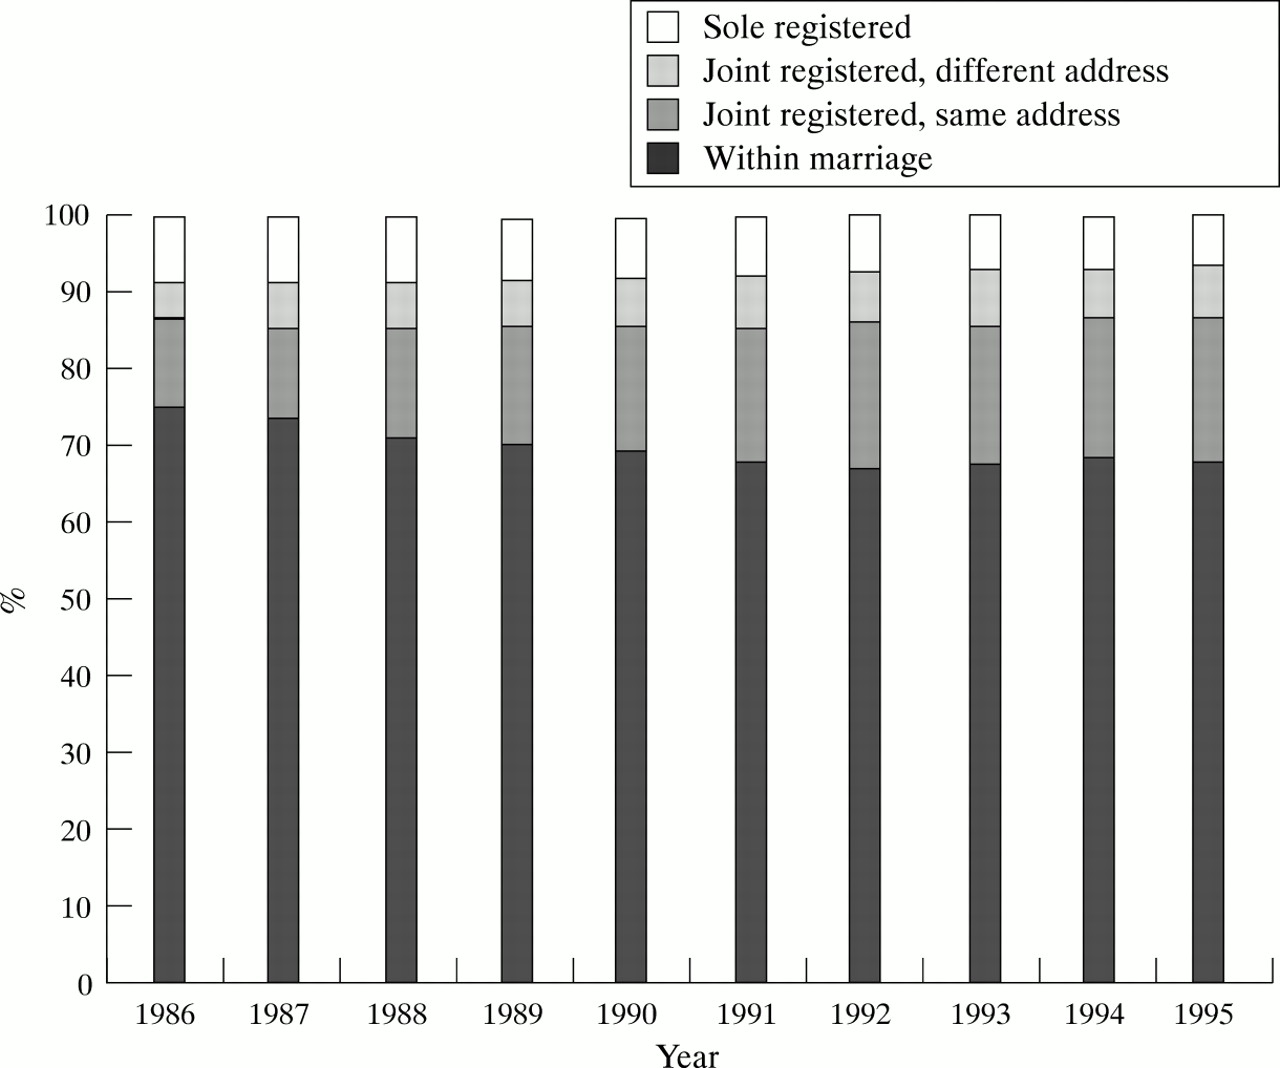
Registration of births, England and Wales, 1986–95 (source: Office for National Statistics2).
Mortality
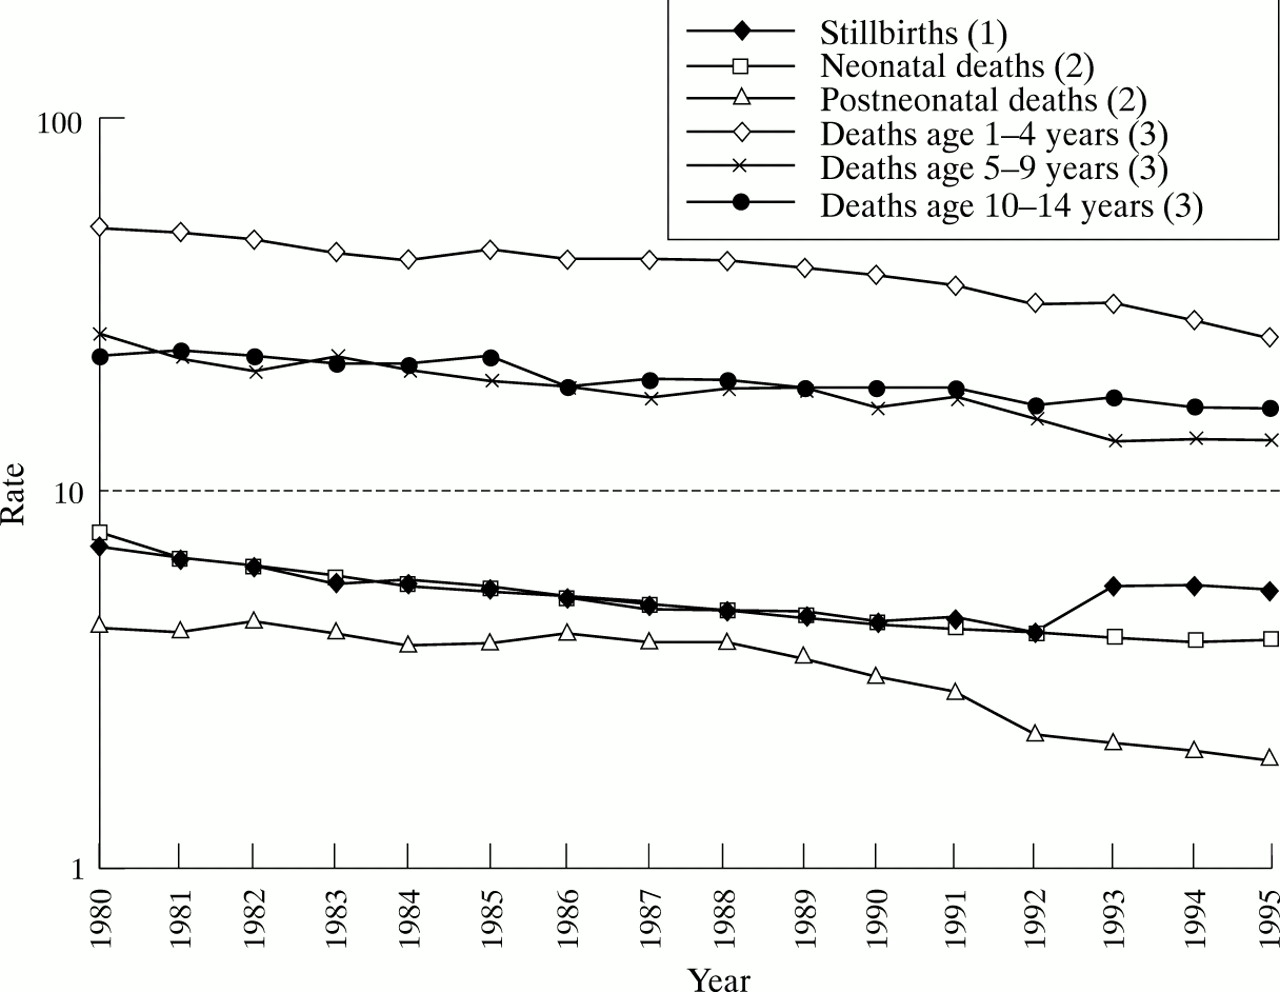
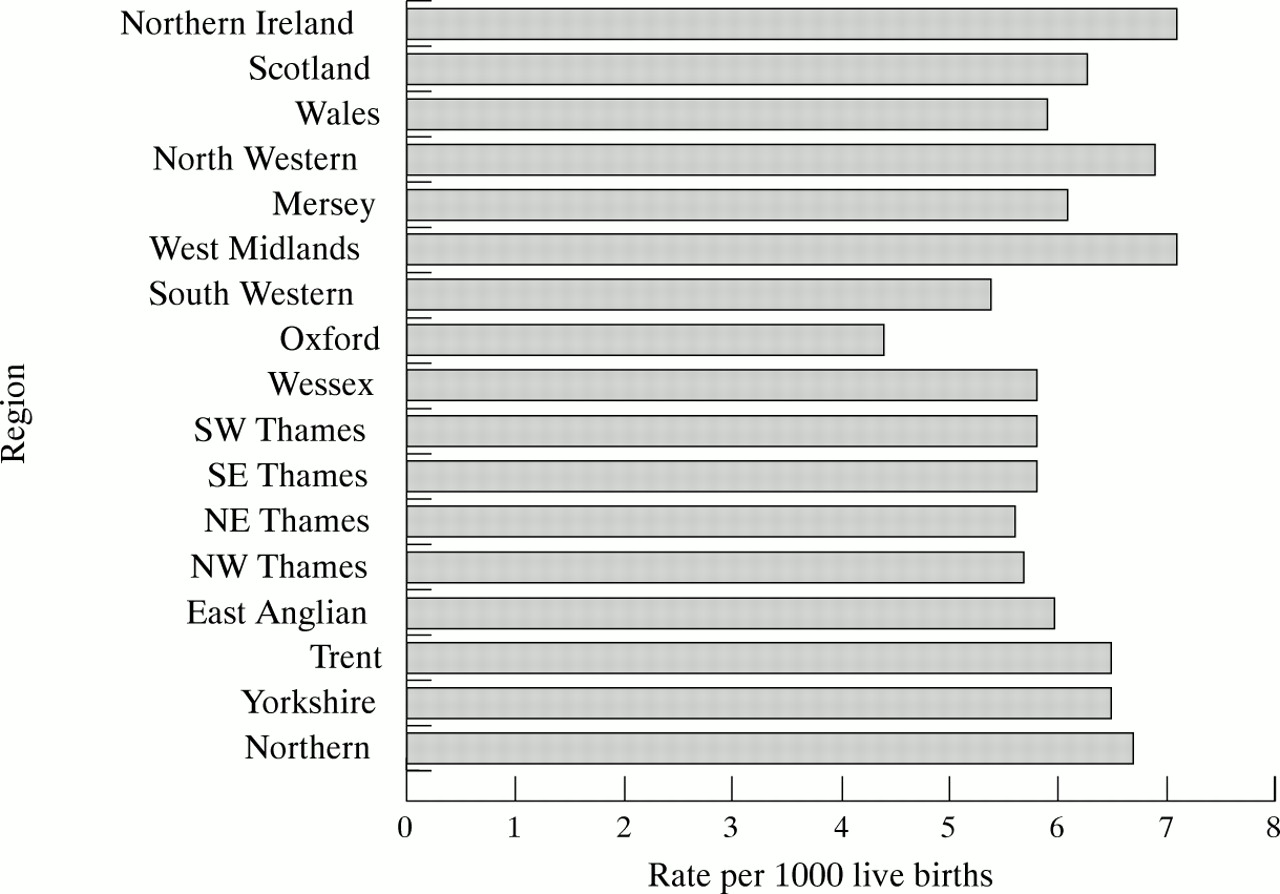
Table 5 shows the death rates among children under 15 years in the constituent countries of the UK, and table 6 shows the rates of infant deaths for the constituent countries of the UK. Rates of death in all age groups have fallen over the last 15 years (fig 3) (except the stillbirth rate, but this reflects the change of definition, from 28 to 24 weeks gestational age, introduced in 1992). The rate of decline in stillbirths and neonatal death rates are similar, and is evident over the whole period. In contrast, postneonatal mortality remained constant until the late 1980s when a decline becomes evident, coinciding with the growing trend of lying infants on their back to sleep. Among older children, the mortality rate in those under 5 remains higher than in older children, but in all age groups, the decline seen over the period is similar. Figure 4 shows the regional variation in infant mortality in the UK, with Oxford region having a rate 38% lower than that in the West Midlands.11
Death rates among children under 15 years in the constituent countries of the UK, 1995
Death rates among children < 1 year in the constituent countries of the UK, 1995

Time trends in mortality rates among children, England and Wales, 1980–94; (1) per 1000 total births, (2) per 1000 live births, (3) per 100 000 population of the same age (source: Office for National Statistics11).

Regional variations in stillbirth and infant mortality rates, UK, 1994 (source: Office for National Statistics11).
INFANT MORTALITY
There were 3982 deaths among infants during 1995. Mortality rates among infants are affected by both clinical and social factors. Table 7shows the birthweight specific mortality rates for 1995. The mortality rates in small infants, that is those weighing less than 2500 g at birth, continue a year on year decline while the rates in larger infants are stable. Extremely small infants (weighing less than 1000 g at birth) have five times the risk of death of infants weighing 1000–1499 g, with little more than half of liveborn infants weighing less than 1000 g surviving to their first birthday. Infants weighing 1000–1499 g have three times higher mortality risk than infants in the next weight group (1500–1944 g), yet over 90% of these liveborn infants survive to their first birthday. Small infants are likely to be premature and at risk from the consequences of prematurity; are more likely to have congenital anomalies, and are more vulnerable to infections and sudden infant death than infants of normal birth weight.11 The risk of infant mortality with maternal age shows a U shaped pattern, with infants of teenage mothers, and of mothers over 35 years at higher risk. Figure 5 compares infant mortality by social class of father, for married parents and jointly registered births; for all classes, the infant mortality is lower among infants born to married couples. It is unclear whether this association is due to bias in reporting, for example, father’s occupation, or a true reflection of environmental influences.
Birthweight specific mortality rates, England and Wales, 1995
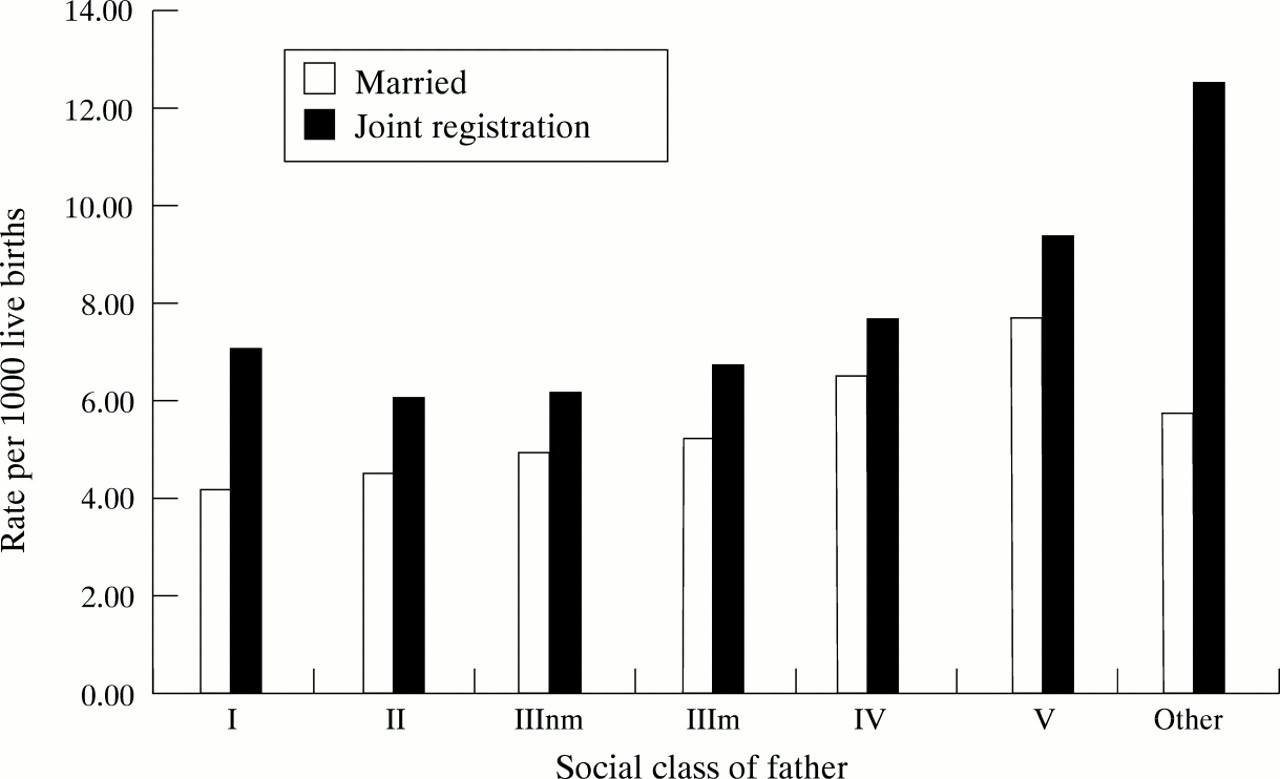
Infant mortality rates by social class of father, inside marriage and joint registrations, 1995; figures based on a 10% sample for fathers’ occupation (nm = non-manual, m = manual; source: Office for National Statistics11).
Although the infant mortality rate continues to decline, the Confidential Enquiry into Stillbirths and Deaths in Infancy (CESDI) review of 1270 infant deaths occurring between 1 January 1994 and 31 December 1995 reported that two thirds of these were considered to have involved ‘suboptimal care’, which may have made a difference to the outcome. Most of these related to intrapartum care.12
CHILDHOOD MORTALITY
Death in childhood beyond the first year of life is rare. During 1995, 1907 children (aged 1–15 years) died, with 1100 (58%) deaths among boys. Mortality in childhood has been declining for many years, and the rates shown in table 5 are the lowest ever reported. The five main categories of cause of death, accounting for over 75% of deaths are shown in table 8. Accidents and poisonings are responsible for 33% and 21% of deaths in boys and girls respectively.11
The main causes of death for young people aged 1–15 years, England and Wales, 1995; values are number (%)
Morbidity
There are three major routine sources for data on ill health in children: the communicable disease statistics,13 the cancer registration statistics,14 and the congenital anomaly statistics.15 Data are also routinely available on immunisation uptake rates. The Department of Health has recently published statistics from the General Practice Research Database (GPRD), collected from 413 practices throughout England and Wales, covering a population of 2.9 million patients.16 These data enable an estimate to be made of the prevalence of common chronic diseases and table 9 shows estimates of the prevalence of asthma and diabetes in children in England and Wales. The GPRD also provides a measure of prescriptions issued in general practice: 6819 prescriptions per 1000 patient years at risk were issued to boys aged 0–4 years (and 6290 per 1000 patient years at risk for girls aged 0–4 years). A third of these prescriptions were for infections. Older children, aged 5–14 years had half the number of prescriptions.16 This only measures prescriptions issued; whether the parents have them filled and administer the medicines to the children cannot be assessed.
Estimates of the prevalence (with 95% confidence intervals) of asthma and diabetes mellitus in young people by age and sex (rate per 1000) England and Wales, 1994
CANCER IN CHILDREN
Although one of the commonest causes of death among children (see table 8), cancer is still a relatively rare condition. There were 786 reported new cases among males aged under 15 years in 1990 (16.0 per 100 000), the latest year for which figures are available.14 Among girls, there were 617 reported cases (13.3 per 100 000). Leukaemia is common, particularly in children age 1–4 years, among whom boys have a incidence rate of 7.4 per 100 000 and girls a rate of 6.6 per 100 000. Older children, age 5–9, have approximately half the incidence, and children age 10–14 have a further halving in the incidence.14 Other common sites of cancer in children are the kidney, with an incidence among those aged 1–4 years of 2.4 per 100 000 boys and 1.9 per 100 000 girls, and brain, with an incidence of about 2 per 100 000 from 1–14 years, with no gender differential.
INFECTIOUS DISEASE NOTIFICATIONS AND IMMUNISATION RATES
Notification for infectious diseases for which immunisation is routinely available have recently fallen rapidly. In England and Wales, in 1995, there were only 7447 cases of measles, 6196 cases of rubella, and 1936 cases of mumps notified. Most of these cases were in children.13 Immunisation uptake remains high, with 93% of infants completing their primary immunisation courses in diphtheria, tetanus, polio, and Haemophilus influenzae b, by the end of their first year, and 92% completing the course in measles, mumps, and rubella. Uptake rates vary by district, but only one district reports uptake rates of less than 90% by aged 2 years for diphtheria, tetanus, polio, and H influenzae b, and 80% of districts report uptake rates of over 95%. A further 17 districts have uptake rates for measles, mumps, and rubella of less than 90%.17
Data on infection related to food poisoning, but not the organism responsible, are routinely collected. For 1995, children under 5 years had the highest notification rate for food poisoning, at 346 cases per 100 000 population, double the rate reported in any other age group. This may, in part, be due to surveillance/reporting bias, that is, the rate in all age groups may be similar, but it is more likely to be diagnosed in children under 5 years as they may be more likely to present to health care services with symptoms than older children and adults.
Meningitis remains the commonest infectious disease to cause fatalities in children. There were 1246 cases reported in 1995 among children under 15 years of age, 37% (467) occurring in infants. Neisseria meningitidis remains the most common organism associated with meningitis in young people.13
CONGENITAL ANOMALIES
There were 5573 infants with congenital anomalies born and reported in 1994, a rate of 83.4 per 10 000 total births.15 Although the overall congenital anomaly registration rate has declined over that last decade, the fall from 85.4 per 10 000 in 1993 suggests that the decline is now tailing off. Figure 6 shows the relationship between terminations of pregnancy for congenital anomalies and the reported birth prevalence rate for Down’s syndrome and neural tube defects (NTDs). For both conditions, from 1990–93, the reported prevalence declined, but the number of terminations rose. However, in 1994, the reported birth prevalence of both Down’s syndrome and NTDs has levelled. Although the terminations for chromosomal anomalies has also levelled, the number of terminations for NTD fell by nearly 12% in 1994.15 This may reflect a decrease in the incidence of NTDs, possibly relating to an increased in the use of folic acid supplementation in the periconceptional period.

Terminations of pregnancies for abnormality in the fetus, 1990–94, England and Wales (source: Office for National Statistics15).
DENTAL HEALTH
The British Association for the Study of Community Dentistry (BASCD) dental epidemiology programme examined the teeth of 172 659 children (24% of 5 year olds) in the UK in 1995–96, and measured the prevalence of decayed, missing, and filled teeth (d3mft). A care index, the proportion of all d3mft which are filled, is calculated.18 Table 10 summarises the d3mft and care index for the constituent countries of the UK (including the Isle of Man). Although the rates for England are the lowest, this hides the wide variations seen within the country; with the highest d3mft (2.41) and the lowest care index (8) in the North West region, compared with a d3mft of 1.08 in the West Midlands, and a care index of 20 in North Thames. Most of the water in the West Midlands is fluoridated.
Mean d3mft and care index among 5 year old children surveyed in the BASCD dental epidemiology programme, UK, 1995–96
Social habits
BREAST FEEDING
There has been a survey of breast feeding practices in the UK carried out every five years since 1975. The incidence of breast feeding in England, that is the proportion of all infants who were initially breast fed, has increased over this period. In 1975, just 51% of infants were breast fed, but this has risen steadily to 68% in 1995.19 Breast fed infants are more likely to be first born infants, and women who breast fed a previous infant for six weeks or more are more likely to breast feed a second or subsequent child. Breast feeding mothers are also more likely to have continued their education beyond age 18 years, and have a partner with a non-manual occupation. These same factors are also associated with duration of breast feeding. Geographic variations show that while 76% of infants living in London and the south east are breast fed, only 55% of those living in Scotland, and 45% of those in Northern Ireland are ever breast fed.19 Overall, 65% of breast fed infants are still receiving breast milk at aged 6 weeks, and 21% are still fed on the breast at 9 months. Infants in Northern Ireland also continue feeding for a shorter period of time that infants in other parts of the UK (fig 7).19

Duration of breast feeding by place of residence, UK, 1995 (source: Office for National Statistics19).
EDUCATION AND SCHOOLING
In England, at January 1996, there were 26 441 schools and 291 pupil referral units; 8 116 543 pupils, 6872 of which attended pupil referral units; and 504 191 teachers.20 Pupil referral units are units for students without special educational needs, but who cannot be educated in mainstream schools, for example pregnant school girls or students with disciplinary problems.
One measure of poverty is the proportion of pupils in receipt of free school meals. In 1996, 18.7% of primary school pupils, and 13.3% of secondary school pupils were receiving free school meals. However, there is considerable geographic variation in this, with 38.6% of primary school pupils in Inner London, and 40.9% of primary school pupils in Manchester receiving free school meals, compared with 6.8% in Buckinghamshire and 7.3% in Lincolnshire.20
There are 1263 special schools in England, providing education for children with ‘special educational needs who cannot be educated satisfactorily in an ordinary school’.20 Over 100 000 pupils attended a special school for all or some of their schooling in 1996. In addition, children may have a statement of special educational need, which is supported in a mainstream school. In total, 227 348 (2.8%) of all pupils (including those in attending special schools) have a statement of special educational need, 56% of whom attend mainstream schools.20 As fig 8 shows, the proportion of children who have been ‘statemented’ is increasing, in both the primary and secondary schools, although not among the independent schools. Of the 39 541 children assessed for the first time for a special educational need statement during 1995, 26 238 (66%) were placed in a mainstream school, and 9747 (25%) in a special school. Others were placed in the independent sector or in other provision, for example hospital schools, and 4% are awaiting provision. A further 2207 children were assessed, but no statement was issued. 37.2% of children at special schools are in receipt of free school meals.
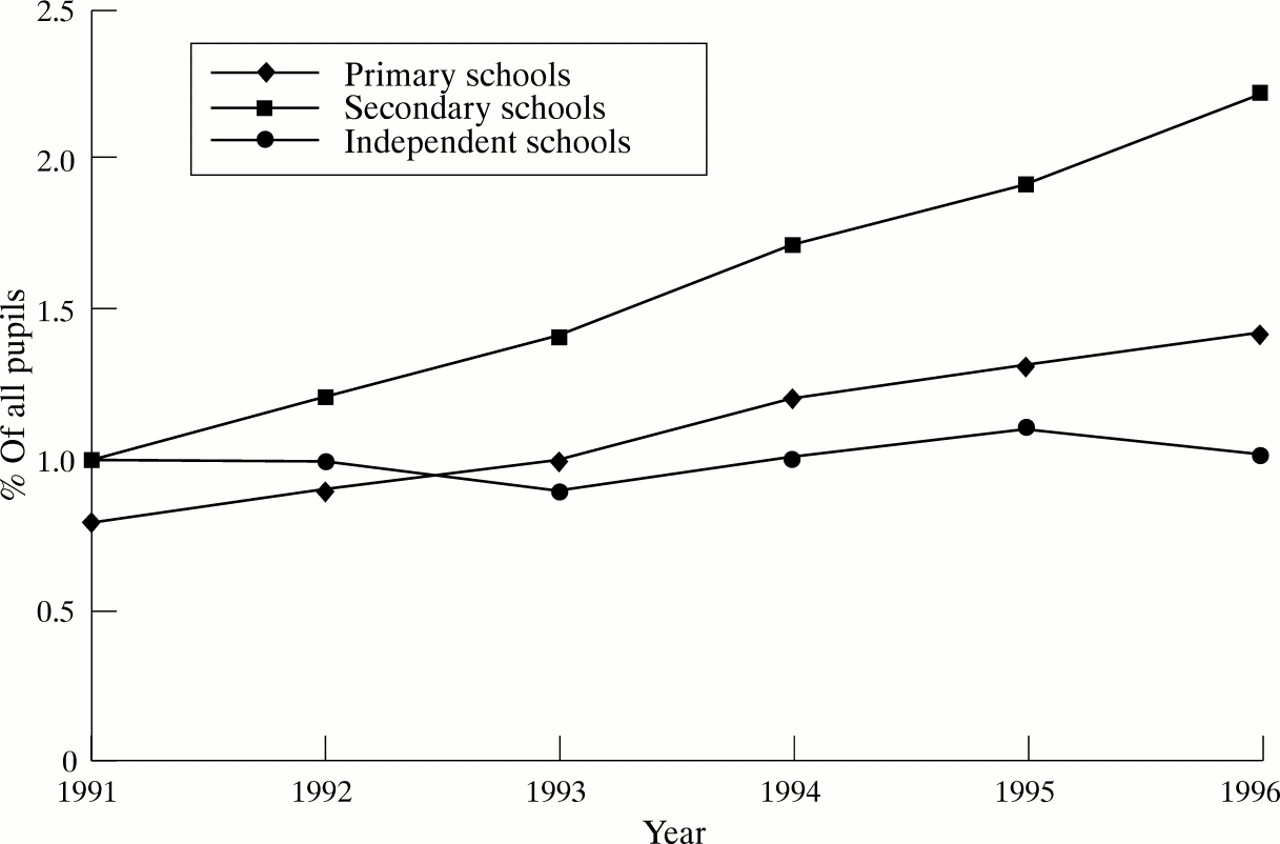
Percentage of pupils with statement of special educational need and attending mainstream school, England, 1996 (source: Department of Education and Employment20).
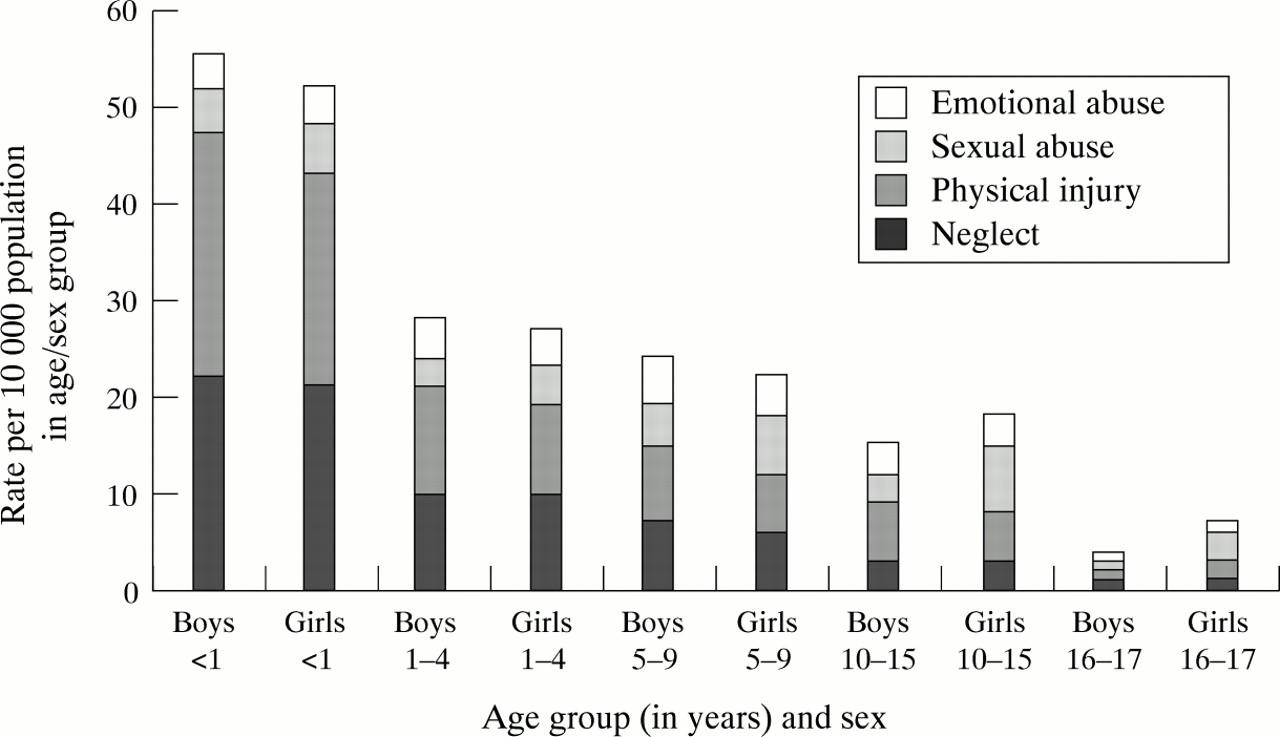
CHILDREN ON CHILD PROTECTION REGISTERS
Statistics on children and young people on child protection registers in England are published annually. During the year ending 31 March 1996, 28 270 children and young people were entered on the register, a rate of 25 per 10 000. As fig 9 shows, the highest rate (63 per 10 000) is among infants under 1 year of age, and falls with age in both sexes; it is higher in boys at younger ages, but in girls at older ages.21 Of the 32 523 young people in the care of the local authority at 31 March 1996, 7239 (22%) were looked after by the local authority, a further 172 (1%) were under emergency protection orders, and 856 (3%) under supervision orders.21

Registrations to child protection registers during year end March 31 1996, by age, sex, and category of abuse, England (source: Department of Health21).
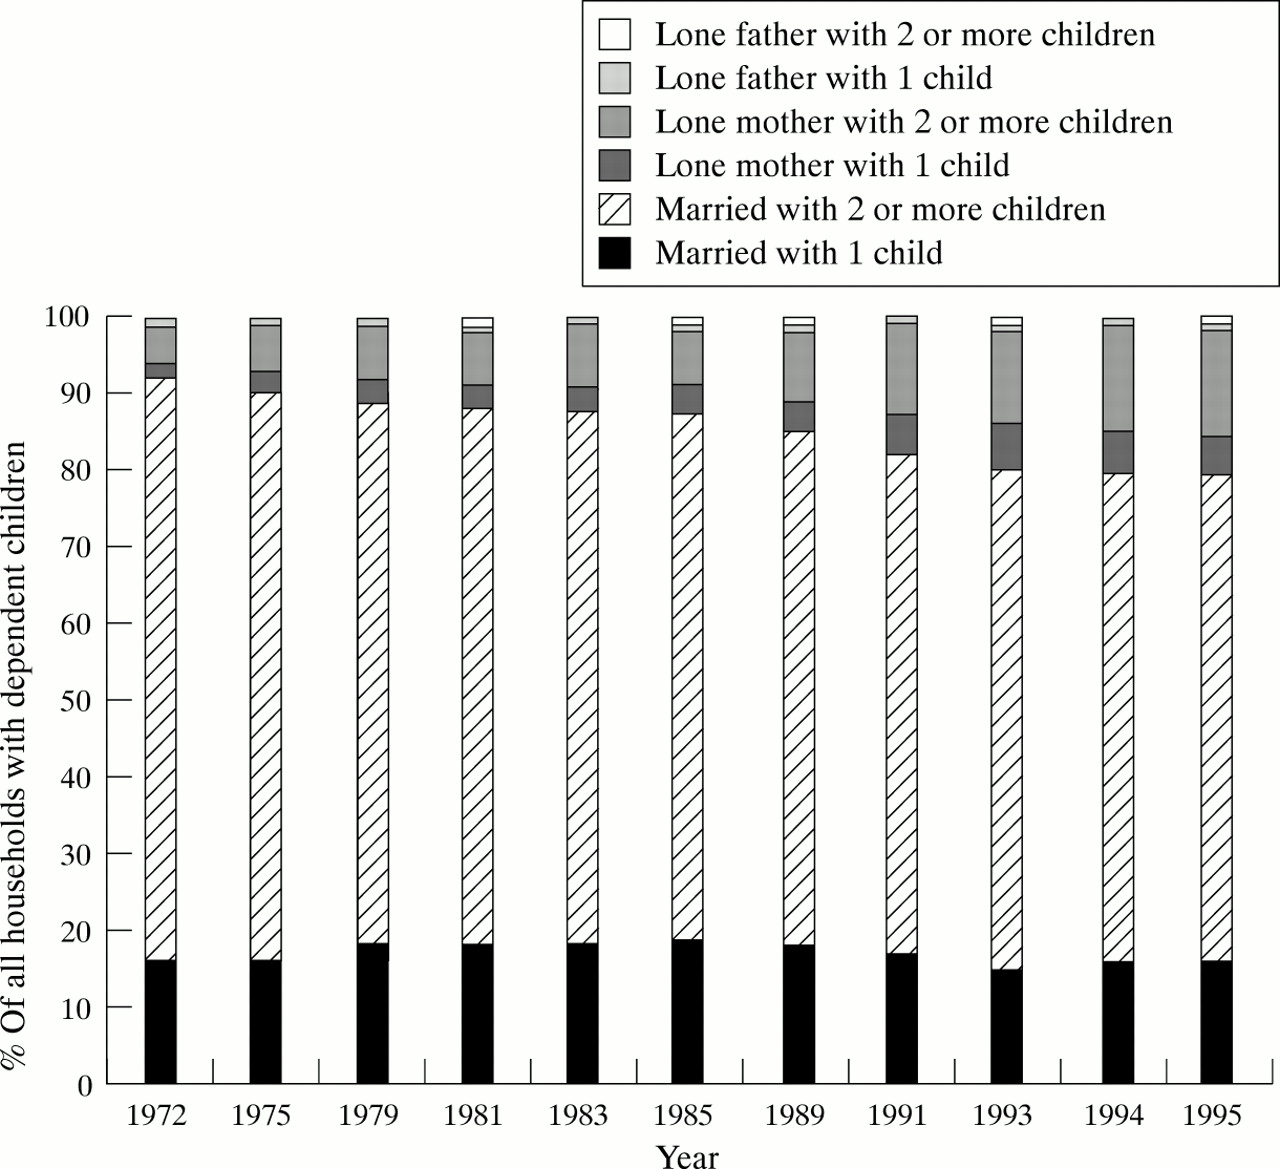
VARIATIONS IN FAMILIES AND HOUSEHOLDS IN UK
One of the most striking social changes in the last quarter of this century is the increase in one parent households. Figure 10, depicting data from the general household survey over the last 25 years, shows that in 1995 over 20% of households with dependent children were lone parent households, compared with only 8% in 1972.22 This trend gives cause for concern, as lone parent households have a lower weekly household income than married couple households, for example, 41% of lone parent households have a weekly income of less than £100 compared with only 4% of married couple with dependent children households. Approximately 58% of low income lone parent households are single mothers; lone parents who are separated or divorced tend to have higher weekly incomes. At the other end of the scale, 65% of married couple households with dependent children have a weekly income of £350 or more, compared with only 10% of lone parent households. Consequently, the proportion of children growing up in poverty is increasing.22
Changes in family type and number of dependants, Great Britain, 1972–95 (source: Office for National Statistics22).
Conclusions
In the mid-1990s in the UK, the birth rate continues to decline, as does the infant and childhood mortality rates,11 and immunisation uptake rates are at the highest ever recorded.17 Breast feeding is also becoming more common,19 and the reported rates of congenital anomalies, particular chromosomal and neural tube defects, are declining.15
On the other hand, an increasing proportion of children are growing up in poverty, and it is these children that are most at risk of death and chronic disease during childhood.11 Children in lone parent household are increasing. Infant mortality is greater among children whose fathers have a manual occupation; infants whose mothers completed their education before the age of 18 are less likely to be breast fed, and children from poorer areas are at greater risk of dental decay.18 Improved medical care has reaped its rewards. Although technology is allowing more and more very tiny infants to survive, it is social changes, focused at improving the conditions in which children live, rather than medical intervention that will improve the outlook for British children today.