Article Text

Abstract
Objective: To investigate secular trends in resting heart rate in young adults.
Design, setting, and participants: A series of cross sectional cohorts of first year undergraduates (5562) aged 16–24 years who attended Queen’s University Belfast from 1949 to 2004 and underwent health checks at the university health centre.
Main outcome measure: Resting heart rate.
Results: Crude aggregate data for 1949–59 showed a secular decline in heart rate in male and female students. Both unadjusted and fully adjusted analyses of data from 1975 onwards—controlled for age, body mass index, height, and smoking—showed a U shaped association between heart rate and year of entry to university in both sexes (p < 0.001): heart rate initially declined and then increased from the mid 1980s. Trends were similar in smokers and non-smokers and in students with normal body size and those who were overweight. However, heart rate in the 693 (28%) male students reporting the most physical activity remained stable and lower than that of men who participated in less physical activity over the period of the study. Similarly in female students, heart rate was generally lower in the 210 (10%) who participated in the most physical activity than in those who engaged in less physical activity.
Conclusions: The decline in heart rate in young adults occurring at least 50 years ago and continuing until the 1980s is consistent with other favourable findings on cardiovascular health in this age group and with observed long term declines in cardiovascular mortality. The more recent rise in heart rate, not accounted for by increases in overweight, prompts concern that recent favourable trends in cardiovascular disease risk may not be maintained. Among students who took part in the highest levels of physical activity the finding of low and stable heart rates points to the importance of exercise in maintaining cardiovascular health. Measurement of heart rate in population surveys would provide a simple tool to assist monitoring cardiovascular health.
- heart rate
- cardiovascular diseases
- physical activity
- epidemiology
Statistics from Altmetric.com
Findings from general populations, elderly people, and hypertensive cohorts indicate that increased heart rate is strongly associated with hypertension, atherosclerosis, and their sequelae and, further, is an established risk factor for both cardiovascular and non-cardiovascular mortality.1–9 Several studies also suggest that an increased heart rate in early adulthood may be an important predictor of later cardiovascular risk.10,11 Despite this evidence and the simplicity of recording heart rate, its use in monitoring cardiovascular health and health trends has been both largely neglected and underestimated. Since examining the trends in heart rate in young adults may contribute information on cardiovascular health and likely future patterns of cardiovascular disease and, as to date this has not been undertaken, we investigated the trends in resting heart rate in a cohort of young adults.
METHODS
From 1948–9 to 1991–2 first year undergraduates attending Queen’s University Belfast (QUB) underwent a compulsory medical examination. Attendance at these medical examinations became voluntary in the academic year 1992–3. Aggregate crude findings from 1949–59 are available from previously published studies but individual data from this period and from 1960–75 have been destroyed.12,13 Ethical permission was granted by the QUB research ethics committee to investigate trends in cardiovascular risk factors in a sample of students who attended QUB from 1975 onwards. Data on 5562 (54% male and 46% female) first year undergraduates attending QUB between 1975 and 2004 were entered on to a computer database. This student population comprised a 13% random sample (4406) of all students who entered QUB between 1975 and 1992 and a further 1156 undergraduates (7% of the total 2001–4 intake) who were randomly selected from all first year undergraduates who registered with QUB health centre between 2001 and 2004. For students entering university between 1948 and 1992 the following data were recorded: date of birth, sociodemographic and educational information, behavioural and lifestyle factors, anthropometric details, medical history, family health and structure, and clinical measurements including blood pressure and heart rate. Similar data collected in 2001–4 were date of birth, height, weight, cigarette smoking, physical activity, and clinical measurements including resting heart rate and blood pressure. Father’s social class was not available for the 2001–4 students. Data were not available for students who attended QUB between 1993 and 2000.
As health examinations were not compulsory after 1992 it is possible that those students who registered voluntarily with the university health centre were less healthy than non-registrees. To determine whether this was so, we invited a random sample of first year undergraduate students who entered QUB in 2004 and had registered with the university health centre (158) and students who had not registered (41) to complete a battery of self report health questionnaires including the short form 36, general health questionnaire 28, and the Cornell medical index.14–16
Statistical analyses
Independent sample t tests were used to assess whether there was any difference in the age and sex adjusted self reported health scores between students who registered with the health centre and those who did not.
The trend in mean heart rate from 1948–54 to 1955–9 was determined from the published mean sex specific heart rates over this period.12,13 Among male and female students aged 16–24 who were registered with the university health centre from 1975–1992 and 2001–4 we estimated the trend in mean heart rate by using linear regression analysis with year of entry categorised first in three year groups and then as a continuous variable. Fully adjusted models included age (years), height (m), body mass index (weight (kg)/height (m)2) and smoking (yes/no). Analysis of the 1975–92 sample showed a negligible difference between fully adjusted models that included father’s social class and those with father’s social class excluded. Further, father’s social class had no effect on heart rate between 1975 and 1992 and, as father’s social class was not available in 2001–4, this variable was excluded from further analysis. As age adjusted findings from analyses of students with missing confounding variables were similar to those of students with full confounder data, only analyses of students with full confounder data are presented here.
As resting heart rate is inversely associated with physical activity and positively associated with tobacco smoking and body mass index, we also examined the trends in physical activity by using a non-parametric test for trend across ordered groups (below average, average, above average).17–22 Trends in the proportion of smokers and overweight students (⩾ 25 kg/m2) were examined by using the χ2 test for trend. To investigate additionally whether differences existed in trends in heart rate across categories of these three exposure variables we used likelihood ratio tests to test for interaction between each of body mass index (< 25 kg/m2, ⩾ 25 kg/m2), smoking (yes, no), physical activity (below average, average, above average), and year of entry to university.
RESULTS
Independent sample t tests showed no difference in the age or sex distribution of those who, in 2004, registered with the university health centre and those who did not register. There was a slight excess of female students, which is in line with the proportion of women entering university in recent years. Further, there was no evidence of dissimilarity in the age and sex adjusted scores of the health questionnaires between the two groups (table 1).
Age and sex distribution and mean* (95% confidence interval) self reported health scores of university health centre registered and non-registered students in 2004
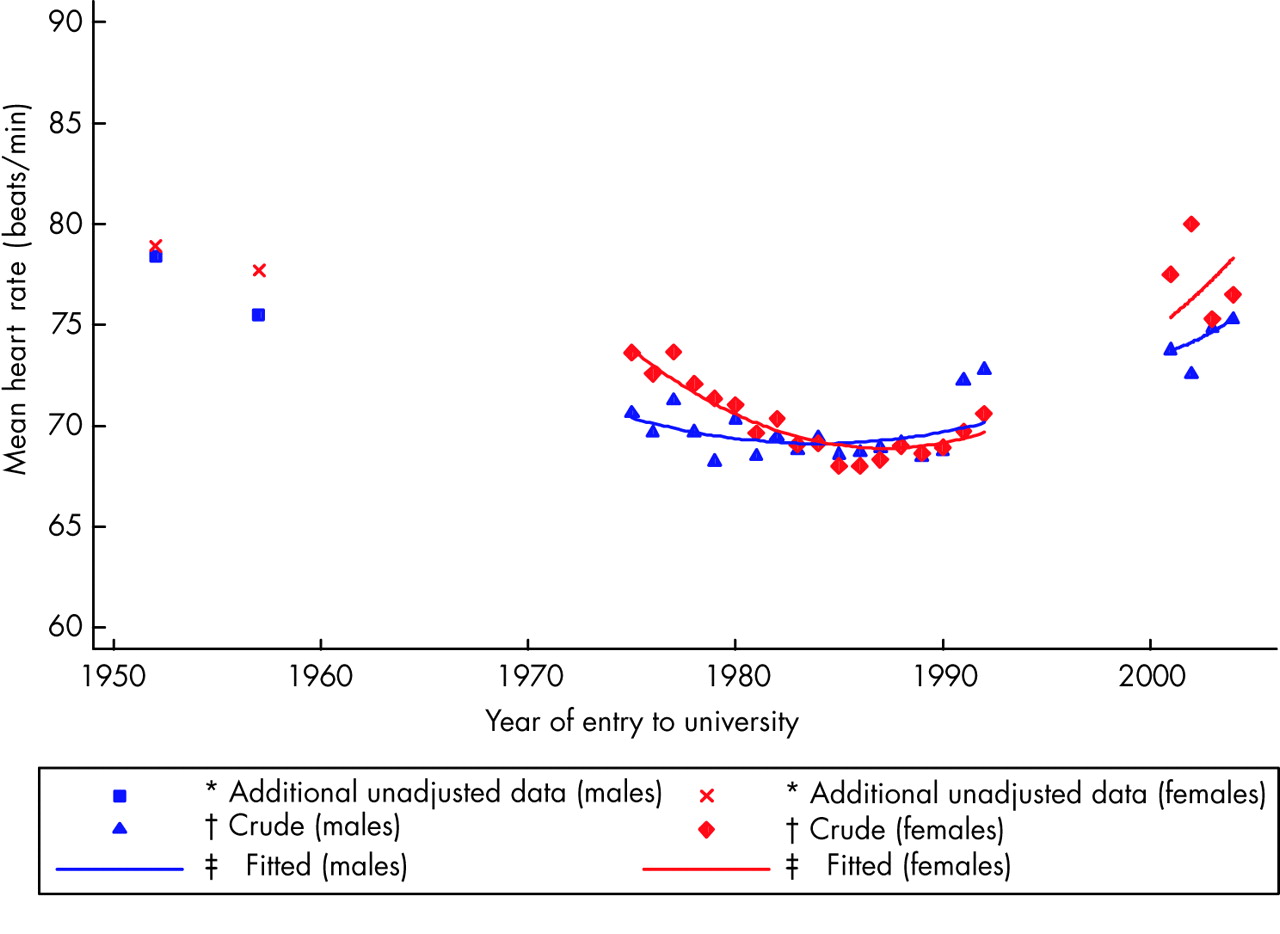
Of the original 5562 students in the cohort, 4943 had a valid heart rate measurement. Students were excluded from analysis if data on potential confounders were missing: physical activity (399), smoking (11), weight (20), and height (6). After exclusions, 4508 (91%) (2489 male and 2019 female) students remained eligible for analysis. The age range of the students was 16–24 years. Table 2 presents heart rate by bands of year of entry to QUB. Unadjusted findings on similarly aged students from 1949–59 indicate that during this period heart rate also dropped in both sexes. From 1975 to the late 1980s heart rate clearly decreased, and these results were little influenced by adjustment for potential confounders. From the late 1980s to 1992 and from 2001 to 2004 heart rate increased. Analysis of all available data showed that male students’ heart rate declined from a high of 78.4 beats/min in 1949–54 to 68.9 (95% confidence interval (CI) 68.1 to 69.6) beats/min in the early 1980s, thereafter rising to 74.1 (95% CI 73.3 to 75.0) beats/min in 2001–4. For female students, the corresponding heart rates were 78.9 beats/min, 68.5 (95% CI 67.6 to 69.3) beats/min, and 77.0 (95% CI 76.3 to 77.6) beats/min.
Mean heart rate (beats/min) and 95% confidence intervals (CIs) in male and female Queen’s University Belfast students by year of entry to university
When year of entry was entered in the model as a continuous variable, the additional variability explained by including the quadratic term (year of entry squared) improved the fit of the model and we therefore retained this variable in the analyses presented here. Figure 1 shows a U shaped association between heart rate and year of entry for both sexes (p < 0.0001). (The unadjusted values from the earlier studies, though not included in the regression model, are also presented in fig 1). Although data were not available for the periods 1960–74 and 1993–2000, the above findings are consistent with a downward trend in heart rate from 1949 to the late 1980s, followed by a pronounced increase thereafter in both sexes. As only crude grouped data were available from the earliest period of the study we conducted additional regression analysis weighted by the number of students in each year band to ensure that the curvilinear pattern presented was consistent with the earlier data. These weighted regression analyses indicated that the U shaped pattern in heart rate was consistent with the available data in both male (p (quadratic trend) = 0.036) and female (p (quadratic tend) = 0.004) students. Further, in analyses restricted to the 1975–92 data the non-linear associations followed the same curvilinear pattern as analyses that included the data from 2001–4 (p < 0.001 in both sexes).

Curvilinear association between heart rate (beats/min) and year of entry to university in male and female Queen’s University Belfast students. *Additional unadjusted data from previous publications not included in the regression model12 13; †crude mean values of heart rate; ‡fully adjusted for age, body mass index (BMI), height, and smoking.
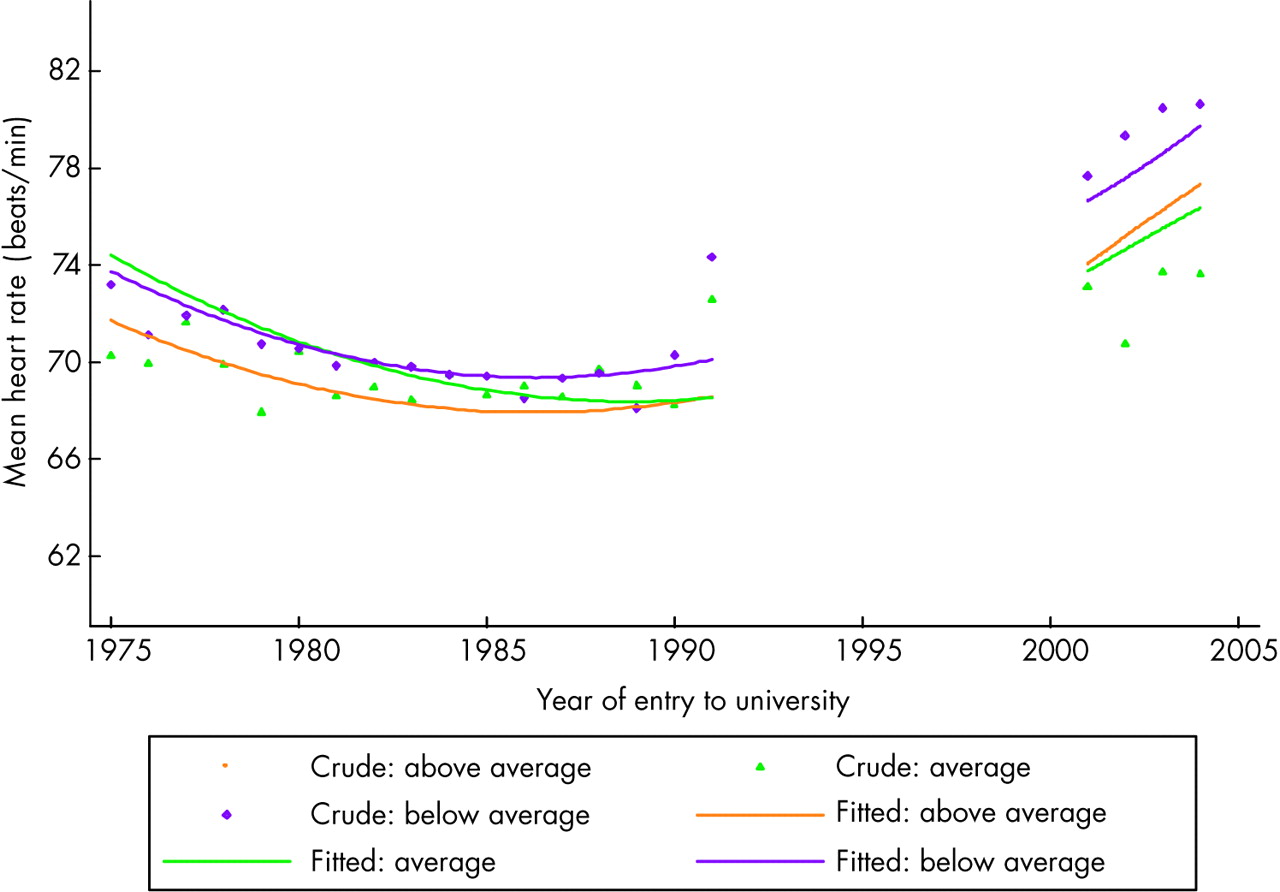
Evidence was strong that the proportion of students in the lowest physical activity category increased while the proportion in the highest physical activity category decreased over the period 1975–2004 (z = 9.61, p < 0.01 and z = 3.44, p < 0.01 for male and female students, respectively). There was a significant interaction between year of entry and physical activity category in men and women (p < 0.0001 in male and p = 0.001 in female students). As fig 2 shows, the 28% (693 of 2459) of men in the highest physical activity group had a lower and more stable heart rate than those engaging in less physical activity, whose heart rate over the period of the study exhibited the same declining then rising pattern as seen among all men combined. In female students, although heart rate followed a similar pattern across all categories of physical activity, resting heart rate was consistently lower among the 10% (210 of 2010) in the highest level of physical activity than among those whose physical activity was below average (fig 3). The effect modification is clearly indicated by examining mean heart rate by category of physical activity for the whole period of the study (1975–2004): the overall age adjusted mean heart rate for male students was 68.5 (95% CI 67.9 to 69.1) beats/min for those in the highest physical activity group, 69.9 (95% CI 69.5 to 70.3) beats/min in the average group, and 71.9 (95% CI 71.3 to 72.6) beats/min in the lowest group. The corresponding age adjusted mean resting heart rates for female students were 69.5 (95% CI 68.3 to 70.6) beats/min, 71.2 (95% CI 70.7 to 71.7) beats/min, and 73.3 (95% CI 72.7 to 73.8) beats/min.

Curvilinear association between heart rate (beats/min), by category of physical activity (above average, average, below average), and year of entry to university for male Queen’s University Belfast students. Fitted values are adjusted for age, height, BMI, and smoking.

Curvilinear association between heart rate (beats/min), by category of physical activity (above average, average, below average), and year of entry to university for female Queen’s University Belfast students. Fitted values are adjusted for age, height, BMI, and smoking.
The proportion of smokers did not change substantially over the period (p = 0.09 in men and p = 0.27 in women) but the proportion of overweight students increased (p < 0.001) in both sexes. However, there was no strong evidence that smoking (p = 0.44 in men and p = 0.23 in women) or body size (p = 0.09 in men and p = 0.97 in women) modified the trend in heart rate.
DISCUSSION
In our study heart rate in both sexes declined between 1949 and the late 1980s and thereafter rose notably. These trends were not accounted for by potential confounding factors. We cannot be certain of what happened to heart rate during the period 1960–74 but a decline is plausible, since heart rate was falling at both the beginning and end of this period. Similarly, an increase in heart rate from 1993–2000 would be consistent with the patterns observed immediately before and after this period. There was evidence that among men who engaged in the highest level of physical activity, heart rate was uniformly low over the study period compared with that observed among men who exercised less. Heart rate was also generally lower among women with above average physical activity than among their less active peers. There are few data with which to compare the findings of our study. Among Glasgow University students there is evidence that pulse rate increased during an earlier period than among the Belfast students but the Glasgow study did not have data from more recent time periods.23 Clearly further sources of evidence are required if we wish to conclude robustly that data on heart rate provide evidence on the important issue of whether physical activity levels have declined.
Strengths and limitations
Few studies have long term data on cardiovascular risk factors in young people. Although it is theoretically possible that people who enrolled in the university health centre after 1992 were generally less healthy than students who did not enrol, comparison of several measures of health gave no evidence for this. Therefore, the heart rates observed over the period 2000–4 probably are not notably higher than those of other first year students for this period. No data were available for 1993–2000 and therefore the analyses must be interpreted with caution, as we cannot infer what happened in these intervening years. However, in analyses restricted to the 1975–92 data the non-linear associations followed the same curvilinear pattern as analyses that included the data from 2001–4. In addition, despite the limitations of the data for 1949–59, weighted regression analysis based on all available data also provided supportive evidence for the curvilinear pattern uncovered.
Heart rate was measured once manually at the wrist after a period of rest. A standardised examination technique set up in 1948, which included a period of rest followed by a single pulse recording at the wrist, has been followed since then (N McBride, personal communication). This single measure probably did not affect the results, as resting heart rate has been reported to be higher in women than in men.5,8 This is also the case in the current study. Further, although random error is greater than if more than one measure had been available, only the precision of the estimates of heart rate, but not the existence or direction of any trend, would have been affected by this. The different times of day and conditions under which resting heart rate was measured may have introduced increased variability, but this variation would have averaged out, given the large number of participants. It would not have altered the basic findings we report.
Explanation of trends
The observed trends could not be accounted for by other covariates. However, it is well recognised that the more physically active have lower resting heart rate than the physically inactive.17–19 In our study this was also the case and there was also a downward trend in level of physical activity over the period of the study. Physical activity was measured relatively crudely; that physical activity did not fully account for the observed trend in heart rate may reflect misclassification in measurement of this variable. Furthermore, we did not have data on fitness, which has been hypothesised to be inversely related to heart rate.19 Our data indicate some beneficial effect of physical activity. Hence, replication of these analyses in cohorts with more accurate measures of physical activity and fitness is required.
Implications of findings
Both stroke and coronary heart disease declined in the latter half of the 20th century.24–26 The associations between heart rate and cardiovascular disease suggest that heart rate is an important and modifiable risk factor for cardiovascular and non-cardiovascular disease.9–11 The decline in heart rate observed before the late 1980s may therefore account for some of the reduction in CVD rates seen in Northern Ireland.27 The recent worrying upward trend is consistent with evidence from elsewhere that the cardiovascular risk profile of young people is deteriorating.28 This upward trend is of concern, as it may herald adverse consequences for the future health of today’s young adults.
Conclusion
The recent upward trends in heart rate noted here suggest that favourable trends in cardiovascular disease risk may not be maintained in the future. Variability in individual heart rate probably renders it unsuitable for monitoring individual cardiovascular risk. However, as it is easily measured, inclusion of heart rate recording in population surveys may provide an additional suitable and simple tool for predicting and monitoring changes in population health and may provide a ready measure of the effectiveness of health interventions at the population level.
Acknowledgments
PMcC and LM discovered the original data and along with AB designed the study. AB collected the 2001–4 data, entered the data on to the computer, carried out the analyses, and drafted the paper. LM and PMcC supervised the study. CC assisted with the analyses. LM, CC, GDS, and PMcC commented critically on subsequent drafts. Mrs Nan McBride provided information on the methods of the medical health examinations performed at the University Health Centre. PMcC will act as guarantor. AB is funded by DEL. PMcC is supported by a career scientist award funded by the Research & Development Office for Health and Personal Social Services in Northern Ireland. The funding bodies had no role in study design, data collection, data analysis, or data interpretation or in writing the report.
REFERENCES
Footnotes
-
Published Online First 13 September 2005
-
Competing interests: none declared