Adult outcome of normal children who are short or underweight at age 7 years
BMJ 1995; 310 doi: https://doi.org/10.1136/bmj.310.6981.696 (Published 18 March 1995) Cite this as: BMJ 1995;310:696
- Luigi Greco, professor of paediatricsa,
- Chris Power, senior lecturerb,
- Catherine Peckham, professora
- a University of Naples Federico II, Via Pansini 80131 Naples, Italy
- b Department of Epidemiology and Biostatistics, Institute of Child Health, London WC1 1EH
- Correspondence to: Dr Greco.
- Accepted 31 January 1995
Abstract
Objectives: To evaluate the adult growth outcome (at age 23) of children who are short or underweight at age 7 years in whom no identifiable pathological cause exists for their poor growth.
Design: Longitudinal follow up of a birth cohort.
Setting: The national child development study (1958 birth cohort) of Great Britain.
Subjects: 523 children with a height or a weight below the fifth centile at age 7. Of these, 70 (13.4%) were excluded because they had a longstanding ilness that could account for their poor growth. The remaining 453 subjects, who were followed to age 23, provided the base group from which those with additional data, such as parental height, were obtained.
Results: 55/174 (31.6%) boys who were short at age 7 became short men; 60/211 (28.4%) girls who were short at age 7 became short women. Among boys who were underweight at age 7, 46/160 (28.7%) were still underweight at age 23, while 61/200 (30.5%) girls underweight at age 7 became underweight women. Having short parents did not increase the probability of being small as an adult. Children with delayed puberty were as likely to remain small as those in whom puberty was not delayed.
Conclusions: One in three normal children who was short or underweight at age 7 became a short or underweight adult. This informs the management of short children and may be valuable when prolonged growth hormone treatment for short stature is being considered.
Key messages
Key messages
Follow up of national population samples starting early in life are ideal for monitoring such outcomes and associated mediating influences
In this study one in three normal children who was short or underweight at age 7 became a short or underweight adult
Fluctuating growth patterns in childhood are likely to account for the finding that the remaining two in three children were no longer short or underweight by early adulthood
Introduction
Most short or underweight school age children are not affected by any identifiable disease. This is evident from Lacey and Parkin's study of short 10 year olds, in which only 16 out of 89 children had organic disease that could account for their shortness.1 2 A school survey recently reported that eight out of 155 children with height below the third centile had organic disease not previously identified.3
“Short normal” children (children who are short but not because of related organic disease) are not exempt from psychosocial problems associated with short stature, and there is increasing pressure to treat such children irrespective of whether their familial target height is small.4 5 6 In assessing whether these children should be considered for treatment, it is pertinent to consider whether short normal children remain short during childhood and whether they become short adults. No published population based studies answer this question, presumably because the necessary longitudinal data are scarce.
We used longitudinal data from a nationally representative sample of British children—the 1958 birth cohort study (national child development study)—to monitor the subsequent growth and adult height of short normal children. As in current clinical practice, such children are defined here in comparison with their genetic target—that is, their parents' heights. To gain a more complete assessment of the growth potential of individuals, we also examined adult outcomes for those with alow weight in childhood. Most short children are indeed underweight for their age, although their weight may be adequate for their height. Different genetic and environmental factors affecting height and weight; the greater variance in weight, as compared with height, should not discourage analysis of individual weight outcome.
Subjects and methods
A total of 16994 singletons born to mothers resident in England, Scotland, and Wales were enrolled in the perinatal mortality survey in the week 3-9 March 1958.7 These children were followed up at ages 7, 11, 16, 23, and 33 in the national child development study.7 8 Medical examinations were carried out by the school health service, during which the height and weight of the child in underclothes were measured. Instructions on the procedure were provided in an attempt to reduce errors in measurement. Height was measured to the nearest inch (1 inch=2.54 cm) at age 7 and in centimetres at later ages. At age 23, heights and weights were self reported. These data were subsequently checked for validity with data collected in previous sweeps, and 0.2% of female heights and 0.1% of male heights were excluded as probable errors.9
Mothers' heights were either self reported or taken from the case sheets in the birth survey; they were also reported in 1969 when the children in the survey were 11 years old. Fathers' heights were also reported in the 1969 follow up. Comparison of the mothers' heights recorded on separate occasions shows good agreement.10. The self reported heights of the cohort members and their parents also compare well with measured data collected in 1980 from a national sample of British adults.11 12
Subjects included in the present study were restricted to those with data at ages 7 and 23. Sample attrition had occurred over time (15414 subjects at age 7, 12537 at age 23) and data on height and weight were available for 4507 male subjects and 4663 female subjects. To avoid further reduction in sample numbers, individuals with missing information on some variables—for example, parental height or onset of puberty—were omitted only from the analyses in which these data were needed. Sample representativeness has been examined previously.13 Heights of subjects during childhood and heights of mothers were slightly shorter on average for those with missing data compared with those with data. Individuals from lower social class backgrounds were less likely to provide full information at each sweep. Although some biases were significant, differences between samples were considered negligible for height up to age 16 and of minor importance later.7 13
Standard deviation scores for height were obtained from linear regression of height on age for each sex. Adjusted height standard deviation scores were obtained by regressing height on age, sex, and fathers' and mothers' height. The standardised residuals were ranked into 20 groups, each identifying 5% of the sample. The fifth centile is necessarily an arbitrary cut off but was used here to delineate the group of children who were the shortest. The fifth centile was 111.9 cm at age 7 and 165.2 cm at age 23 in males and 110.71 cm at age 7 and 152.05 cm at age 23 in females.
For comparisons involving weight the percentage of the median weight for sex and age was calculated, to represent relative median weight. The median weight for each individual's age and sex was obtained with linear regression on median weight for age and sex. The fifth centile of relative median weight was adopted as the cut off for the group of children who were underweight: it corresponds to a weight of 18.27 kg at age 7 and 57.33 kg at age 23 in males and 17.58 kg at age 7 and 45.72 kg at age 23 in females.
While the fifth centile values for height and weight identified the short and underweight groups, individuals were not categorised as “short normal” if they had any record of a major pathological condition. Exclusion criteria included (a) three or more nonaccident related hospital admissions between ages 7 and 11; (b) a reported history of endocrine, heart, or kidney disease or of epilepsy, malabsorption, chronic arthritis, or repeated chest infections by age 16; and (c) limiting longstanding illness by age 23. Of 523 subjects identified as short, 70 (13.4%) were excluded on the basis of these criteria. Hence, the group of short normal subjects comprised 174 males and 211 females, and the group of underweight subjects comprised 160 males and 200 females.
The relation between short stature or being underweight at ages 7 and 23 was examined according to parental height, birth weight, and pubertal development. Only for parental height was the analysis based on children's height unadjusted for their parents' weights. Low birth weight was defined as more than 2 SD below the birth weight for gestational age and sex.7 For pubertal development doctors' assessments at the 11 and 16 year sweeps were used. Absent or sparse pubic hair for boys and onset of menarche after age 14 for girls were regarded as indicators of delayed puberty.
As the comparison of those below the fifth centile with those above the fifth centile might reflect small changes around the cut off points and possible errors in measurement, data are also presented for the next centile group—that is, between the fifth and the tenth centile. The range between the fifth and the tenth centile was 4 cm for height and 3 kg for weight at age 7, considerably above the variation possibly associated with an error in measurement.
Results
Figure 1 (a) shows the distribution of heights of short normal children as identified at age 7 after follow up at ages 11, 16, and 23. As described above, heights were adjusted for age, sex, and parental height. Figure 1 (b) shows the distribution of height for children above the tenth centile at age 7. The height distribution for short normal children at age 7 is truncated, by definition, at the fifth centile, while at ages 11, 16, and 23 the height distribution for the same subjects shifts towards the mean of the normal population with increasing age. By age 23 less than one third of short normal children were among the shortest 5% of the study sample. Similarly, for weight the distribution of the lightest 5% of children at age 7 shifts towards the mean of the normal population by age 11 and even more so at ages 16 and 23 (fig 2).

Distribution of standardised heights of (a) short normal and (b) children above fifth centile at ages 7, 11, 16, and 23
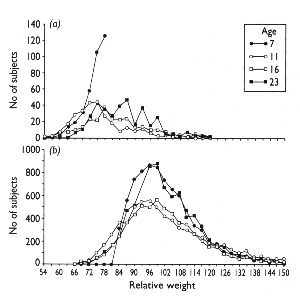
Distribution of relative median weight of (a) underweight and (b) children above fifth centile at ages 7, 11, 16, and 23. Curve for 23 year weights has been smoothed to overcome digit preference in these self reported data
Table I shows the proportions of short boys and girls who remained short at ages 11, 16, and 23. Of 174 boys who were short at age 7, 55 (31.6%) became short adults; 50% were already above the fifth centile by age 11. Similarly, of 211 girls who were short at age 7, 60 (28.4%) became short adults.
Height outcome of 174 boys and 211 girls who were short at age 7. Values are numbers (percentages) of subjects
Most subjects moved from below the fifth centile at age 7 to above the 10th centile at 23 years, suggesting that possible errors in measurement around the fifth centile provide only a minor explanation for the results.
Table II shows the relative median weight outcome for subjects defined as underweight at age 7 (with a relative median weight less than the fifth centile for that age and for sex). The pattern for underweight children is similar to that for short children, with 44/160 (28.7%) male subjects and 60/200 (30.0%) female subjects remaining below the fifth centile by age 23.
Weight outcome of 160 boys and 200 girls who were underweight at 7. Values are numbers (percentages) of subjects
PARENTAL HEIGHT
As described earlier, children who were shorter than their parents had been preferentially selected into the short group. Thus 68/174 (39.1%) of boys became taller than their fathers and 43/211 (20.4%) girls taller than their mothers. The group above the fifth centile at age 7 showed a difference of 3.38 cm between sons at age 23 and fathers (61% (2619/4293) were taller than their fathers) and of 0.8 cm between daughters at age 23 and mothers (55% (2438/4432) were taller than their mothers). Short parental height—that is, below the tenth height centile for their own cohort—was also more common among short children: 25.7% (99/385) children who were short at age 7 had one or both parents who were also short, compared with 19% (1658/8725) expected for the entire cohort. However, catch up rates did not differ significantly between short children with short parents and short children with parents of normal height (table III).
Height outcome of 385 children who were short at age 7,*by stature of parents
BIRTH WEIGHT
Birth weight is associated with height in childhood and adulthood, hence low birth weight may influence whether children become short but normal. In the sample from the national child development study the risk of short stature at age 7 was 2.69 (95% confidence interval 1.60 to 4.53) for low birthweight babies relative to higher birthweight babies. The relative risk of short stature at age 23 was also raised for low birthweight babies (2.28, 1.29 to 4.03). Table IV shows catch up growth in children who were short and underweight at age 7 according to their birth weight. While differences between birth weight groups did not reach significance, possibly due to small numbers with low birth weight, underweight children at age 7 with low birth weight may have a poorer outcome at age 23 than children with normal birth weight.
Birth weight in children who were short or underweight at age 7. Values are numbers (percentages) of subjects
PUBERTAL DEVELOPMENT
Of children who were short at age 7 with delayed puberty, 16/23 (70%) girls were still short at age 11 and 26/30 (87%) boys were still short at age 16, compared with 63/108 (58%) girls and 34/92 (37%) boys with normal puberty. This difference was no longer present, however, at age 23 when similar proportions remained below the fifth centile (table V). Figure 3 shows that mean adjusted height was significantly shorter at age 16 in late developing boys than in normal developers. For girls this difference was pronounced at age 11. No difference was detected at age 23 in the same subjects.
Height outcome and pubertal development in 122 boys and 131 girls who were short at age 7. Values are numbers (percentages) of subjects

Mean standardised height of children with delayed puberty compared with those in whom puberty was not delayed at ages 11 (girls), 16 (boys), and 23
Relative weight was consistently lower in late developing boys at age 16 and girls at age 11. At age 23 no differences in relative weight existed between late and normal developers for either male or female subjects.
Discussion
With information on both growth and morbidity, this large longitudinal study provides an opportunity to investigate whether short normal children become short adults. The study is not without shortcomings, however, including historical distance, method of data collection, bias due to missing data on follow up, and self reported measurements.7 Inevitably, it was necessary to take an arbitrary cut off to define short stature. Furthermore, only organic causes of disease were selected as exclusion criteria to define “short normal” children. In future work it may be possible to comment on psychosocial causes, as described in the literature on failure to thrive.14
It is important to consider the social changes that have occurred in the past 30 years, even though these may not affect the results of this study. The home environment in 1958 and 1965 (when the subjects were aged 7) differed from the current environment. Few low birthweight babies survived; the size of the average family was larger; individual nutritional status was occasionally poor because of the larger number of siblings; less than 10% of families were disrupted by separation and divorce; and the percentage of non-Europeans in the population was relatively small.
Even so it is interesting that just one in three of the short and underweight children in this cohort became short and underweight adults. Self reporting errors do not seem to explain this finding, since catch up was evident for most children by age 16, when the height and weight of each subject were measured. The fact that children who are short at age 7 are no longer short at 23 probably reflects the statistical phenomenon known as regression towards the mean.15 16 This has been documented previously for height in prepubertal children,17 and for obesity—about 6 in 10 overweight 7 year olds are obese at age 26.16 Thus a fluctuating pattern of growth rate in normally growing as well as in abnormally growing children, may explain a considerable amount of variability in growth status. Individuals may grow slowly for a period, falling into the fifth centile, and subsequently grow at a faster rate. A cross sectional inspection at a single age might select children at their minimum growth rate, which will eventually increase beyond the fifth centile for no other reason than natural change in individual growth rate.19 20 21
Surprisingly, genetics, in terms of short parental stature, does not seem to be a strong influence on the subsequent growth of children who are short at age 7: a similar proportion of subjects remaining below the fifth centile at age 23 have short parents compared with those who subsequently catch up.
Birth weight has a long term effect on growth.10 22 Since 1958, however, the survival of low birthweight and very low birthweight infants has increased appreciably. Further assessments of the impact of these changes on short stature would therefore be desirable.
Data from the 1958 birth cohort also suggest, as expected, that puberty exerts a strong influence on growth at age 16 in boys and at age 11 in girls: boys who are short at age 7 have poorer growth at age 16 if their puberty is delayed; similarly, short girls have poor growth at 11 if they also have delayed puberty. This effect is not significant by adulthood, when the difference between normal or late pubertal developers is not pronounced. Pubertal development results in a group of short children catching up before they reach their adult height. It is not, however, the major cause of short children achieving an adult height greater than the fifth centile.
Growth rate shows a linear relation with growth hormone response to hypoglycaemia induced by insulin.23 As growth is not constant throughout the year, a considerable proportion of the 453 children who were short at age 7 with a temporarily slow velocity would have been considered for endocrine treatment. Such a decision to treat would have been based on the results from provocation tests and on the assumption that a short child is likely to become a short adult. Although the evidence presented here pertains to a relatively large group of short children—namely, those below the fifth centile—it nevertheless casts doubt on the assumption that a short child will become a short adult.
Family, social, and environmental factors have been identified as influences on height at age 7 and at later ages.13 22 24 25 26 They are therefore likely to be associated with the subsequent growth patterns of children who are small at age 7, and they need further investigation.
The Canadian Institute for Advanced Research provided generous support for CP.