Article Text

Abstract
OBJECTIVES To report epidemiological trends in cerebral palsy including analyses by severity.
DESIGN Descriptive longitudinal study in north-east England. Every child with suspected cerebral palsy was examined by a developmental paediatrician to confirm the diagnosis. Severity of impact of disability was derived from a parent completed questionnaire already developed and validated for this purpose.
SUBJECTS All children with cerebral palsy, not associated with any known postneonatal insult, born 1964–1993 to mothers resident at the time of birth in the study area.
MAIN OUTCOME MEASURES Cerebral palsy rates by year, birth weight, and severity. Severity of 30% and above defines the more reliably ascertained cases; children who died before assessment at around 6 years of age are included in the most severe group (70% and above).
RESULTS 584 cases of cerebral palsy were ascertained, yielding a rate that rose from 1.68 per 1000 neonatal survivors during 1964–1968 to 2.45 during 1989–1993 (rise = 0.77; 95% confidence interval 0.2–1.3). For the more reliably ascertained cases there was a twofold increase in rate from 0.98 to 1.96 (rise = 0.98; 95% confidence interval 0.5–1.4). By birth weight, increases in rates were from 29.8 to 74.2 per 1000 neonatal survivors < 1500 g and from 3.9 to 11.5 for those 1500–2499 g. Newborns < 2500 g now contribute one half of all cases of cerebral palsy and just over half of the most severe cases, whereas in the first decade of this study they contributed one third of all cases and only one sixth of the most severe (χ2 and χ2 for trend p < 0.001).
CONCLUSIONS The rate of cerebral palsy has risen in spite of falling perinatal and neonatal mortality rates, a rise that is even more pronounced when the mildest and least reliably ascertained are excluded. The effect of modern care seems to be that many babies < 2500 g who would have died in the perinatal period now survive with severe cerebral palsy. A global measure of severity should be included in registers of cerebral palsy to determine a minimum threshold for international comparisons of rates, and to monitor changes in the distribution of severity.
- cerebral palsy
- severity
- population register
- epidemiology
Statistics from Altmetric.com
Cerebral palsy is the most common cause of physical disability in childhood. Although it makes substantial demands on medical, educational, therapeutic, and social services, it is the child and family who experience its direct effect and who must report its impact.
The pathological process in the brain that determines cerebral palsy also determines in general any associated impairments. It may not be meaningful to combine motor, cognitive, behavioural, and sensory disabilities into a single index of severity, and authors who report disabilities, such as Pharoah et al,1 do keep them separate. However, the impact of all disabilities in their unique combination on child and family is meaningful to measure, and Rosenbaum et al 2 argue strongly for consistent application of such a global measure of severity.
In this report we use data from the register of cerebral palsy in north-east England which last reported in 19853 and is now overseen by the North of England Collaborative Cerebral Palsy Survey.4 We present the results of analyses that incorporate a global measure of impact of disability—lifestyle assessment score for cerebral palsy.5 Such a measure not only represents more accurately the everyday reality of cerebral palsy but also enhances epidemiological validity because milder cases can be excluded from some analyses. Milder cases are variably ascertained3 ,6 because: there may be diagnostic overlap with conditions such as dyspraxia; parents may not seek help if there is no functional deficit; follow up studies of low birth weight children may discover mild cases that would never have presented clinically; mild cases tend to present late and the patients are therefore more likely to have left the area before diagnosis. A measure of severity also allows the effects of perinatal care to be monitored through changes in the distribution of severity over time and by birth weight. Finally, planning of therapeutic and supportive services can take account of severity rather than relying on crude rates.
Method
DEFINITIONS
We use the Little Club7 definition of cerebral palsy, updated by Bax.8 Cases associated with a known postneonatal insult are excluded. The denominator for the calculation of cerebral palsy rate is the number of neonatal survivors. The term disability is used as defined in the International Classification.9 The phrase “lifestyle assessment” is used to indicate the impact of disability as it affects competencies or roles necessary for survival5; it is synonymous with the term “handicap” as defined in the International Classification but is in keeping with modern nomenclature.
ASCERTAINMENT
Cases were ascertained from all births since 1964 to mothers resident at the time of birth in Newcastle, Northumberland, or North Tyneside. This is a well defined geographical area bounded by the Scottish border, the Pennine hills, the North Sea, and the River Tyne. The area, consisting of an urban conurbation and a geographically large rural area, has seen mining and shipbuilding replaced by service industries and manufacturing. The survey was established in 1979 by a retrospective search. Three subsequent retrospective searches were undertaken in 1985, 1990, and 1995, and cases are now reported continuously by a convenor in each district. As described in our previous report,3 multiple sources of ascertainment were used and have continued to be used. These are paediatricians, paediatric neurologists, physiotherapists and speech therapists, the local child development centre, the local registers of children with disability or special educational needs, childhood death registrations, hospital activity analysis, special schools, and long stay hospitals for the mentally handicapped when children still resided in them. Throughout the survey, every suspected case was seen by one of a small group of developmental paediatricians to confirm the diagnosis, describe the type of cerebral palsy, and invite the child's parents to complete the lifestyle assessment questionnaire. The oldest children assessed at the start of the study were already aged 16, but those born since 1970 were assessed between the ages of 4 and 10 years. The diagnoses in children who died before they could be assessed were based on reviews of case notes.
SEVERITY: LIFESTYLE ASSESSMENT QUESTIONNAIRE FOR CEREBRAL PALSY
This instrument was developed by Jarvis et al 6 and later refined and validated.5It is specifically designed for children with cerebral palsy and measures the impact of disability on child and family. Multidimensional scaling identified six dimensions from the spatial relations within the questionnaire data; the dimensions correspond to physical independence, mobility, clinical burden, schooling, economic burden, and social integration. The instrument generates a lifestyle assessment score (LAS) expressed as a percentage, with a maximally disadvantaged child scoring 100%. A typical child with LAS = 30% would complete most but not all self help activities, would pose little economic or social burden on the family and would attend mainstream school with some extra assistance. A typical child with LAS = 70% would not complete any self help activities, would impose a large economic and social burden on the family, and would require specialised education.
MISSING DATA
Children who died before assessment are included in the most severe group (⩾ 70%). This is based on the results of a separate study we undertook of the 22 children who died after assessment. Although older, and likely to be a less severe group than those dying before they could be assessed, most had severity ⩾ 70%.
The severity distribution for live cases with missing LAS values was extrapolated from observed cases. For the earliest cohort, these observed cases included a representative sample as described in the first report.3
STATISTICAL ANALYSIS
The statistical analyses by severity are weighted by the sampling fractions involved. Confidence intervals for proportions were calculated using Analysis Software.10
DENOMINATORS
Numbers of live births, neonatal deaths, and grouped information by birth weight were obtained from the local Medical Officer of Health's returns to the Department of Health and more recently from the Regional Maternity Survey.11
Results
In the study area from 1964 to 1993, the number of births fell from 14 000 to 9500 a year. The number fell by 30% from 1964 to 1975 in line with national trends but then rose by 5%, slightly less than the national average. There were falls in perinatal mortality rate from 31.3 to 7.5 and in neonatal mortality rate from 15.1 to 5.5.
A total of 584 cases of cerebral palsy, not associated with any known postneonatal insult, were identified in the resident birth cohort, 38 of which had died before assessment.
CEREBRAL PALSY INCIDENCE BY YEAR OF BIRTH AND SEVERITY
Table 1 shows that the incidence of cerebral palsy rose from 1.68 per 1000 neonatal survivors in 1964–1968 to 2.45 in 1989–1993 (rise = 0.77; 95% confidence interval (CI) 0.2–1.3). For the more reliably ascertained cases with severity exceeding 30%, there was a twofold increase in rate from 0.98 to 1.96 (rise = 0.98; 95% CI 0.5–1.4).
Rates of cerebral palsy by birth weight and five year cohort for all cases and those with lifestyle assessment score (LAS) ⩾ 30%
Figure 1 presents the rates as three year moving averages by cumulative severity. A moving average, in which individual points on the year axis include data from the preceding and succeeding years, enables time trends in the severity data to be illustrated in a way that could not be achieved in a table. For the period up to 1979, the changes in overall rate were mainly due to disproportionate variations in the rates of the mildest and least reliably ascertained cases with severity less than 30%. From 1980, cumulative rates rose across the spectrum of severity with a second burst around 1989. The exception was for severity exceeding 70%, for which the rate was reasonably steady until 1989 when it also began to rise.

Cerebral palsy rates by year of birth and cumulative severity (lifestyle assessment score (LAS)).
BIRTH WEIGHT SPECIFIC RATES OF CEREBRAL PALSY
Table 1 also shows that for the more reliably ascertained cases with severity exceeding 30%, the rate for newborns < 1500 g rose from 29.8 to 74.2 (χ2 and χ2 for trend p < 0.01), and for newborns 1500–2499 g the rate rose from 3.9 to 11.5 (χ2 and χ2 for trend p < 0.01). Meanwhile for those ⩾ 2500 g there was no significant increase in rate either overall or in the more reliably ascertained group.
Figure 2 shows rates against a logarithmic scale; ten year cohorts are used because of the small numbers of cases in the most severe category. The rate for severity exceeding 70% rose dramatically in those < 2500 g but fell in those ⩾ 2500 g.

Cerebral palsy rate by birth weight and cumulative severity (lifestyle assessment score (LAS)). Logarithmic y axis and standard error bars.
DISTRIBUTION OF SEVERITY WITHIN BIRTH WEIGHT GROUPS, BY 10 YEAR COHORT
Table 2 shows the distribution of severity by birth weight. As discussed in Methods, the children who died before assessment are included in the most severe group. For newborns < 2500 g, there was no significant change over the three decades in the proportion of most severe cases exceeding 70%. However, in newborns ⩾ 2500 g, there was a fall in the proportion of severe cases from 34% to 21% (χ2 and χ2 for trend p < 0.05), and, for those more reliably ascertained, the fall was more pronounced from 54% to 29% (χ2 p < 0.05, χ2 for trend p < 0.01).
Distribution of severity (lifestyle assessment score (LAS)) by 10 year cohort and birth weight
CONTRIBUTION OF BIRTH WEIGHT GROUPS TO OVERALL CASES, BY 10 YEAR COHORT
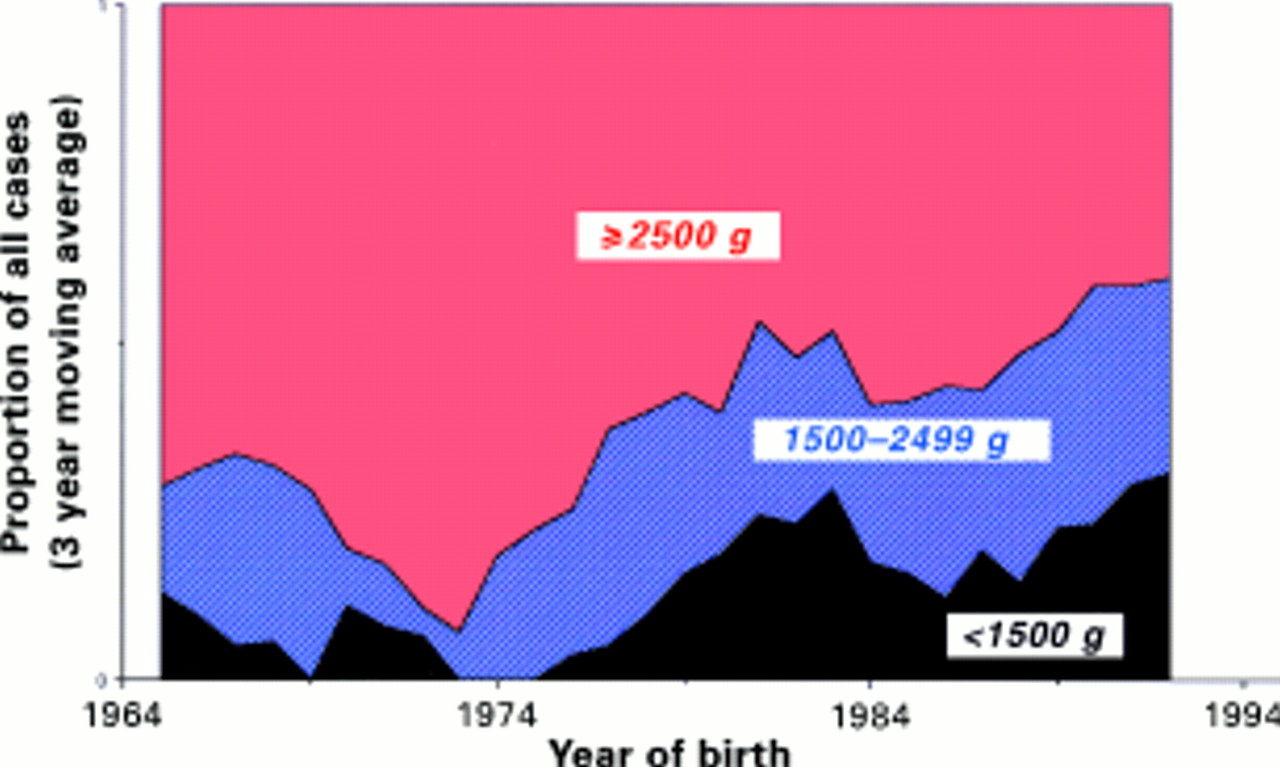
From 1984 to 1993, newborns < 2500 g contributed 49% of all cases of cerebral palsy compared with 34% from 1964 to 1973 (χ2 and χ2 for trend p < 0.01). For the more reliably ascertained cases, the change was more pronounced: 54% of all cases compared with 27% (χ2 and χ2for trend p < 0.001). Figure 3 shows this graphically as a three year moving average.
Contribution of birth weight group by year to more reliably ascertained cases of cerebral palsy with lifestyle assessment score ⩾ 30%.
Newborns < 2500 g also now contribute 54% of the most severe cases compared with only 16% in 1964–1973 (χ2 and χ2 for trend p < 0.001).
Discussion
Before application of a measure of severity, our data are broadly in line with other surveys. The rate of cerebral palsy for the most recent quinquennium was 2.45 per thousand compared with rates of between 2.0 and 3.0 in the international literature.12-23Over the last 20 years, our rate and that in Sweden15-17have continued to rise; in Italy23 the rate peaked in 1985 before declining; rates are steady in Avon (UK),24declining in Norway,18 and fluctuating in Australia.21 Birth weight specific rates for newborns in our study are still rising both for babies < 1500 g and those 1500–2499 g. For normal birth weight babies, there is no sign of a fall.
On applying a threshold of severity of 30%, the data become intrinsically more reliable: the rate increases are more striking and reach higher levels of statistical significance in spite of smaller numbers.
The rates of cerebral palsy in newborns < 2500 g have increased across the severity spectrum, with no change in the relative proportions of different severities. In newborns ⩾ 2500 g, the proportion with severe cerebral palsy has fallen. The overall effect is that newborns < 2500 g now contribute over half of all cases of severe cerebral palsy.
SPECIAL FEATURES OF OUR SURVEY
The only comparable studies in terms of duration and continuity are from the United Kingdom (Mersey),1Sweden,17 and Australia,20 ,21 which, like ours, benefit from consistent application of inclusion and exclusion criteria for motor impairments associated with syndromes and diseases.25 The Swedish study, however, identifies currently resident cases every five years rather than reporting cases from a cohort resident at birth, as we do, and excludes children who die before 2 years of age. The Mersey and Australian studies are likely to be less accurate diagnostically because data are taken from cases notes, whereas in our study all children were examined by a developmental paediatrician for the purposes of the survey. The incorporation of a global measure of severity in our study is a unique feature. The instrument is valid over the age range of children in the study but its stability over time for an individual child has only been studied over four years duration.5 We cannot therefore be certain that the LAS of individual children born in the first six years (1964–1969; the children were already over 10 years of age at time of assessment) would have been the same if measured at the younger age at which subsequent children were assessed.
ASCERTAINMENT AND SEVERITY
Only one other cerebral palsy survey, from California,26 acknowledges the importance of incorporating a threshold measure of severity and uses a case definition of “moderate or severe congenital cerebral palsy at three years as determined by standardised examination; children without functional impairment are excluded”. They also excluded cases who died or migrated before the age of 3. Applying these criteria to our cases with severity ⩾ 30% for the same period 1983–1985, our rate of 1.3 was very similar to theirs of 1.2 per 1000 neonatal survivors.
If the milder cases in a register cannot be ascertained reliably, at what level should a threshold be set? We have presented analyses at a 30% threshold because at this level all children are likely to need some extra help in school and/or be unable to carry out some self help activities. The level therefore provides a basis for international comparisons, as all registers should ascertain such children. This level also seems valid because almost all the trends we report achieve a higher level of statistical significance at the 30% threshold in spite of the numbers of children being smaller. For analysis of time trends within a single register which uses consistent methods of ascertainment, the local threshold may be able to be set lower.
CHANGES IN DISTRIBUTION OF SEVERITY WITHIN BIRTH WEIGHT GROUPS BY YEAR
It is difficult to compare and interpret data on severity in the international literature because few studies report data over a long period and no other studies use a global measure of severity. Some studies report individual disabilities such as mobility, learning, manual, or convulsions but there are variations in definition.
The main study with which to compare changes in distribution of severity is that of Pharoah et al,1 who reported on births from 1966 to 1989. We have applied to our data for this period the disability criteria used by Pharoah et al. In newborns < 2500 g, the proportion of severe motor disability rose from 19% to 24% in his series and from 17% to 40% in ours; for severe learning disability, the proportion was steady at 27% in his series and fell in ours from 33% to 19%. In newborns ⩾ 2500 g, the proportion of severe motor disability fell a little from 28% to 25% in his series and more from 36% to 19% in ours; for severe learning disability, the proportion fell from 38% to 32% in his series and fell in ours from 37% to 26%.
In Denmark19 the proportion of severe motor disability was steady at 45% from 1971 to 1986, with little variation by birth weight. In Sweden from 1960 to 1990, the proportion of severe motor disability in preterm cases up to 1982 rose from 25% to 50% and then declined to 39%, and term newborns showed a steady rise from 23% to 38%.
The application of a global measure of severity overcomes the great difficulty of comparing registers that use different definitions and separate individual disabilities rather than measuring overall impact on the child. Such application to our data showed that from 1964 to 1993, newborns weighing ⩾ 2500 g showed a statistically significant decrease in proportion of severe cases from 34% to 21%, whereas in those < 2500 g the proportion did not change significantly.
POSSIBLE REASONS FOR OBSERVED CHANGES
Although the main causes of cerebral palsy occur in the antenatal period,27 it is not known what has caused the changes in rates over the last 30 years. It is unlikely that the contribution of the main antenatal causes has changed because rates of cerebral palsy in newborns ⩾ 2500 g have hardly changed. It is also unlikely that the quality of perinatal care has worsened, as the proportion of those with the most severe cerebral palsy has fallen in newborns ⩾ 2500 g. The increase in rates in those < 2500 g is therefore likely, as suggested by Pharoah et al,1 to be due to babies surviving with cerebral palsy who would have died. The following groups of newborns < 2500 g who would have died may now survive. (a) Babies with a brain already compromised in utero some time before the onset of labour may now survive because of improved perinatal care. (b) Babies with normal brains on entering labour are compromised during labour and delivery but may now survive because of improved perinatal care. (c) Babies with normal brains on entering labour are delivered without problem but may be compromised by the neonatal care necessary for them to survive their prematurity.
The correct explanation is speculative but should be able to be elucidated through greater understanding of how cerebral palsy rates are influenced by gestation and growth retardation, by greater understanding of the timing and natural history of abnormal brain images in those with and without cerebral palsy, and by detailed studies of neonatal care.
CONCLUSION
Modern obstetric and neonatal care is associated with a substantial increase in the overall rate of cerebral palsy due mainly to the increases in the rate of cerebral palsy in those < 2500 g. Many newborns < 2500 g who would have died now survive with cerebral palsy, which is no less severe than it used to be and is indeed now more severe than that in normal birth weight babies. Such care therefore comes at a heavy human and financial cost with respect to cerebral palsy—the commonest most consequential physical disability in childhood.
A global measure of severity should be included in registers of cerebral palsy to inform service planning, to describe changes in distribution of severity, and to allow the application of a threshold. A threshold is especially important for international comparisons where ascertainment of milder cases will be most variable but where valid comparisons will be most helpful.
Acknowledgments
The collaborators in the North of England Collaborative Cerebral Palsy Survey are: E Elliot and R Carpenter, Darlington; S Pandy and N Cookey, Durham; A Paynter, East Cumbria; R Menzies, Gateshead; K Agrawal, Hartlepool; C Jessen, Northumberland; K Whiting, North Tees; J Lindley, South Cumbria; E Lee, South Tees; H Palmer, South Tyneside; P Jones and A Johnson, South West Durham; E Saharia, Sunderland; S Norton and V Wood, West Cumbria.
We thank the following: the parents of the children with cerebral palsy for their involvement and interest in the survey; Dick Ellis, Mary Danskin, and David Gardner-Medwin, who helped plan the survey and were closely involved with ascertainment and assessment of children in its earlier phase; Robyn Marley who maintains the register; SCOPE and health authorities in the northern region for funding the necessary administrative support, and SCOPE for funding part of the salary of two of the authors for three years in the 1980s.