Article Text

Abstract
Objective This study aimed to use primary care electronic health records to evaluate the prevalence of overweight and obesity in 2–15-year-old children in England and compare trends over the last two decades.
Design Cohort study of primary care electronic health records.
Setting 375 general practices in England that contribute to the UK Clinical Practice Research Datalink.
Patients Individual participants were sampled if they were aged between 2 and 15 years during the period 1994–2013 and had one or more records of body mass index (BMI).
Main outcome measure Prevalence of overweight (including obesity) was defined as a BMI equal to or greater than the 85th centile of the 1990 UK reference population.
Results Data were analysed for 370 544 children with 507 483 BMI records. From 1994 to 2003, the odds of overweight and obesity increased by 8.1% per year (95% CI 7.2% to 8.9%) compared with 0.4% (−0.2% to 1.1%) from 2004 to 2013. Trends were similar for boys and girls, but differed by age groups, with prevalence stabilising in 2004 to 2013 in the younger (2–10 year) but not older (11–15 year) age group, where rates continued to increase.
Conclusions Primary care electronic health records in England may provide a valuable resource for monitoring obesity trends. More than a third of UK children are overweight or obese, but the prevalence of overweight and obesity may have stabilised between 2004 and 2013.
- Obesity
- Monitoring
- Epidemiology
- Growth
This is an Open Access article distributed in accordance with the terms of the Creative Commons Attribution (CC BY 4.0) license, which permits others to distribute, remix, adapt and build upon this work, for commercial use, provided the original work is properly cited. See: http://creativecommons.org/licenses/by/4.0/
Statistics from Altmetric.com
What is already known on this topic
-
Evidence from international sources suggests that childhood obesity levels may have started to plateau.
-
The Health Survey for England and the English National Child Measurement Programme provide evidence on childhood obesity but with small samples or limited age ranges.
What this study adds
-
Primary care electronic health records in England are suitable for monitoring obesity trends in children.
-
More than a third of UK children are overweight or obese, but the prevalence may have stabilised between 2004 and 2013.
-
In the older age group (11–15 years), the upward trend was still evident, highlighting the need for interventions to focus on this age group.
Introduction
Obesity has become an important public health priority.1 Several determinants of obesity originate in or before childhood,2 ,3 and obese children may become obese as adults.4 Obesity in children has increased dramatically5 with important clinical and economic impacts.6 Consequently, understanding trends in obesity is important for monitoring population health and informing policy initiatives. Recent reports suggest that the increase in obesity in children may have levelled off since 2000.7 ,8 However, only a few countries have data on younger children (aged under 6 years). Stabilising trends in children are reported for the USA,9 ,10 the Netherlands11 and Australia.12
In England, childhood obesity prevalence data have been collected in the Health Survey for England (HSE) since 1995,13 and in the National Childhood Measurement Programme (NCMP) since 2005.14 Both provide important information, but data from the HSE are limited by the small number of children included each year, while the NCMP only includes data for children in reception and year 6 classes. Data from the HSE suggest that the prevalence of overweight and obesity among 2–15 year olds peaked in 2004–2005 and may have declined slightly since.15 Data from the NCMP suggest that overweight and obesity prevalence declined between 2006 and 2013 in 4–5 year olds, but increased in 10–11 year olds.16
The Clinical Practice Research Datalink (CPRD) is a large database holding the electronic health records of about 7% of UK family practices. The present study aimed to use primary care electronic health records to examine prevalence of overweight and obesity in 2–15-year-old children in England from 1994 to 2013, and to compare trends over two decades.
Methods
Study population
Data were obtained from the UK CPRD. The CPRD includes research quality data on 5.5 million currently registered UK primary care participants from over 680 family practices.17 The size and geographical distribution of general practices are broadly representative of the UK population, and the validity of data is good.18 The protocol was approved by the Independent Scientific Advisory Committee (ISAC 13-194). The sample was restricted to 375 general practices in England that participate in the data linkage scheme. Individual participants were sampled if they were aged between 2 and 15 years during the period 1994–2013.
Anthropometric and demographic data
For children under the age of 16 at the time of data extraction, month and year of birth are available, while, for children age 16 and over, only year of birth is recorded. The day of birth was estimated using the date of the first health record entry in the CPRD if this was in the same year and month as the recorded year and month of birth (64.5% of cases). The midpoint (15th) of the month was used as an approximation for the remaining cases with known month of birth (19.4%), while 1 July was used for the remaining cases with known year of birth only (16.1%).
The CPRD includes values of weight, height and body mass index (BMI). There may be several reasons why anthropometric data are recorded in primary care. Selection processes might introduce bias because those measured may not be representative of all registered children. When the BMI was not recorded, values were calculated from height and weight. Values for BMI were then converted into SD scores (SDS) adjusting for exact age and sex using the British 1990 growth reference data.19 Extreme values with SDS <−5 or >5 were removed. Only the first BMI observation per study year per child was included in the analysis, but children could contribute multiple BMI records across several study years. Overweight and obesity were defined as a BMI-SDS larger or equal to +1.04 and +1.64, respectively (equivalent to a BMI at or above the 85th and 95th centile, respectively) of the 1990 reference population.19
Statistical analysis
Results are presented in three age groups (2–5 years, 6–10 years and 11–15 years) and by sex. Multilevel mixed-effects logistic regression analysis was used to examine linear trends in prevalence of overweight (including obesity) from 1994 to 2003 and 2004 to 2013. The interaction term between study year and decade was tested to investigate whether trends have changed over the two decades. Analyses take into account clustering of participants within general practices and individual children as random effects and are adjusted for age and sex as fixed effects. When fully adjusted models failed to converge, partly adjusted (ie, only for age or sex) or unadjusted models were fitted.
In order to evaluate trends over time, multilevel logistic regression analyses were conducted with overweight (vs no overweight) as the dependent variable and year of measurement as the independent variable. Analyses were repeated with obesity alone as the dependent variable to examine if trends were similar for obesity and overweight (including obesity). In all analyses, study year was the main independent variable, and the derived OR indicates the annual increase in the odds of overweight and obesity. For ease of interpretation, the annual increase is presented as percentage change in the odds of overweight and obesity (eg, 4.2% from OR=1.042). Stata v13 software was used.
Results
In 1994 there were a total of 134 061 children aged between 2 and 15 years in the CPRD, and this increased to 479 958 in 2009 and was 427 188 in 2013. The final analysis included data from 370 544 children contributing a total of 507 483 BMI observations across the study years (average 1.4 BMI observations per child). The majority (N=287 424) contributed one observation, while the remaining contributed two to a maximum of 14 observations. Characteristics of the study sample are shown in table 1. There were 39% of the observations between 1994 and 2003 (referred to as decade 1), while the remaining 61% were taken between 2004 and 2013 (referred to as decade 2).
Distribution of BMI records from 370 544 individual children in 1994–2013
Prevalence of overweight (including obesity) between 1994 and 2013
The prevalence of overweight (including obese) is presented in table 2. Among 2–5-year-old boys, prevalence rates ranged between 19.5% (1995) and 26.0% (2007), while among 6–10-year-old boys this was between 22.6% (1994) and 33.0% (2011), and was highest among 11–15 year olds, ranging from 26.7% (1996) to 37.8% (2013). Similar findings were found for girls, with prevalence rates ranging from 18.3% (1995) to 24.4% (2008) among 2–5 year olds, from 22.5% (1996) to 32.2% (2005) among 6–10 year olds, and from 28.3% (1995) to 36.7% (2004 and 2012) in 11–15-year-old girls.
Prevalence of overweight and obesity by study year, age group and sex among 370 544 children with 507 483 BMI records
Annual increases by decade
Trends overtime are presented in figure 1, showing clear annual increases in the first decade (1994–2003), but less so in the second decade (2004–2013). Logistic regression models examined if changes overtime differed by decade, sex and age group (table 3). Values represent the percentage increase in odds of overweight (including obesity) per calendar year, in the full sample and in subgroups by decade, sex and age group.
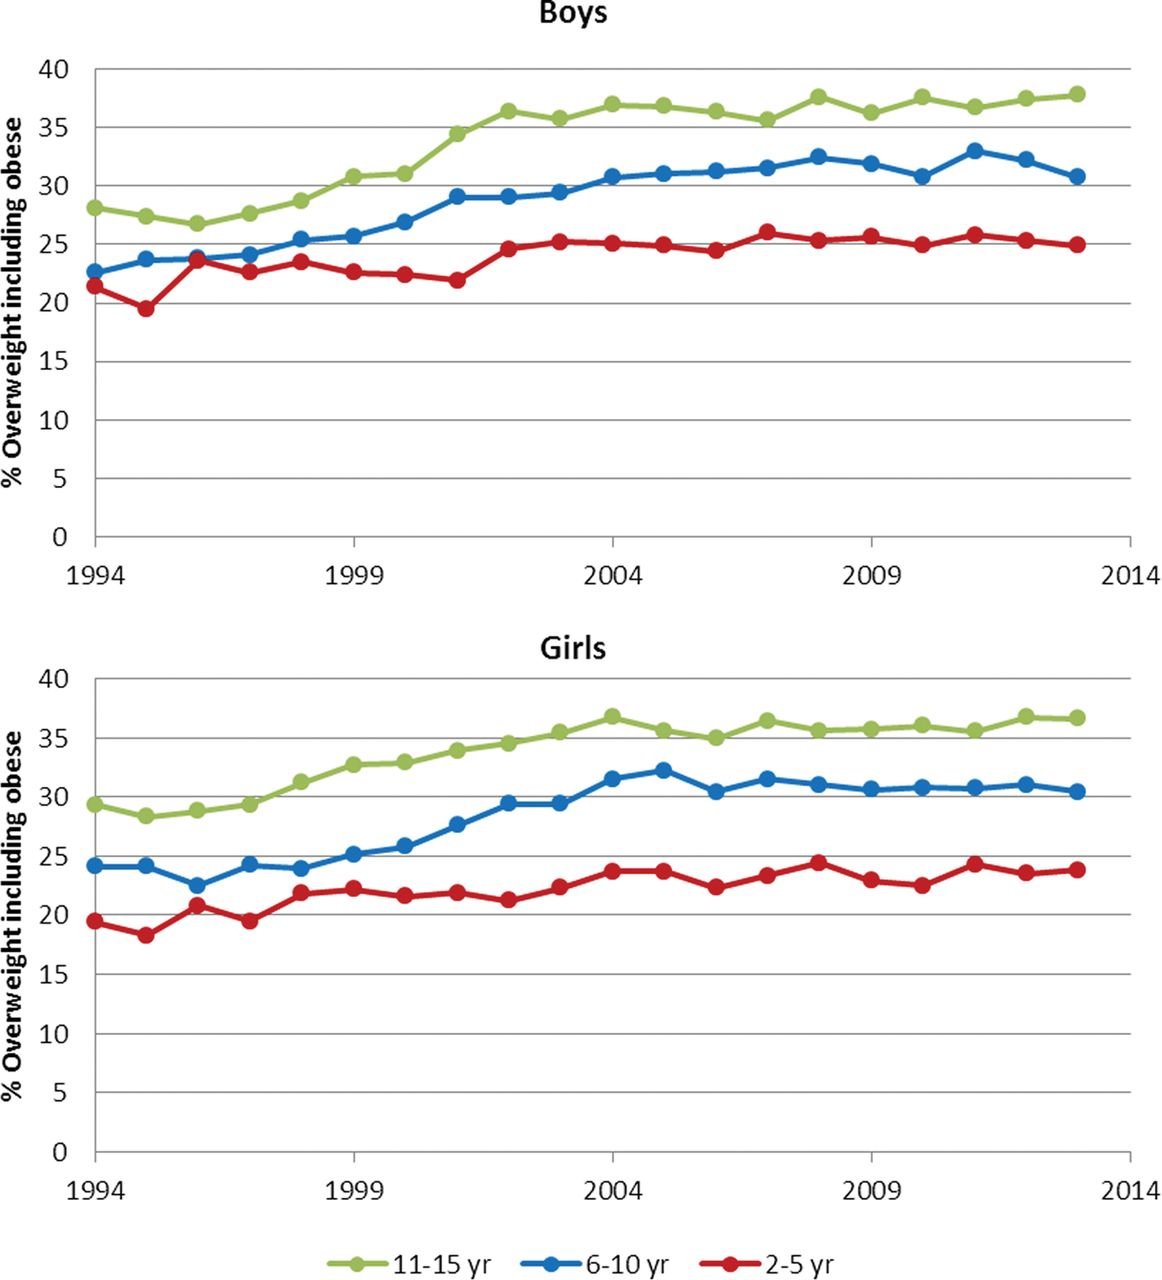
Prevalence of overweight and obesity by study year and age group in boys and girls.
Percentage increase in odds of overweight and obesity per calendar year from 1994 to 2013, by decade, sex and age group
For the full sample, the odds of overweight (including obesity) increased 4.2% per study year (95% CI 3.9% to 4.5%). This annual increase differed by decade and was significantly greater from 1994 to 2003 (8.1%, 95% CI 7.2% to 8.9%) compared with 2004–2013 (0.4%, 95% CI −0.2% to 1.1%), as indicated by the significant interaction term between decade and year (p<0.001, see table 3). Annual increases over the later decade were not significant, indicating that rates of overweight (including obesity) are stabilising in the full sample of children across age groups and both sexes.
Annual increases by sex
Annual increases did not differ by sex as indicated by the non-significant interaction between study year and sex (p=0.244). Both in boys and girls, the annual increase was significant in the first decade (8.6% and 7.5%, respectively) but not in the later decade (0.5% in both sexes, similar to findings in the full sample; see table 3).
Annual increases by age group
Annual increases differed by age group as indicated by the borderline significant interaction between study year and age group (p=0.08), and showed smaller increases in the younger age group (age 2–5 year: 2.4%, 95% CI 1.9% to 2.9%) compared with the older age groups (5.1% and 5.7%, respectively, in 6–10 year olds and 11–15 year olds). When the annual increases were analysed by age group, results showed that increases were significant in all age groups in decade 1 (1994–2003), but annual increases were not significant in decade 2 (2004–2013) in the younger (2–5 year) and middle (6–10 year) age groups. Increases were still statistically significant for the older age group (11–15 year) in decade 2, albeit significantly smaller compared with the first decade (1994–2003: 12.0%, 95% CI 10.3% to 13.7%; 2004–2013: 2.6%, 95% CI 1.4% to 3.8%), as indicated by the significant interaction term (p<0.001).
Obesity
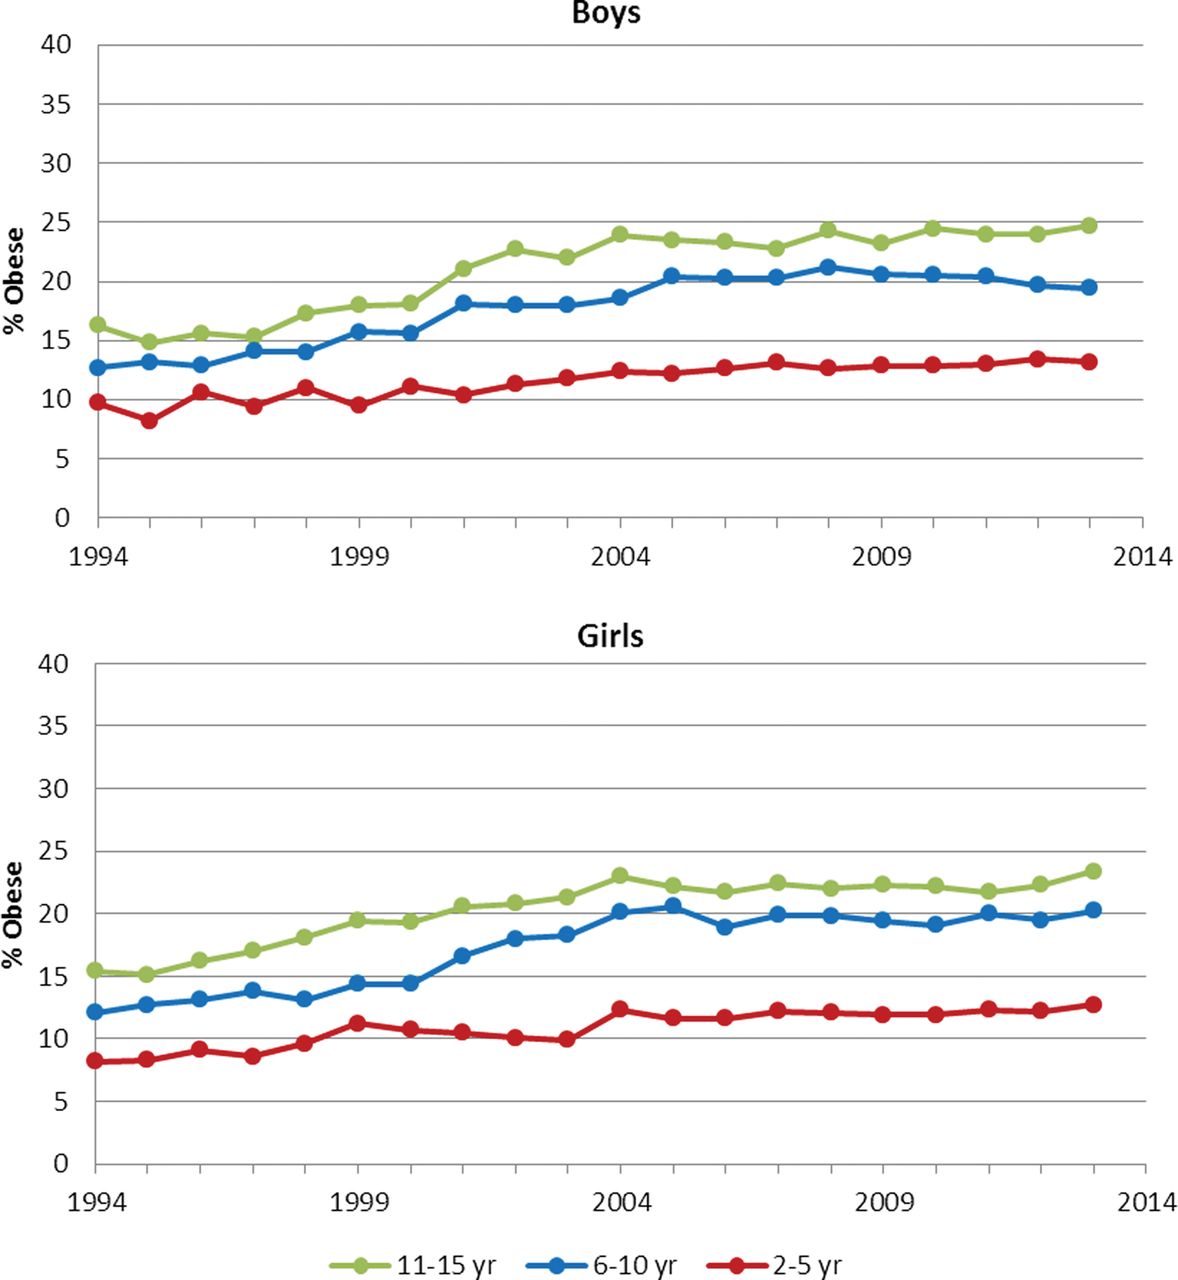
The prevalence of obesity increased over the study period (figure 2), in all three age groups in both sexes. Estimated trends were comparable to those shown for overweight (including obese), indicating significant increases in the first decade but no significant trends in the later decade (data not shown). Again trends were similar for boys and girls, but differed by age groups, with obesity prevalence stabilising in 2004 to 2013 in the younger (2–10 year) but not older (11–15 year) age group, where obesity rates continued to increase.

Prevalence of obesity by study year and age group in boys and girls.
Discussion
This study contributes to proof-of-concept for use of primary care electronic health records to evaluate children's obesity in England and suggests these may provide a valuable resource for monitoring obesity trends. Observed trends in childhood obesity are dramatically different between decades, with an annual 8% increase during 1994–2003 and a small 0.4% annual increase during 2004–2013, which is not a significant increase despite the large numbers included in the analyses. Our findings also indicate that only among 11–15 year olds does prevalence still increase, whereas in younger ages annual increases stabilised between 2004 and 2013. Observed prevalence rates of overweight and obesity and trends in the CPRD are consistent with those reported in the HSE15 and NCMP as noted above.16 No obvious differences between sexes were identified,8 although data from the HSE suggest that a downward trend occurred in girls.20
There are several possible theories for the recent stabilisation of childhood overweight and obesity rates. One explanation may be that rates have reached a point of saturation.7 The cumulative effect of public health campaigns may now be resulting in stabilisation of prevalence of overweight and obesity in children. Lastly, an alternative explanation may be that it is an artefact from the electronic data used in our study. However, similar trends have been reported for other data sources and countries.7 ,8
Strengths and limitations
The study has shown that the CPRD includes a large number of BMI records across the full age range of children. This is important in terms of generalisability and validity to draw conclusions on a national level. It also allowed us to study trends in subgroups according to age and sex with confidence, as numbers were large even in the subgroups. The CPRD practices, and the CPRD registered population, are considered to be sociodemographically representative of the UK population.17 ,21 We only included the CPRD practices in England that participate in the data linkage scheme. The registered population for these practices generally shows a similar regional distribution to the resident population for England, although there is a slightly lower proportion in Yorkshire and Humber and a slightly greater proportion in the South East region. CPRD data generally have high validity,18 but the validity of height and weight values measured by practice staff requires evaluation.
Participation in terms of percentage of children with measurements in each study year may be low, as very few children have their BMI recorded every year. A limitation is that BMI recording might be biased by confounding by indication, and that BMI is recorded when children are ill, or in those with particularly low or high body weights. Test recording in the CPRD has increased over time, as have concerns with children's obesity, and the latter may influence the propensity for BMI values to be recorded. However, analyses have shown that children who contributed observations to multiple study years did not differ on BMI-SDS compared with those with BMI recorded in only a single study year, and our results were comparable to those observed in other UK datasets (HSE and NCMP).15 ,16 We acknowledge that additional non-linear modelling might contribute to a better understanding of the deceleration in trend, and whether processes might differ across age groups. Ethnic differences in overweight and obesity prevalence are well established, but the CPRD does not include comprehensively recorded data on ethnicity. Socioeconomic differentials in obesity are documented, but there is potential for future research to examine whether socioeconomic differences are consistent in all ages and both sexes.
Conclusion
Primary care electronic health records in England may provide a valuable resource for monitoring obesity trends and may be used to supplement existing surveillance systems. Our data suggest that routine growth monitoring of children may not always be captured into electronic records; improved data recording will increase the utility of this data resource. This study shows that overweight and obesity prevalence in the UK increased during decade 1 (1994–2003) but stabilised in decade 2 (2004–2013). This was observed in both sexes and in the younger age groups (2–5 years and 6–10 years). However, rates continued to increase in older children (11–15 years), albeit at a slower speed than in decade 1 (1994–2003). Increasing the recognition of obesity in primary care, and the effectiveness of interventions delivered through primary care services, represents one important component of the overall policy response.
References
Footnotes
-
Contributors CHMvJ: contributed to the conception and design of the study, carried out data analyses and interpretation of findings, and wrote the first draft of the manuscript. MCG: contributed to the conception and design of the study and the interpretation of the findings, reviewed and revised the manuscript, and approved the final manuscript as submitted.
-
Funding The authors were supported by the NIHR Biomedical Research Centre at Guy's and St Thomas’ National Health Service Foundation Trust and King's College London. This study is based on data from the Clinical Practice Research Datalink obtained under licence from the UK Medicines and Healthcare products Regulatory Agency, and was supported by the National Institute for Health Research (NIHR) Biomedical Research Centre at Guy's and St Thomas’ NHS Foundation Trust and King's College London.
-
Competing interests None.
-
Ethics approval CPRD Independent Scientific Advisory Committee (ISAC 13-194).
-
Provenance and peer review Not commissioned; externally peer reviewed.
-
Data sharing statement Data were obtained from the UK Clinical Practice Research Datalink (CPRD), which is a shared database.