Article Text

Abstract
Background and aims: The optimal dose of thyroxine (T4) in congenital hypothyroidism (CH) during infancy is controversial. Higher doses lead to improvement in cognitive scores, but have been linked to later behavioural difficulties. We have examined the effects of initial T4 dosage on somatic growth — a putative surrogate marker of overtreatment.
Methods: 314 CH children (214 girls, 100 boys) were analysed according to initial daily dose of T4: Group 1 (25 μg, n = 152), Group 2 (30–40 μg, n = 63) and Group 3 (50 μg, n = 99). Thyroid function and weight, length and occipito-frontal head circumference (OFC) standard deviation score (SDS) were compared at 3, 6, 12, 18, 24 and 36 months of age. Linear growth SDS was compared between the three groups using a regression adjustment model at 12 and 18 months of age using birth weight and 3-month data as baselines. Thyroid function was also compared at diagnosis (T0), and 7–21 days after the start of treatment (T1).
Results: At T1 median thyroid stimulating hormone (TSH) for Groups 1, 2 and 3 was 58, 29 and 4.1 mU/l, respectively (p<0.001), Group 3 values remaining significantly lower at 3 and 6 months. Median free T4 (fT4) was within or just above the reference range in all groups at T1, but 7.4% of Group 1 had values <9 pmol/l compared with 5.1% and 0% for Groups 2 and 3, respectively. At 3 months weight, length and OFC SDS values were −0.39, −0.35, 0.09; −0.30, −0.47, 0.32; and −0.03, −0.13, 0.18 for Groups 1, 2 and 3, respectively, indicating relatively large OFC in all infants. A regression adjustment model showed no significant difference in growth rate from baseline and 12 or 18 months of age, between the three groups.
Conclusion: An initial T4 dose of 50 μg daily, normalises thyroid function several months earlier than lower-dose regimes, with no evidence of sustained somatic overgrowth between 3 months and 3 years.
Statistics from Altmetric.com
The optimal dose of thyroxine (T4) during infancy is controversial. It has been shown that doses in the range 10–14 μg/kg/day during the first year, normalise thyroid function more quickly and lead to an improvement in intelligence quotient (IQ).1 2 Bongers-Schokking et al showed that higher IQ and verbal scores are associated both with T4 doses of >9.5 μg/kg/day and with treatment at <13 days of age.3 However, other work has indicated that the initial T4 level, reflecting the severity of intrauterine hypothyroidism, is the main influence on intellectual outcome.4 Moreover, high T4 doses in infancy have been linked with behavioural and concentration problems in later childhood.5
Clearly, the key outcome measure for congenital hypothyroidism (CH) is cerebral function. However, this is difficult to measure, is influenced by factors other than CH and its treatment, and requires follow-up into adulthood. It is known that T4 plays a crucial role in skeletal and brain growth. If infants receive excessive amounts of T4, as in severe neonatal thyrotoxicosis, early fusion of the cranial sutures may occur with frontal prominence and intellectual impairment6 while childhood thyrotoxicosis leads to tall stature.7 Thus, measurement of somatic growth — length, weight and occipito-frontal circumference (OFC) — in early childhood may provide a surrogate marker of T4 effect.
We have examined the effects of differing initial dosage regimes on children with permanent CH in terms of thyroid biochemistry and somatic growth during the first 3 years, in an attempt to determine whether or not higher initial T4 doses had an adverse effect on growth.
PATIENTS AND METHODS
A retrospective analysis of the Scottish CH database (Microsoft Access 2003) was performed. This database has been described in detail previously.8 9 Patients are assigned to the following categories: definite CH, probable CH (together constituting “true” CH), transient thyroid stimulating hormone (TSH) elevation and status uncertain. These criteria have been devised in order to distinguish between true CH and the transient TSH elevation that can occur, particularly in sick newborn infants.10 We defined CH as compensated if venous T4 levels were within the reference range.
Study patients
All patients born between 1979 and 2005 with a diagnosis of true CH were considered for analysis. The initial T4 dose given to the infants had varied according to the clinical practice, at the time of referral, at the various Scottish centres. We divided the patients pragmatically into three groups based on the initial dose of T4 as follows: 25 μg/day (Group 1), 30–40 μg/day (Group 2) and 50 μg/day (Group 3). The dosage in all categories was later modified depending on thyroid function test (TFT) results and clinical features.
True CH patients were excluded when less than two useable data points after birth were available, if they did not start treatment within 28 days of birth or if they did not conform to one of the treatment regimes. While birth weight data were routinely collected, OFC and birth length were not.
During the study period 431 children satisfied the diagnosis of true CH. Of these, 117 were excluded for the following reasons: treatment started >28 days (27); inadequate data points or incompatible treatment regime (81); initial dose of T4 uncertain (7); initial treatment with tri-iodothyronine (2).
Somatic growth indices and TFTs in relation to T4 dosage
We examined TFTs at the time of initial venous sampling (T0), and then 7–21 days after starting T4 (T1). T1 corresponds to an age range of 19–33 days, given that median age of starting treatment was 12 days.8 9
Weight, length, OFC and TFT results were recorded at T1, then where possible from the clinic visit nearest to the following time points: 3, 6, 12, 18, 24 and 36 months of age. If no clinic visit occurred within 30 days either side of these ages then no data were recorded for that particular time point.
Where venous T4 levels were given as total T4 (TT4), we used an approximate in-house conversion factor (division by 7.25) to convert to free T4 (fT4) equivalent. This factor is similar to that reported by Tillotson et al.11
T4 dose/kg body weight at each time point was calculated for each group, given that the subsequent dose of T4 after T1 was subject to alteration by individual paediatricians.
The standard deviation scores (SDSs) for somatic growth were calculated using British 1990 standards.12 Values less than or greater than 3.5 from the mean were excluded from analysis, given the high probability that such values were spurious, resulting from either measurement or transcription error in the source data.
We used two approaches to analyse growth in our patients. First, we examined between-group and within-group differences in weight, length and OFC SDS at the chosen time points. Second, differences in growth between specified time points were determined using a regression adjustment model (see below).
Statistical methods
Statistical analysis of data was performed using Minitab (Minitab Inc., State College, Pennsylvania, USA, version 14). Basic descriptive statistical analysis was performed for each dataset at each time point. Normality of distribution was tested (Anderson Darling test). One-way Analysis of Variance (ANOVA, 95% confidence level) was used to test normally distributed data. A significant result led to a further comparison using three-way ANOVA (95% confidence level). For non-parametric datasets, a Kruskal–Wallis test was used (95% confidence limit, not adjusted for ties), followed by three-way Mann–Whitney test (95% confidence level) when significant differences were found.
In order to detect differences in longitudinal growth in each group, we used a regression adjustment model, correcting for baseline measurement. Analyses were made using birth weight and, since length and OFC were not consistently recorded at birth or at T0, all three parameters at 3 months as baseline measures. These were compared with values at 12 and 18 months of age; these time points are suitably distant from baseline measurements, and thereafter the number of infants measured decreases. If the three-way test was significant then pairwise comparison was performed between the groups using a Bonferroni correction factor.
RESULTS
The distribution of the 314 patients (214 female, 100 male) according to initial T4 dose, was as follows: Group 1 (25 μg/day) n = 152, Group 2 (30–40 μg/day) n = 63 and Group 3 (50 μg/day) n = 99.
Pre-treatment data
There were no significant differences between the three groups for birth weight, gestational age, age at diagnosis, severity of hypothyroidism or the proportion of patients with compensated hypothyroidism (table 1).
Patterns of TSH suppression following treatment with T4
Figure 1A shows the trend in median TSH for each of the three groups. Between-group TSH values were highly significant at T1 and 3 months, and significant at 6 months but not thereafter.
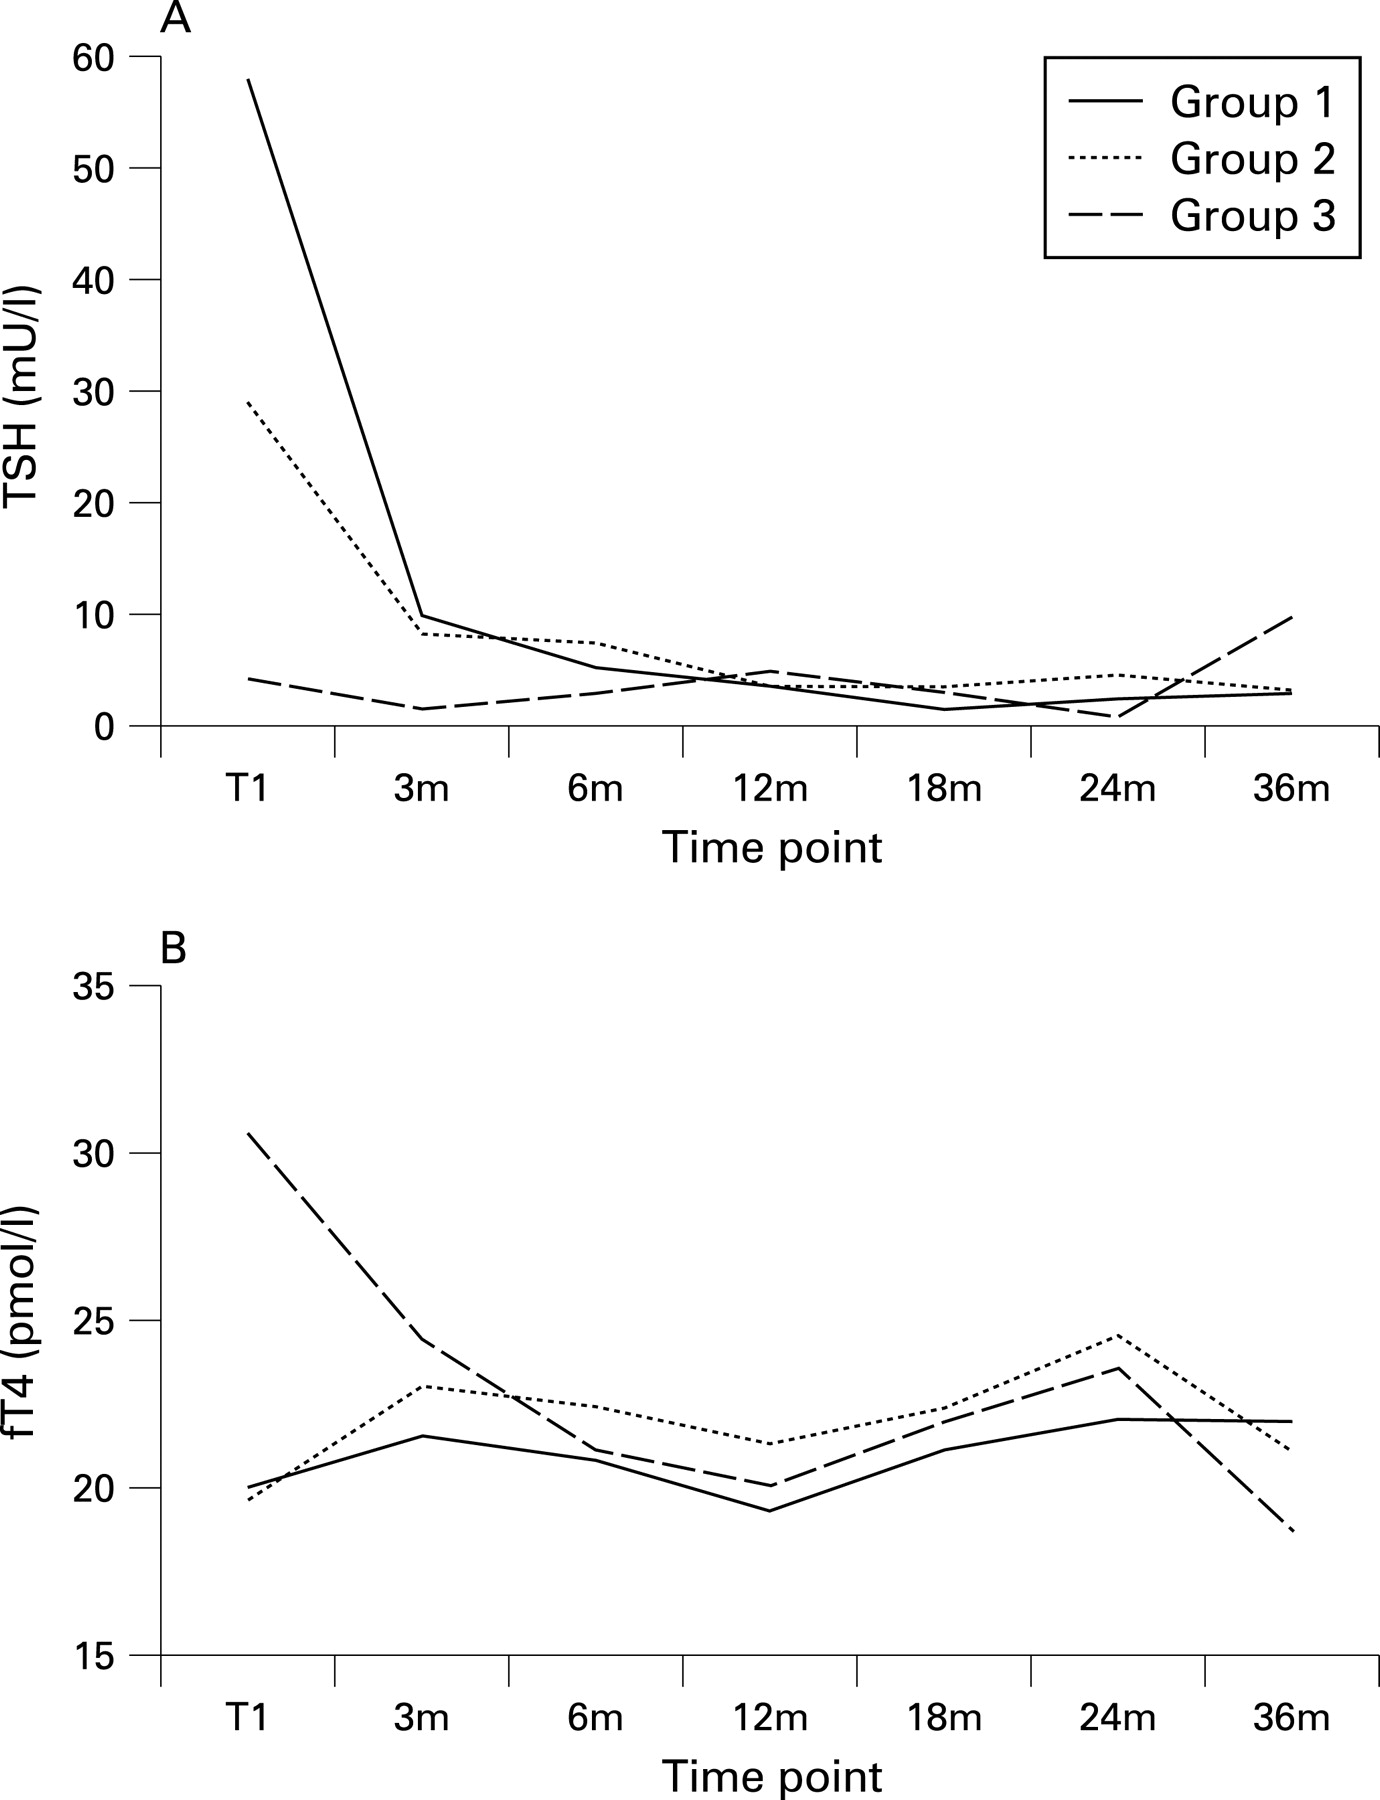
At T1, Group 1 had significantly poorer reduction in median TSH (interquartile range) values 58 (21–100), 29 (11–56) and 4.1 (1.3–9.5) mU/l for Groups 1, 2 and 3, respectively (p = 0.02 for Group 1 vs 2, p<0.0001 for Group 1 vs 2 and Group 2 vs 3). At this time point only 17% and 19% of Groups 1 and 2, respectively, had TSH <10.0 mU/l compared with 79% of Group 3.
At 3 and 6 months of age significant differences in TSH values between Groups 3 and 1, and Groups 3 and 2, persisted but were not found between Groups 1 and 2. At 3 months of age, TSH values were 10 (2.7–25.3), 8 (2.8–16) and 1.5 (0.6–4.6) for Groups 1, 2 and 3, respectively (p<0.0001 for Group 1 vs 3 and Group 2 vs 3), and at 6 months 5.2 (1–16.4), 7.8 (0.9–20), and 2.7 (0.5–7.6) (p = 0.04 for Group 1 vs 3, p = 0.01 for Group 2 vs 3).
Patterns of fT4 levels following treatment with T4
Figure 1B shows the trend in median fT4 for the three groups. Between-group fT4 values were significant at T1 and 3 months (p<0.001) but not thereafter. Median (interquartile range) fT4 values at T1 were 20.1 (15.5–23.8), 19.7 (15.7–27.1) and 30.5 (22.8–35.5) pmol/l for Groups 1, 2 and 3, respectively (p<0.001 for Group 1 vs 3 and Group 2 vs 3). At T1 no infants in Group 3 had subnormal fT4 whereas 6 of 81 (7.4%) in Group 1, and 2 of 39 (5.1%) in Group 2, had fT4 levels <9 pmol/l.
At 3 months fT4 values for Groups 1, 2 and 3 were 21.6 (18.3–26), 23 (18.1–26.2) and 24.4 (19.8–28) pmol/L, respectively (p = 0.009 for Group 1 vs 3). At this time no patients in Group 3 had subnormal fT4 in contrast to 0.9% and 4.4% of Groups 1 and 2, respectively.
Anthropometry
Table 2 shows mean (SD) (n) SDS for birth weight, and weight, length and OFC from 3 months onwards. Of 2745 data points, 0.5% (n = 14) were excluded, since the measurements were either >+3.5 SDS or <−3.5 SDS.
There were no significant differences between the three groups in terms of weight or head circumference (OFC). While Group 1 was shorter than the other two groups from 6 months onwards, the difference in length only reached significance at 24 months compared with Group 2 (p = 0.004). Of note, weight was slightly below the population average in all groups at birth and at 3 months. OFC SDS was greater than weight SDS in all groups at 3, 6 and 12 months and greater than length SDS in Groups 1 and 2 at all time points and up to 12 months in Group 3. From 3 months onwards OFC was 0.09–0.51 SDS greater in Group 3 than Group 1.
Using a regression adjustment model, no significant differences were found between the treatment groups for change in weight, length or OFC at either 12 or 18 months of age (see table 3).
T4 dose per kilogramme per day
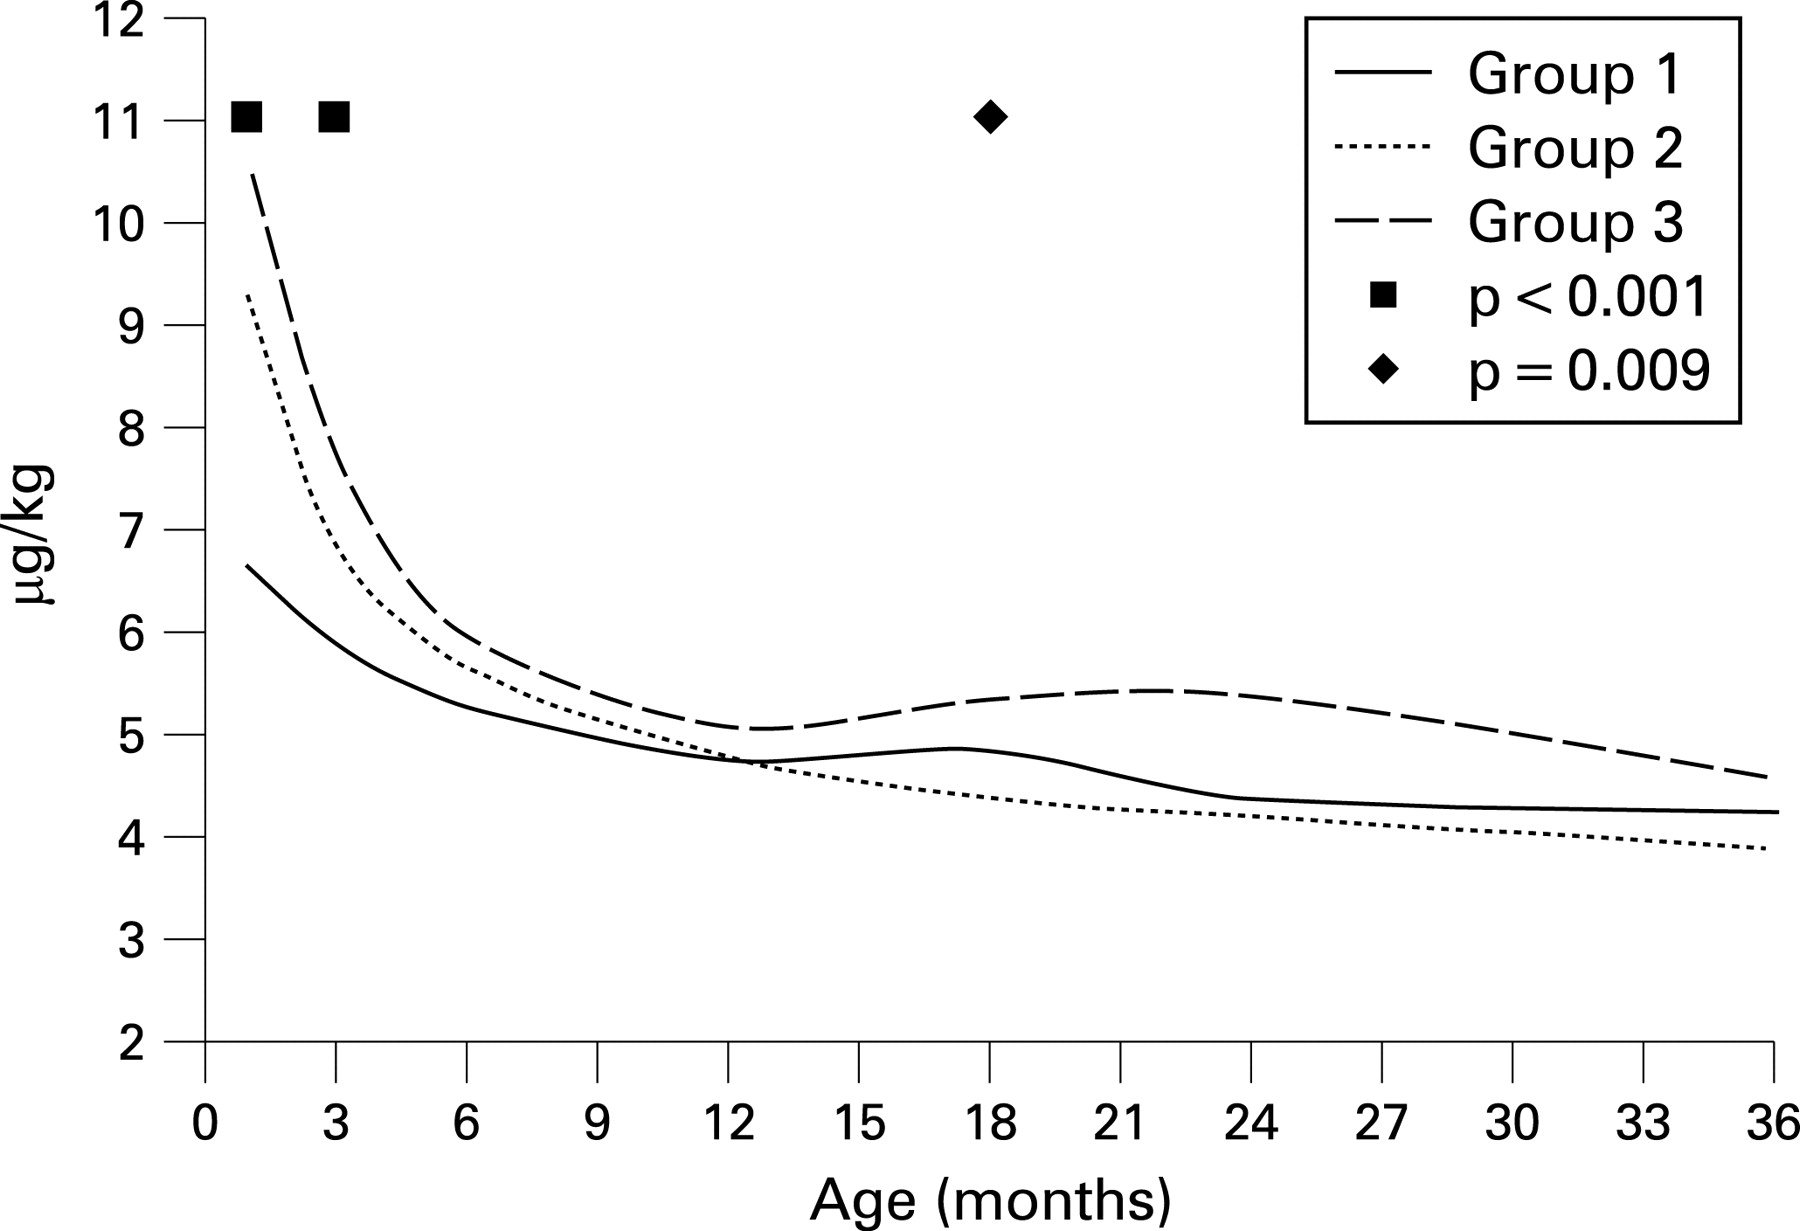
Figure 2 shows the median T4 dose/kg/day at each time point for the three groups. For Group 1 the T4 dose was 6.6 μg/kg/day at T1 and 5.9 μg/kg/day at 3 months, whereas dosage decreased from 9.3 to 6.8 μg/kg/day for Group 2, and from 10.5 to 7.7 μg/kg/day for Group 3 due to a combination of relative and absolute reduction in T4 dosage. Significant differences were found between all groups at T1 and at 3 months of age, but not at 6 or 12 months. At 18 months Group 2 had significantly lower daily dosage than either Groups 1 or 3 (p = 0.02, p = 0.004, respectively), but thereafter there were no significant differences.
DISCUSSION
Although newborn screening for CH with concomitant early treatment has eliminated the severe cognitive and behavioural handicap that occurs with late diagnosis, it is well recognised that some early-treated patients still show IQ deficit, behaviour and attention problems, as well as subtle fine motor, language, and visuo-spatial impairment.13 These problems are partly related to disease severity, as judged by initial T4, bone age retardation and clinical symptoms at diagnosis.2 4 14–16 However postnatal factors also affect cognitive outcome including delay in starting treatment,3 17 the adequacy of, and compliance with, treatment,3 16 18 especially during the first 3 years and socio-economic factors.16
The initial dose of T4 is contentious. While there are data to show that higher doses result in better developmental and IQ scores in the preschool years,1 3 childhood2 5 19 and adolescence15, work by Rovet’s group has indicated that higher doses in early childhood may result in more attention and behavioural deficit.5 This was highlighted in a thoughtful annotation by Hindmarsh20 and may partly explain the findings from a recent survey of practice in the British Society for Paediatric Endocrinology and Diabetes, in which 33 of 126 (26%) members caring for CH infants were still using an initial daily T4 dose of only 25 μg (Jones and Donaldson 2007, unpublished data). However, it should be noted that behaviour and attention deficit may result from unsatisfactory initial treatment of CH, either related to low T4 dose, delay in starting treatment, or both.19 Moreover, a follow-up study in adulthood failed to show an adverse effect with higher starting doses of T4.18
The purpose of our study was to investigate if initial high-dose T4 treatment influenced somatic growth. Although intrauterine T4 deficiency has a more demonstrable effect on bone development than on the brain at birth, the severity of delay in knee maturation is nevertheless a useful predictor of cognitive outcome.21 Moreover there is evidence that elevated levels of T4 affect postnatal head6 and linear7 growth. In view of this we felt that it would be appropriate to examine somatic growth as a possible marker for initial T4 treatment effect during the early years of life in a large, unselected cohort of CH children.
We have clearly demonstrated the efficacy of an initial daily dose of 50 μg T4 achieving TSH suppression and higher fT4 levels compared with lower doses. It is sobering that 6 of 81 patients receiving an initial T4 dose of 25 μg had subnormal T4 levels 7 to 21 days post treatment. Our findings are in keeping with the work of Selva et al who demonstrated normalisation of fT4 within 3 days and normalisation of TSH within 2 weeks of T4 treatment, using an initial dose of 50 μg daily.2 This group also found that with an initial dose of 37.5 μg/day (11 μg/kg/day), fT4 took 7 days and TSH took 2 weeks to normalise. We found that TSH took over 6 months to normalise in the low-dose group, consistent with the study of Ng et al in which the median (range) age at TSH suppression to <6 mU/l was 12 (1.2–48) months in infants with athyreosis.22
Our growth data from 3 months onwards demonstrate the relatively large OFC in CH infants that has been noted previously.22–25 Group 3, which received the highest dose of T4, showed greater SDS for all three growth parameters than Group 1 at all ages. However, the differences in weight SDS at 12 and 18 months were very slight, there was no consistent difference in growth pattern between Groups 2 and 3, and the only significant difference — length at 2 years — was more marked between Groups 2 and 1 than between Groups 3 and 1. Moreover a regression adjustment model showed no significant differences between the three groups in terms of change in any of the growth parameters between 3 months and either 12 or 18 months of age, indicating that the growth rates in the three treatment groups were comparable and do not appear to have been influenced by early treatment regimes.
While we have been unable to show any evidence of overgrowth in CH children treated with higher initial doses of T4, we are conscious of the prevailing concern in the UK over the possible long-term behavioural effects of high-dose treatment. A regime that might be considered involves giving infants with CH, a high initial T4 dose of 50 μg daily for 7 to 10 days, followed by 37.5 μg daily thereafter, titrating subsequent doses to keep the TSH <5 mU/L and fT4 >15 pmol/l. FT4 levels will be high during the first week on this regime but Nelson et al have shown high values immediately following birth in unaffected infants — 28.3–68.2 pmol/l — while after 14 days the reference range was 11.6–29.6 pmol/l.25 Given the biochemical findings in Group 1, we would not recommend a daily starting dose as low as 25 μg in infants with CH.
What is already known on this topic
Early treatment in congenital hypothyroidism in the first few weeks of life will prevent severe cognitive impairment and growth failure.
There is conflicting evidence as to the benefit of relatively high-dose T4 in early infancy. This regimen leads to more rapidly normalised thyroid function and improved IQ scores but there is evidence of later, subtle problems with attention and behaviour.
What this study adds
Early initial high-dose T4 replacement leads to normalised thyroid function several months earlier than lower-dose regimens.
High-dose treatment does not lead to somatic overgrowth — a putative marker for overtreatment with T4 — in the first 3 years of life.
Acknowledgments
We are grateful to the many Scottish paediatricians who have kindly sent us data on their patients with CH. JJ is supported by the Yorkhill Children’s Foundation. BG thanks the European Society for Paediatric Endocrinology (ESPE) for funding a 3-month visiting fellowship to Glasgow in 2006.
REFERENCES
Footnotes
Competing interests: None.
Ethics approval: The congenital hypothyroid database is held on a protected University of Glasgow network, in a secure department at Yorkhill, and is password protected. The Ethics Committee of the Royal Hospital for Sick Children, Glasgow has given permission for information arising from the database, to be submitted for publication, on the understanding that no individual patient can be identified from the data presented.