Article Text

Abstract
Aims: To evaluate the performance of growth monitoring in detecting diseases. Turner’s syndrome (TS) is taken as the target disease.
Methods: Case-control simulation study. Three archetypal screening rules are applied to longitudinal growth data comparing a group with TS versus a reference group from birth to the age of 10 years. Main outcome measures were sensitivity, specificity, and median referral age.
Results: Clear differences in performance of the rules were found. The best rule takes parental height into account. Combining rules could improve diagnostic accuracy.
Conclusion: Growth monitoring is useful to screen for TS. A combined rule that takes absolute height SDS, parental height, and deflection in height velocity into account is the best way to do this. Similar research is needed for other diseases, populations, and ages, and the results should be synthesised into evidence based referral criteria.
- Turner syndrome
- guidelines
- human growth
- screening
- GH, growth hormone
- HSDS, height standard deviation score
- TH, target height
- TS, Turner’s syndrome
Statistics from Altmetric.com
Monitoring child growth and development is a routine part of child health care in many countries. In a typical scenario, the health care worker plots heights and weights on a reference diagram, and assesses whether the growth pattern of the child deviates from that of the reference population. If so, closer examination of the child might be needed. An important goal is to identify diseases and conditions that manifest themselves through abnormal growth. Examples include Turner’s syndrome (TS), growth hormone deficiency, coeliac disease, malnutrition, as well as many rare diseases.
In contrast to its widespread use, current knowledge about the diagnostic performance of growth monitoring is incomplete.1,2 Growth diagrams define the specificity of a single height measurement. The sensitivity of a single height measurement is unknown for even the most frequent diseases. Also, the sensitivity and specificity of measures involving two or more repeated observations, such as height gain, are unknown. The current state of affairs unfortunately precludes an informed discussion about referral criteria. Referral criteria have been evaluated,3–7 but these studies have not prevented the appearance of widely different guidelines. For example, the recent UK guideline is based on just one universal height measurement at age 5.8 In contrast, the Dutch consensus guidelines consist of multiple referral criteria covering infancy, childhood, and adolescence.9 All in all, current practice differs among practitioners, and practices are not founded on evidence.
In order to make progress, we propose that all applications of growth monitoring should be judged along the conventional Wilson-Jungner criteria for screening tests.10 Measures of diagnostic performance include sensitivity, specificity, and median referral time. The latter measure is essential to account for the temporal aspect of the problem.
Of all diseases that might be detected by monitoring growth, TS is one of the most frequent, occurring in 1:2500 female live births. Only 20–40% of the affected individuals, usually the ones with typical clinical features and somatic abnormalities, are diagnosed in the newborn period.11,12 Diagnosis of the remaining patients is made during childhood (usually because of growth retardation) or later (because of lack of pubertal development12). This makes growth retardation the most important referral criterion in the screening process of TS. The average adult height of untreated women is about 20 cm lower than the mean of the population.13 Early detection of TS permits the clinician to counsel the family about the consequences of TS, such as an increased risk for cardiac, renal, thyroid, and auditory abnormalities associated with TS. Early detection also allows for the initiation of treatment with growth hormone, which increases final height substantially if started at a young age.14,15 However, the diagnosis is often made too late,11,16 so that the results of growth hormone treatment are less favourable. Some work has been done to identify girls with TS earlier using height velocity,17 but the diagnostic value appeared limited. The goal of the present study is to gain insight into the diagnostic performance of a broader set of referral criteria for auxological screening for TS in the open population.
METHOD
Screening rules
We investigated screening rules that are suitable for application within the setting of the child health care system. A child that is “screened in” will be referred to a physician for further investigation, eventually leading to the diagnosis of TS. We formulated three archetypal screening rules: an absolute height standard deviation score rule (HSDS), a parental height corrected rule, and a deflection rule (ΔHSDS). Based on the absolute HSDS rule a child is referred if HSDS is lower than some criterion value. The parental height corrected rule takes genetic height potential into account by comparing the HSDS of the child to its target height SDS. The target height (TH) is the expected adult height given the heights of the biological parents and corrected for secular trend. For Dutch girls, the relevant formulas are TH = (maternal height + paternal height − 13)/2 + 4.5 and THSDS = (TH − 170.6)/6.5.18 The deflection rule signals whether an abnormal deflection in height occurs in terms of a change in HSDS per year. Table 1 gives the precise definition of each rule, the description of the free parameters, and default values of the parameters as used in the Dutch guidelines.9
Three archetypal screening rules for growth monitoring with their definition, scenario parameters, interpretation, default parameter values according to the Dutch consensus guidelines,7 and the parameter values used in the simulation
Each screening rule was implemented in a computer program written in S-Plus,19 and each rule was applied to longitudinal height data of children with and without TS. For each screening rule, we computed the sensitivity, specificity, and median referral age for specific scenarios. A scenario is a combination of parameters. We defined scenarios by all possible parameter combinations. We first studied the properties of each screening rule separately. Given these results, we defined scenarios that combined the most promising elements of the separate rules, and computed the outcomes for combined scenarios.
Material
Longitudinal height curves from 777 girls with TS were collected from three sources. The National Registry of Growth Hormone Treatment in Children of the Dutch Growth Foundation contains data of all children in the Netherlands receiving growth hormone (GH) treatment. From this registry, 316 girls with TS, born between 1968 and 1996 were selected. In addition, data from 87 girls with TS, born between 1973 and 1988 from the Sophia Children’s Hospital and the data of 374 Dutch girls described by Rongen and colleagues13 were used. The first two sources contain data of girls that were treated with GH and other growth promoting treatment. For this analysis we used only height measurements before treatment. Karyotype, date of diagnosis TS, the presence of congenital anomalies and/or dysmorphic features and parental height were collected when available. The average numbers of measurements per year per child during the first 10 years were 2.2, 0.7, 0.6, 0.5, 0.5, 0.5, 0.5, 0.5, 0.5, and 0.5, respectively.
A reference sample of longitudinal height data was retrospectively obtained for a cohort of all girls (n = 489) born in 1989 and 1990 in the municipality of Landgraaf, located in the south of the Netherlands. Data were collected from the records of the local child health care centre. These are routinely collected data, and they thus include all measurement errors that are being made in practice. The modal number of observations per girl was 17. Data were collected in 2001, so the oldest girls were about 11 years. The average numbers of visits per year per child during the first 10 years were 8.1, 2.2, 0.8, 0.8, 0.7, 0.7, 0.2, 0.1, 0.1, and 0.8. Table 2 contains additional information about the samples.
Summary statistics for the Turner and reference samples
Statistical analysis
HSDS was calculated with respect to the Dutch height reference data.20 Parental heights were frequently missing (55% of the Turner group, 58% in the reference group). Deleting incomplete records would not only be wasteful, but would also lead to a selective subsample. Mean HSDS of girls with TS was −3.24 for the subsample with missing parental heights, compared to −2.53 for the subsample with known parental heights, but no such differences were found in the reference group. We imputed these data under the assumption that the data are missing at random21 using mice.22 The method created multivariate imputations by applying sequential linear regressions, where each incomplete variable was imputed conditional on all other variables in an iterative fashion. The imputation model consisted of the last known HSDS, weight SDS, weight/height SDS, BMI SDS, age, and the height of the other parent. The number of iterations was set to 15. Predictive mean matching was used to create parental heights imputations. The imputation method possesses important properties: it includes parameter uncertainty, preserves the multivariate structure in the data, and has good coverage properties.23 Figure 1 plots father’s height against mother’s height separately for the real and artificial data. It shows that the distribution is similar in both groups.

Father’s height plotted against mother’s height in the reference sample. (A) Observed data from group in which both parental heights are known (n = 203). (B) Imputed (artificial) data for cases where at least one parental height is missing (n = 286). The reference line indicates the location of equal parental heights.
We assumed that a child is referred the first time the growth pattern meets the criteria of a given screening rule. Multiple referrals by different rules were treated depending on the type of scenario under investigation. As long as we dealt with separate rules, the same child could be referred according to each rule—that is, as if the screening rules operated in isolation, but in any combined scenario, multiple referrals were counted as one. The screening age of children that were not referred before the age of 10 years was taken as 10 years. TS girls with a referral age of 10 under a given scenario are missed, so the proportion of such girls is the false negative rate (1 − sensitivity). The age of 10 years was chosen because treatment of TS, if indicated, could best be started before that age.
Finally, we synthesised our results by fitting linear regression models to the main outcome variables. These models can be used to predict sensitivity, specificity, and median referral age (MRA) in intermediate cases that were not part of the simulation design.
RESULTS
Sensitivity and specificity
Figure 2A is the ROC plot of scenarios under the absolute HSDS rule. Only scenarios with a true positive rate (sensitivity) of at least 40%, a false positive rate (1 − specificity) of at most 15%, and with cut off age p = 3 are plotted. Under the default scenario “(−2.5, −2.5)” children are referred that have an HSDS <−2.5 (a = −2.5, b = −2.5, p = 3). Scenario “(−2.5, −2.5)” has a sensitivity of 70.2% and a specificity of 93.1%. Scenarios (−3, −2), (−3.5, −2), and (−4, −2) have better sensitivity and specificity for detecting TS. Specificity is, however, still on the low side for screening purposes (95–97%), thus these scenarios might lead to substantial numbers of false positives. Scenarios (−3.5, −2.5) and (−4, −2.5) cut down the number of false positives, at the expense of a loss of sensitivity. The influence of p on sensitivity and specificity was limited.
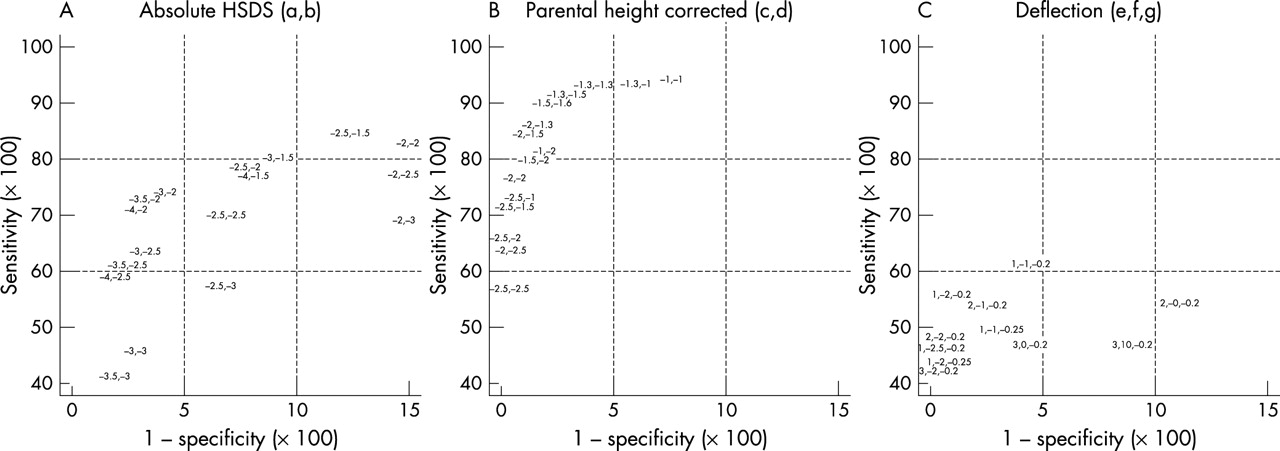
ROC plot of different scenarios under three archetypal rules. Each scenario is labeled by its parameter values according to table 1. For example, the label “(−3, −2)” in the left plot indicates the scenario with a = −3 and b = −2. Only scenarios with p = q = r = 3 (cf table 1) are plotted.
Performance of the parental height corrected rule was generally better (fig 2B). The current Dutch guideline (−1.3, −1.3) pairs a high sensitivity of 93.5% with a specificity of 95.9%. Rules using more stringent cut off points reduce the number of false positive referrals at the expense of sensitivity. Examples of interesting scenarios are (−1.5, −1.5), (−2, −2), and (−2.5, −2.5). Note that for these cases c = d. The difference with the absolute SDS rule is the extra requirement that THSDS > (c–d)—that is, THSDS >0 or taller than average parents.
Screening based on the deflection of the growth curve has low sensitivity for rules with a specificity of at least 85% (cf fig 2C). Though not very sensitive, some deflection rules are highly specific. For example, the rule with e = 3, f = −2, and g = −0.25 (not in fig 2C) pairs a sensitivity of 23% with the maximal specificity of 100. It can be efficient to use such rules in conjunction with more sensitive rules.
Median referral age
Median referral age in the Turner group generally did not exceed 6 years under the absolute HSDS or the parental height corrected rule (fig 3). Median referral age tends to be lower for higher sensitivity and lower specificity. Thus, more cases imply younger cases. This is especially true under scenarios that correct for parental height. The absolute HSDS rule provides the fastest detection of TS, primarily due to the fact that this is the only rule that takes measurements during infancy into account. Earlier detection of TS is possible at the expense of specificity, especially if done through the parental height rule.

Median referral age of girls with TS as a function of sensitivity and specificity under each rule. Every dot corresponds to a scenario.
Predicting sensitivity, specificity, and median referral age
Table 3 contains a synthesis of the results. It gives estimated coefficients of the linear regression for all outcomes. As the proportion of explained variance is generally high, the regression equations can be used to generate fairly accurate predictions for intermediate scenarios not listed in the table. As an example, the estimated sensitivity for scenario (−3, −2) for the absolute HSDS rule is equal to 97.5−3.62a−0.60b−6.04ab = 73.3%. The observed values vary between 74.2% (for p = 3) and 76.5% (for p = 1). In this case, the differences between these observed and predicted values fall within one standard deviation of the residual variation (4.97%).
Regression equations for predicting sensitivity, specificity, and median referral age of the absolute HSDS (sds), parental height corrected (phc), and deflection (def) screening rules, the residual standard error, and the proportion of explained variance (r2)
Combining rules
A child will be referred if he or she meets any of the rules. Sensitivity of a combined rule will be higher than that of its components, while its specificity will be lower.24 Thus in order to create highly specific combinations, the component rules must have high specificity to start with.
Table 4 shows the diagnostic properties of two combinations. Combining the parental height corrected rule (−2, −2) with the absolute height corrected rule (−3.5, −3) increases sensitivity from 76.9% to 82.4%, decreases specificity from 99.4% to 97.5%, and lowers median referral age to 4.7 years. Observe that this combined rule is inferior to the parental height corrected rule (−2, −1.5) in terms of sensitivity and specificity. The story is different for the combination of the absolute rule with the deflection rule (3, −2, −0.25), which refers children with a HSDS below −2 and a deflection of at least 0.25 SDS per year during at least three years. While this rule detects only 23% of the TS group, there is not a single child in the reference group with this growth pattern. The rule picks up a few new cases. Sensitivity increases from 76.9% to 79.2%, whereas specificity remains at 99.4%. This combined rule is better than comparable parental height corrected rules.
Combining rules using a high specificity strategy
DISCUSSION
Growth monitoring is important for detecting TS, but until now no evidence has been available about the diagnostic quality of possible screening procedures. We estimated sensitivity, specificity, and median referral age of TS for three screening rules, and for combinations of these rules. We found that these rules had different performance in discriminating TS. Rules that correct for parental height could identify TS better than rules using the absolute HSDS or rules based on the deflection of growth curves. Combining rules improved performance in particular cases.
The children in our control sample live in the southern part of the Netherlands, and are shorter on average (−0.31 HSDS) than the Dutch reference population. This means that the specificity for the Dutch reference population might be more favourable than estimates based on the shorter population. The equations in table 3 can be used to estimate the size of the effect. For example, setting a = −2, b = −2.5, and p = 1 yields a predicted specificity of 82.5%. Had the group been −0.31 shorter, then substituting a = −1.69, b = −2.19, and p = 1 predicts a specificity of 78.1% for that group. So the actual specificity for a group that is 0.31 HSDS shorter is here 4.4% lower. In order to eliminate such biases, we added 0.31 HSDS to the measurements of the reference group. The existence of regional height differences implies that the actual false-positive rates can vary across the country. The parental height corrected rule and the deflection rule are less sensitive to such differences. Using the equations in table 3, it is straightforward to compute the effect of regional differences on sensitivity and specificity. Region specific screening rules can be created if the effect is substantial. Similar considerations apply to ethnic minority groups.
Diagnosis of TS is often unnecessarily delayed. Excluding the 20–40% of the patients identified in infancy, the median age of diagnosis is somewhere between 10 and 12 years.11,16 Including 30% of the early cases into the calculation would lower the median age of diagnoses to the range of 7–8.4 years. By the time of diagnosis, patients were extremely short (mean −3.0 HSDS). We found that the median referral age of most screening rules studied here is between 4 and 6 years. Some rules even identify 50% or more of the cases within the first year. The current policy in the Netherlands is that GH treatment in girls with TS is applied if HSDS <−1.5 and if the child is older than 6 years, but preferably younger than 9. Before the age of 6 years treatment is only started if HSDS <−2.5. Our results suggest that systematic growth monitoring is able to find the large majority of cases in time.
The occurrence of missing parental heights complicated the analysis. It is inappropriate to simply ignore the records with incomplete parental heights because the shorter TS girls drop out more frequently. This leads to sensitivity estimates that are too low. The effect is substantial. For example, using just the complete cases in scenario c = d = −1.3 and q = 3 results in a sensitivity estimate of 88.7%, compared to 93.5% based on the imputed sample. As it would be unfair to exclude the incomplete cases only for the parental height rule, sensitivity estimates for other rules would also be affected. Imputation yields unbiased estimates for the TS group as a whole. The precision of these estimates is lower than found in the hypothetical case in which we would have had complete data, but it is higher than obtained in the inappropriate complete-case analysis just discussed.
Our results enable informed decisions about specific choices in screening rules for identifying TS. Although growth charts are also used to detect other anomalies, like growth hormone deficiency or coeliac disease, growth monitoring should at least be able to detect TS. If monitoring cannot pick up TS, then it almost certainly will fail in more complicated cases where the effects on growth are less pronounced. It is likely that repeating our study for other diseases will lead to different estimates for sensitivity and specificity. Additional complexities will surface, for example, the lack of a gold standard for diagnosis of growth hormone deficiency. However, such studies would probably not lead to a different ranking among the three rules. We expect that rules that take parental height into account are generally preferable to rules that do not.
The findings appear to be only partially in harmony with published guidelines and proposals.7,9 As anticipated,17,25 we found that centile crossing has low sensitivity and specificity, and in this sense, the Dutch guidelines may need re-evaluation. Marked differences occur with respect to the correction for parental height. Hall and Elliman8 dismissed a correction for parental target height on practical grounds, whereas we found that it represents a substantial improvement, in line with earlier observations by Massa and Vanderschueren-Lodeweyckx.16
We conclude that growth monitoring is useful to screen for TS. The parental height corrected rule will refer 60–77% of the girls with TS before the age of 10 at tolerable levels of false positives—that is, at a maximum of 1%. We recommend the use of the combined rule “phc-def” listed in table 4. This rule refers children older than age three if HSDS is below −2 and if either HSDS is more than 2 SD below the target HSDS, or HSDS shows a deflection of 0.25 SDS per year or more during a period of at least three years. This rule picks up almost 80% of the girls with TS, while it refers only 0.6% of the non-TS population. We also recommend that similar research should be done for other diseases, populations, and ages. The results should be synthesised into general evidence based referral criteria.