Article Text

Abstract
BACKGROUND New “UK 1990” data have been proposed for assessing growth and nutritional status in infancy and childhood. These are still largely untried in clinical practice. There is also doubt about the applicability of more traditional reference data, which are still widely used, in assessing length, weight, skinfold thicknesses, and head circumference.
AIMS To determine the suitability of new and traditional reference data for the assessment of growth and nutritional status in infancy and early childhood.
METHODS 127 infants were recruited at birth and assessed monthly to 6 months of age then at 9, 12, 18, and 24 months. Length, weight, head circumference, and triceps and subscapular skinfold thicknesses were measured. Body mass index (BMI) was calculated. Measurements were expressed as standard deviation scores relative to “revised UK 1990” data for weight, length, head circumference and BMI; relative to Tanner-Whitehouse data for skinfold thicknesses; and relative to Gairdner-Pearson standards for head circumference. Agreement at the extremes of the distribution was assessed by comparison of observed and expected frequencies above the 90th and below the 10th centile.
RESULTS Compared with the revised UK 1990 references small differences were found for weight, length, head circumference, and BMI. Mean head circumference exceeded Gairdner-Pearson standards at all ages. Triceps and subscapular skinfold thicknesses were substantially below Tanner-Whitehouse reference data at all ages and in both sexes.
CONCLUSION Biases in revised UK 1990 reference data are small and not clinically important. The new standards are considerably more appropriate than older reference data. Use of older reference data for head circumference and skinfold thicknesses is inappropriate.
- growth
- nutritional assessment
- nutritional status
- failure to thrive
Statistics from Altmetric.com
Infancy and early childhood are periods of particular risk for growth failure and undernutrition.1 The assessment of growth and nutritional status by objective anthropometric methods (weight, length, head circumference, body mass index, skinfold thicknesses, mid-upper arm circumference) is central to the identification of growth failure and undernutrition,2 but surveys3 have shown that these measurements are rarely carried out. This reflects failings in medical education and the common assumption that simple anthropometric measurements cannot be made by the non-specialist with accuracy and precision in infants: this assumption is incorrect.4
Reference data are central to nutritional assessment, but reference data for infancy used until recently have been limited. Secular trends in growth, and changes in infant feeding practice5-7 have led to the need for new reference datasets. New data for infancy and childhood have been published for weight and length8 and body mass index (BMI).9 BMI is useful for diagnosis and monitoring of failure to thrive or obesity.9 New but unpublished data are also available for head circumference (Child Growth Foundation, UK). The new reference data for weight, length, and BMI from 0–2 years were re-examined recently and the reference dataset has been revised10 in the light of concerns over biases in the original dataset.11 12
Despite the development of these new datasets, older reference data for weight and length,7 head circumference,13 and skinfold thickness14 are still widely used in the UK. This might in part reflect a resistance to change in clinical practice and in part the limited evidence of clear advantages of the new reference data.
The aim of our study was to assess the suitability of new and older reference data by applying them to a representative sample of healthy infants participating in the Glasgow infant growth study (GIGS).
Methods
A sample of healthy, term (37–42 weeks’ gestation) infants was selected using a stratified random sampling frame, based on postal sector, in 1992 and 1993. This covered the entire range of social classes. All infants were singletons and had no evidence of chronic disease. The sample was broadly representative of the west of Scotland population in terms of demographic variables, and infant feeding and weaning practice. The sample characteristics have been described elsewhere15 but, in brief, 39% of the infants were breast fed for at least two months and the median timing of introduction of solid foods was 11 weeks (range, 4–35).
Measurements were made by a single trained observer at home visits monthly to 6 months of age then at 9, 12, 18, and 24 months. At each visit nude weight, supine length, head circumference, and triceps and subscapular skinfold thicknesses were measured using standard methods. One hundred and twenty seven infants were recruited initially but this was reduced by drop out to 122 at the end of year 1 and 112 at the end of year 2.
Comparisons of anthropometric measurements of the sample with existing reference data were made in two ways. First, individual standard deviation (SD) scores relative to each reference were calculated using the “LMS method”. Second, agreement between the GIGS sample and reference data at the extremes of the distribution was assessed by calculating the percentage of the sample above and below the 90th and 10th centiles. For clarity of presentation comparisons are restricted to 1, 3, 12, and 24 months.
For weight, length, and BMI, comparisons were made with “revised UK 1990” reference data,10 and triceps and subscapular skinfold thicknesses were compared with Tanner-Whitehouse reference data.14 Head circumferences were compared with the “UK 1990” data and with the older Gairdner-Pearson reference data.13
Results
WEIGHT AND LENGTH: COMPARISON WITH REVISED UK 1990 DATA
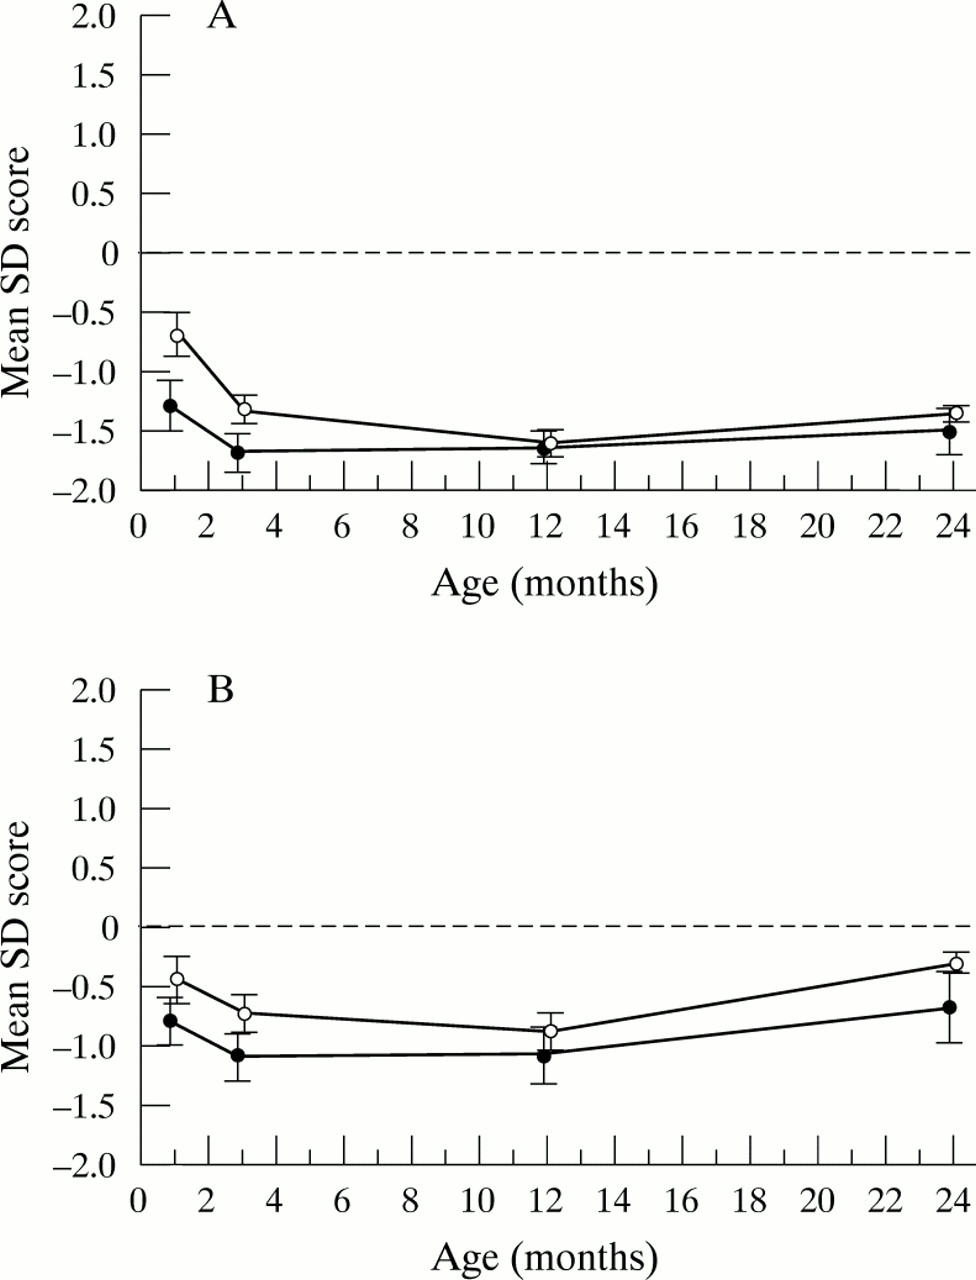
Differences between the sample and the revised UK 1990 references for weight and length were relatively minor (fig1).

(A) Mean weight SD score and 95% confidence intervals (CI) relative to “revised UK 1990” reference data (boys, open circles; girls, closed circles). (B) Mean length SD score and 95% CI relative to “revised UK 1990” reference data (boys, open circles; girls, closed circles).
Table 1 shows the proportions of the GIGS boys and girls within the < 10th and > 90th centile categories for weight and length. There is possibly a small excess of girls, but a deficit of boys, below the 10th centile. The pattern of weight gain was broadly similar between the sample and the revised UK 1990 data.
Percentage of GIGS sample falling above the 90th and below the 10th centile for weight, length, and body mass index, relative to “revised UK 1990” growth references (expected frequency, 10%)
BMI: COMPARISON WITH UK 1990 AND REVISED UK 1990 DATA
Reference data for BMI and the sample BMI agreed well (fig 2). There was some evidence of a sex difference in the percentage of boys and girls falling above and below the 90th and 10th centiles for BMI relative to the revised UK 1990 data (table 1).

Mean body mass index (BMI) SD score and 95% confidence intervals relative to “revised UK 1990” reference data (boys, open circles; girls, closed circles).
HEAD CIRCUMFERENCE: COMPARISON WITH GAIRDNER-PEARSON STANDARDS
In both sexes, group mean SD scores for head circumference exceeded Gairdner-Pearson13 reference data at every time point. The differences were greatest in the first 6 months (at 6 months: mean SD score, +0.90; 95% confidence interval (CI), 0.62 to 1.17 in boys; mean SD score, +0.46; 95% CI, 0.22 to 0.70 in girls). Differences were larger in boys than girls (fig3A).

(A) Mean head circumference SD score and 95% confidence intervals (CI) relative to Gairdner-Pearson reference data (boys, open circles; girls, closed circles). (B) Mean head circumference SD score and 95% CI relative to “UK 1990” reference data (boys, open circles; girls, closed circles).
HEAD CIRCUMFERENCE: COMPARISON WITH UK 1990 DATA
Differences between the GIGS and UK 1990 data were much smaller than for the Gairdner-Pearson comparison (fig 3B) in both sexes.
SKINFOLD THICKNESS: COMPARISON WITH TANNER-WHITEHOUSE STANDARDS
In both sexes, mean triceps and subscapular skinfold SD scores were substantially below the existing reference data (fig 4). Differences relative to reference data were greater for girls than for boys, and were also greater for the triceps site (fig 4).
(A) Mean triceps skinfold SD score and 95% confidence intervals (CI) relative to Tanner-Whitehouse reference data (boys, open circles; girls, closed circles). (B) Mean subscapular skinfold SD score and 95% CI relative to Tanner-Whitehouse reference data (boys, open circles; girls, closed circles).
Discussion
Our study shows that the revised UK reference data are better than the older standards. The GIGS data for length and, more noticeably weight, diverged substantially from the older Tanner-Whitehouse reference, and this confirms earlier observations which suggested the need for new standards.5 6 Growth charts and references based on older Tanner-Whitehouse data are still widely used, and our study provides empirical evidence of the benefits of moving to the new reference data in clinical practice.
Some discrepancies between the GIGS sample, other regional studies,11 and the UK 1990 data were noted. These were of minor clinical importance and might have partly reflected the relatively small sample size and the longitudinal nature of the data collected here: apparent biases at a single time point would have had a tendency to carry over to subsequent time points, although associations between measurements from 3 to 12 and 24 months were weak. It is also possible that differences between the samples related to differences in infant feeding practice might have contributed. Some geographical differences in anthropometry in early childhood within the UK have been described.5 16 17 For research on infant growth and nutritional status, particularly in epidemiology, some of the discrepancies between our sample and the revised UK 1990 reference data might be more important. In particular, the tendency for an excess of girls at the lower end of the distribution for weight and BMI, also observed by others,6 might alter apparent prevalence rates for undernutrition. The question of what degree of difference in anthropometry is acceptable is difficult to answer, and depends on the circumstances—for routine clinical use, the discrepancies observed here are sufficiently small to constitute an argument in support of the new reference data.
Head circumference is an important index that should be measured more often. Our study confirms a marked bias in both sexes relative to the standards still used most commonly,13 particularly in the first 6 months of life. The UK 1990 data fitted the sample much more closely (fig 3) and should be used more widely.
In both boys and girls, the existing Tanner-Whitehouse reference data14 for triceps and subscapular skinfold thickness (fig4) are too high and do not adequately describe subcutaneous adiposity at these sites. We suggest that use of the Tanner-Whitehouse reference data for skinfold thickness should now be discontinued. During the final preparation of this manuscript new evidence that supported this conclusion was published.18
In summary, the longitudinal study of infant growth and nutritional status described here, in a representative sample of healthy infants, has confirmed that biases in revised UK 1990 reference data are small and of no practical concern to clinicians concerned with the “whole child”. The revised UK 1990 reference data are more appropriate than the original UK 1990 version. Our study also shows that older reference data for head circumference and skinfold thickness in infancy, still widely used in the UK, are unsuitable.
Acknowledgments
The authors thank all parents and children involved in the study. The study was supported by Milupa Ltd. We are also grateful to the Greater Glasgow Health Board Information Unit (G Smith; Dr J Womersley) for advice on the sampling frame and access to census data.