Article Text

Abstract
AIM To monitor the growth of 5 to 11 year old English and Scottish children from 1972 to 1994. No similar data are available from any other study.
DESIGN Mixed longitudinal.
SUBJECTS In England 7000 children were sampled in the first year, falling to 5000. In Scotland the original sample was 2000 but this was enlarged later to 3500.
MAIN OUTCOME MEASUREMENTS Height, weight, weight for height index, and triceps skinfold thickness.
RESULTS Height of English children in most age groups increased by more than 1 cm and by more than 2 cm in Scotland during the period 1972 to 1994. Triceps skinfold measurement increased by almost 8% in 7 year old English boys and by 7% in 7 year old girls. In Scotland triceps skinfold measurement increased by nearly 10% in 7 year old boys and by 11% in 7 year old girls. Weight for height index followed a similar pattern.
CONCLUSION Children in England and Scotland are becoming taller for a given age. The increases in fatness indicate an urgent need for realistic interventions for reductions in obesity in the whole population. As weight for height index is less sensitive than skinfold thickness we recommend triceps and subscapular skinfold thickness measurements for monitoring obesity in children.
- weight for height index
- weight
- triceps
- stature.
Statistics from Altmetric.com
Height of 5 to 11 year old English and Scottish children increased from 1972 to 1980,1 but there was little change from 1979 to 1986.2 However a later increase was seen when comparing 1990 data with that collected in 1982.3Increases in weight and triceps skinfold thickness were found in white English children from 1972 to 1980, and in weight, weight for height, and triceps skinfold for Scottish children over the same period.4 Further increases were found in these variables for all groups from 1982 to 1990.3
These results were all from the National Study of Health and Growth (NSHG), a monitoring study of the health and growth of primary schoolchildren, which had a mixed longitudinal design.5The early analyses were based on data for all years from 1972 to 1980, but the later analyses looked at data from non-overlapping groups of children measured in three different years so that explanatory factors could be analysed. However by chance a year below or above the average trend may have been selected. Data collection in the NSHG stopped in 1994. Trends in height, weight, weight for height index, and triceps skinfold are presented, by year age group, mainly in graphical form, for the whole period of the study, from 1972 to 1994.
Subjects and methods
The NSHG surveyed state primary schoolchildren in England and Scotland for 23 years, starting in 1972 and finishing in 1994. Areas were chosen by stratified sampling and then selected schools within those areas were visited annually until 1982 and biennially thereafter.6 At the start of the study the sampling of 22 areas in England was designed to favour poorer areas, but Rona and Altman found that the distribution of social class in the English areas was close to that of England and Wales.7 Six areas in Scotland were sampled separately in 1972; as it was later recognised that this sample was too small a further eight areas were added in 1983. Since 1972 schools have been chosen from the same area or stratum to replace schools that left the study.
All children in selected schools were measured and weighed unless the child’s parents refused. Only children considered white by the fieldworker and aged from 5 to 10 years have been included in these analyses. Results are presented by year and age group. Children younger than 5 or older than 10.99 were excluded because few children were younger than 4.5 years or older than 11.5 years.
Height was measured on a specially designed stadiometer, Holtain, using the method described by Tanner et al.8 Height was recorded to the last 0.5 cm from 1972 to 1976 and to the last 0.1 cm from 1977 onwards; 0.25 or 0.05 cm, as appropriate, was added to correct these biases. Children were measured once by a school nurse, who read the scale and an assistant, who stretched the child, supervised by a trained fieldworker. In the first year of the study children were stretched either by the fieldworker or by an assistant. From 1973 to 1976 the children were stretched by the assistant and from 1977 onwards by the fieldworker. Weight and triceps measurements were also taken by the nurse. Children were weighed wearing only underpants, the weight was recorded to the last complete 100 g. No correction was made to the weight as a correction of 50 g was considered negligible. Mechanical balances were used until 1984. Electronic digital scales were introduced from 1985.
The triceps measurement was taken as recommended by Tanner and Whitehouse9 except that the mid-point between the tip of the acromion and the olecranon was marked with the arm hanging straight instead of bent. This meant that the triceps skinfold was measured slightly above the site that would have been measured if the arm had been bent. From 1972 to 1977 two triceps measurements were taken, each recorded to the nearest complete 0.2 mm, and the mean of the two was used for analysis. Starting from 1978 only one measurement was taken, as two measurements by the same measurer produced little reduction in variation. The intraclass correlation from two measurements by the same measurer was 0.99 in 1972; it was also 0.99 for two measurements taken by different measurers.3 A quality control measurement was made on one in 10 children by the fieldworker. At least one fieldworkers’ trial was held each year to ensure consistency of measurement techniques between fieldworkers.
STATISTICAL METHODS
A suitable transformation was used to Normalise the weight and triceps measurements. Weight was transformed using log10(weight−9), this transformation having been shown previously to Normalise weight and to stabilise variance.10 Triceps skinfold thickness was analysed on the log scale; means were antilogged to give the geometric mean, and mean difference and confidence interval (CI) back transformed to percentage increases. The index log10(weight−9)/height3.7 was used as the appropriate measure of weight for height index for this age range.10
A 95% CI for the difference between the means for 1972 and 1994 for height, log10(weight−9), log10(triceps skinfold measurement), and weight for height index for each age group for English and Scottish boys and girls was calculated. The change in the log10(triceps skinfold measurement) and its CI were back transformed to give a percentage change and 95% CI. Because of the shifted log transformation for weight only an approximate CI can be given for change on the back transformed scale. This was calculated by averaging two CIs, one calculated by adding the limits of the CI on the transformed scale to the 1972 mean, back transforming and subtracting the 1972 back transformed mean, the second from the equivalent calculation starting with the 1994 mean. The mean height, log10(weight−9), log10(triceps skinfold measurement), and weight for height index were calculated for all years from 1972 to 1982 and then biennially until 1994. The 14 Scottish areas were surveyed over a two year period, 1983 to 1984, and so on up to 1993 to 1994. These data were used to plot graphs with linear interpolation joining one data point to the next.
Results
Response to measurement by white children has been high throughout the study, over 95% in almost all years as reported in a number of papers.1 3 A full complement of areas took part each year except in 1977, 1980, 1981, 1990, and 1994 when only 21 English areas took part, and in 1982 when only five Scottish areas were included.
HEIGHT
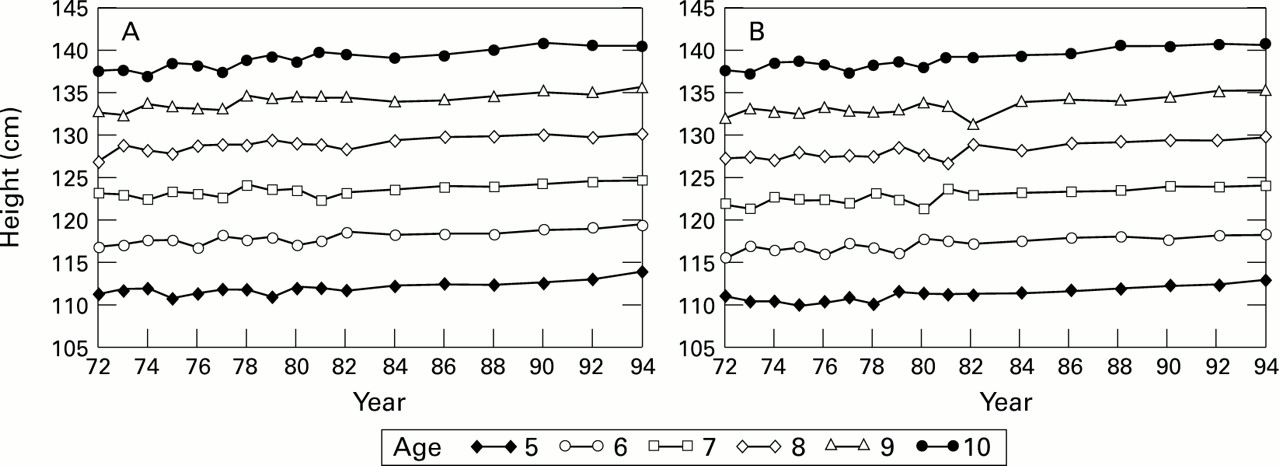
Height increased reasonably linearly over the whole time period for English and Scottish boys and girls (figs 1A and 1B, 2A and 2B). The smaller sample size from 1972 to 1982 is evident from the larger variation between years in the graphs for Scottish children, who showed greater overall increases than the English children (tables 1 and 2). English boys and girls showed a greater increase at older than younger ages, but for children living in Scotland there was a greater increase than for English children, which did not differ significantly (p > 0.05) between age groups. The mean increase was 2.67 cm (95% CI 2.36 to 2.98 cm) in Scottish children compared with 1.39 cm (95% CI 1.18 to 1.59 cm) in English children.
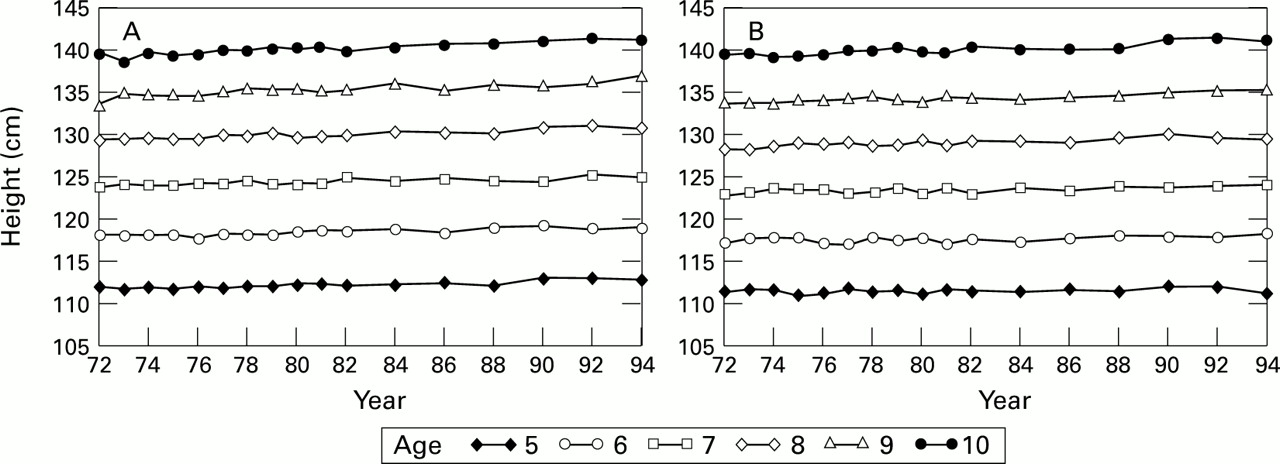
Mean heights of English boys (A) and girls (B), 1972 to 1994.

Mean heights of Scottish boys (A) and girls (B), 1972 to 1994.
Mean height for English children in 1972 and 1994, by age group, the difference, and 95% CI
Mean height for Scottish children in 1972 and 1994, by age group, the difference, and 95% CI
WEIGHT
Weight increased reasonably linearly on the transformed scale (figs 3A and 3B, 4A and 4B). Scottish children increased in weight more than English children. As with height there was a trend in the increases in English children with age group, but not significantly so in Scottish children. Back transformed mean log10(weight−9) in tables 3 and 4 shows that the increases were from 0.2 to 2.3 kg according to age group in English children, and from 1.0 to 3.3 kg in Scottish children.

Mean log10(weight−9) of English boys (A) and girls (B), 1972 to 1994.
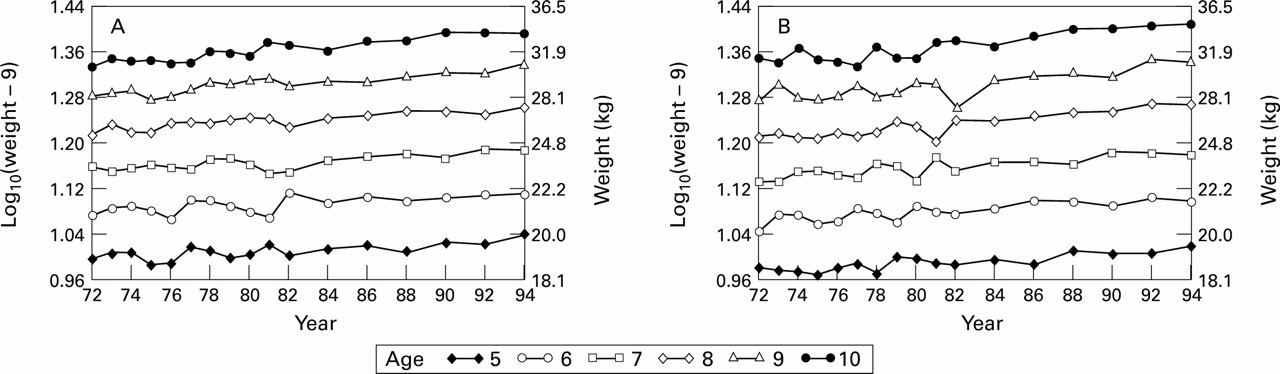
Mean log10(weight−9) of Scottish boys (A) and girls (B), 1972 to 1994.
Back transformed mean transformed weight (BTM) and difference for English childen in 1972 and 1994 by age
Back transformed mean transformed weight (BTM) and difference for Scottish childen in 1972 and 1994 by age
WEIGHT FOR HEIGHT INDEX
The weight for height index was constructed to be independent of age,10 but this does not preclude there being greater increases at older ages. Figures 5A and B and 6A and B show weight for height index in three age bands, 5 and 6 years olds together, 7 and 8 year olds, and 9 and 10 year olds. The youngest English boys show a slight decline, the 7 and 8 year olds remain unchanged, while the oldest show an increase. In Scottish boys the 5 and 6 year olds have remained the same, there has been a small increase in the middle band, while the 9 and 10 year olds show a clear increase particularly from 1982 onwards. In girls in both England and Scotland a clear pattern has emerged since 1980, the youngest age band changing the least, if at all, the middle band showing a clear increase and the oldest girls, the 9 and 10 year olds having the largest increase. During the course of the study girls have shown a greater increase than boys and Scottish children have shown a much greater increase in weight for height index than English children, starting at a lower level and ending heavier for their height than their English counterparts (tables 5 and6).

Mean weight for height of English boys (A) and girls (B), 1972 to 1994.

Mean weight for height of Scottish boys (A) and girls (B), 1972 to 1994.
Mean weight for height for English children in 1972 and 1994, by age group, the difference, and 95% CI
Mean weight for height for Scottish children in 1972 and 1994, by age group, the difference, and 95% CI
TRICEPS SKINFOLD THICKNESS
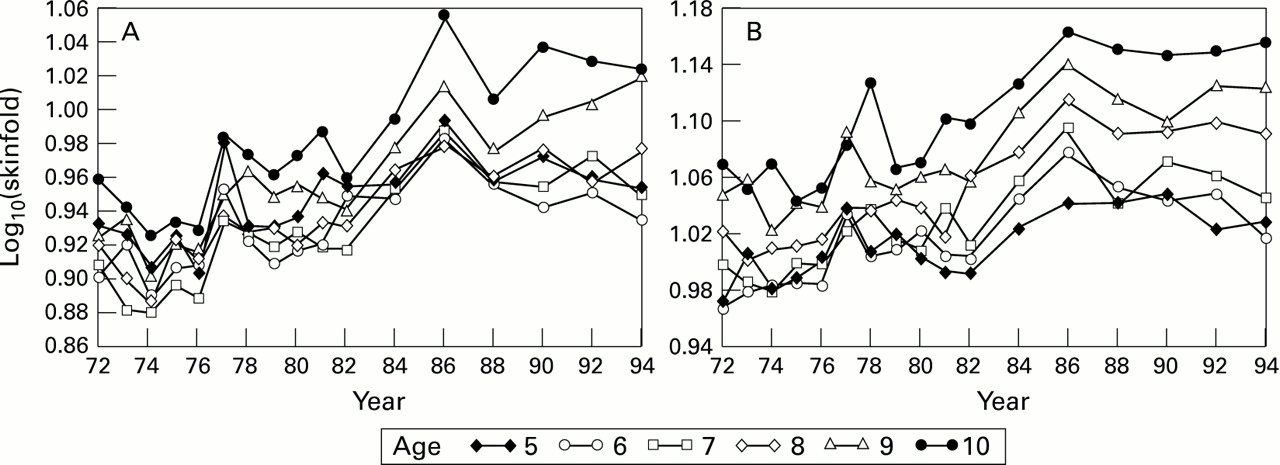
Triceps skinfold thickness, in general, showed a clear upward trend (figs 7A and 7B, 8A and 8B), which was largest in older children but also apparent in the youngest. The trend appears larger in Scotland than in England. Scottish girls showed the largest increases (table 8). The youngest girls increased by more than 10% and the 9 and 10 year olds increased by 19% and 22% respectively. Nine year old Scottish boys showed an increase of slightly less than 24% (table 8), which was a larger increase than in any other group, but the increases for other Scottish boys were smaller than for Scottish girls. The oldest English boys increased by nearly 17%, while the youngest groups increased by about 4% (table 7). English girls showed the smallest increase (table7), but the upward trend is still apparent (fig 7B), even in the youngest English girls. However there is now a suggestion that since 1986, particularly in Scottish children, the increase may have stopped. A curious increase, most noticeable in England, occurred in 1977 and 1978 in the younger age groups. This occurred again in 1986 in children of all ages, much more marked in Scotland than England. Neither could be explained by changes in schools, fieldworkers, or procedure.

Mean log10(skinfold) of English boys (A) and girls (B), 1972 to 1994.

Mean log10(skinfold) of Scottish boys (A) and girls (B), 1972 to 1944.
Geometric mean triceps skinfold thickness (GM) for Scottish children in 1972 and 1994, by age group, the percentage change, and 95% CI
Geometric mean triceps skinfold thickness (GM) for English children in 1972 and 1994, by age group, the percentage change, and 95% CI
Discussion
Figures 1A and 1B and 2A and 2B indicate that the trend towards increased height continues. The various estimates of the trends, in increase per year or cohort, are given in table 9. The increase per year was calculated as the difference between the mean height for all children at the start of the relevant period and that at the end divided by the number of years. Only the 1972 to 1980 estimates,4 with trend measured in cm per cohort, were based on trends over several consecutive years. It is now clear that the conclusion of Chinn et al that the trend in height had ceased was erroneous,2 the 1979 to 1986 estimates being out of line with the rest. Those estimates were based on schools in just 13 English areas and three Scottish areas which participated throughout 1972 to 1986, and were therefore subject to greater sampling variation. It had been intended to reduce possible bias by excluding replaced schools and areas, but Chinn and Rona found no difference in trends between replaced and non-replaced areas.3 Although estimates based on several consecutive years’ data may be preferred to differences between means for just two years, the problem lessens as the time gap increases. Due to the mixed longitudinal data, trends based on consecutive years cannot be combined across age groups easily. The average 1972 to 1994 estimates are close to the 1972 to 1980 estimate, except for Scottish girls, who seem to have increased more, in the older age groups, in more recent years.
Estimates of annual linear secular trends in height (cm) for English and Scottish children
Increasing height for age has also been found in other countries albeit in studies that were completed before or shortly after our own began. In Sweden, Cernerud and Lindgren found that although 7 year old boys in Stockholm born in 1963 were almost the same height as those born in 1953, the height of 10 year olds had increased at 0.07 cm per year.11 The height of 10 year old girls had increased at 0.04 cm per year. The rate of growth for Swedish boys is similar to that found in English boys but smaller than for English girls (table9). A survey of schoolchildren aged between 8 and 14 years old in Oslo, which started in 1920 and ended in 1975, found height increased by 0.055 cm per year in boys and by 0.06 cm per year in girls between 1955 and 1975.12
Previous conclusions from the NSHG in relation to weight and triceps skinfold have been confirmed and further quantified. All groups have shown an increase in weight, but for English boys this has been largely in line with their increase in height. The other groups increased in weight by more than expected for their height, as shown by the increases in weight for height index, which were greatest for Scottish girls. The greater trends in weight for height index in girls and in Scottish children were previously reported,3 with the conclusion that Scottish boys had become heavier and fatter than their English counterparts; it is now evident that Scottish girls have also overtaken English girls.
In the USA no change was found in the weight or triceps skinfold measurement of 8 year old children between the two National Health and Nutrition Examination Surveys (NHANES I and II) that took place in 1971 to 1974 and 1976 to 80 respectively.13 However the short time interval between these two studies may not have allowed a detectable change to develop.
In a study which ended three years after ours started, no increase in weight was found in Oslo schoolchildren.12 There the weight of schoolchildren of both sexes remained stable between 1950 and the end of the study in 1975, which implies that these children have become somewhat slimmer. Weight also remained unchanged in 7 and 10 year old children in Stockholm between 1953 and 1963.11The reasons for this, if they could be ascertained, might be of benefit in planning interventions in Britain.
The previous reports did not highlight the trends with age group reported here, although Chinn and Rona did report greater trends in height at age 8 years than at age 5, and positive trends in rate of growth.1 The NSHG data cannot distinguish between a trend resulting in increased adult height and a trend due to earlier maturation, although the increase in height in the under 8 year olds and the increase reported in adult height in the UK between 1980 and 1991 favours the former.14 It is not possible to distinguish between time and cohort effects, which are confounded, and cannot be separately interpreted for a continuous measurement.
The weight for height index gives an insensitive assessment of fatness, especially in children, because this complex index also includes the contribution of bone, muscle, and water. In spite of its insensitive nature a marked increase for the weight for height index was demonstrated in 9 and 10 year olds and, to a lesser extent, in 7 and 8 year olds. That the trend in weight for height index is mainly due to changes in fatness was confirmed by the consistent increase in triceps skinfold thickness in English and Scottish boys and girls. The increase in triceps skinfold thickness was more marked in older children, but also apparent in the younger age group (5 and 6 year olds). Both types of assessments clearly demonstrated that the increase in fatness was greater in Scottish than English children. An important consequence of our results is that for monitoring purposes a weight for height index may provide false reassurance as long term follow up and large samples are required to demonstrate a trend. We recommend, therefore, the use of skinfold thicknesses, preferably triceps and subscapular, to monitor obesity in children.
The increases in weight for height index and triceps skinfold thickness do not augur well for targets in the reduction of obesity,15 as previously commented by Chinn and Rona,3 who found no consistent differences in trends by social group. Although there is some suggestion that in Scottish children triceps skinfold thickness may have reached a plateau there is no evidence of a cessation of the trend in weight for height index. The presentation of the results for 23 years confirm the essence of previous reports, and in the light of the Department of Health study,16 that found the proportion of obese men and women in the UK had doubled between 1980 and 1993, to 13% and 16% respectively, may provide added incentive for the development of preventive interventions against obesity for the whole population.
Acknowledgments
The authors thank colleagues in the team and all parents, children, and helpers in the study areas. The study was funded by the Department of Health and Scottish Home and Health Department.