Article Text

Abstract
Objective Pulse oximetry is used extensively in hospital and home settings to measure arterial oxygen saturation (SpO2). Interpretation of the trend and range of SpO2 values observed in infants is currently limited by a lack of reference ranges using current devices, and may be augmented by development of cumulative frequency (CF) reference-curves. This study aims to provide reference oxygen saturation values from a prospective longitudinal cohort of healthy infants.
Design Prospective longitudinal cohort study.
Setting Sleep-laboratory.
Patients 34 healthy term infants were enrolled, and studied at 2 weeks, 3, 6, 12 and 24 months of age (N=30, 25, 27, 26, 20, respectively).
Interventions Full overnight polysomnography, including 2 s averaging pulse oximetry (Masimo Radical).
Main outcome measurements Summary SpO2 statistics (mean, median, 5th and 10th percentiles) and SpO2 CF plots were calculated for each recording. CF reference-curves were then generated for each study age. Analyses were repeated with sleep-state stratifications and inclusion of manual artefact removal.
Results Median nocturnal SpO2 values ranged between 98% and 99% over the first 2 years of life and the CF reference-curves shift right by 1% between 2 weeks and 3 months. CF reference-curves did not change with manual artefact removal during sleep and did not vary between rapid eye movement (REM) and non-REM sleep. Manual artefact removal did significantly change summary statistics and CF reference-curves during wake.
Conclusions SpO2 CF curves provide an intuitive visual tool for evaluating whether an individual's nocturnal SpO2 distribution falls within the range of healthy age-matched infants, thereby complementing summary statistics in the interpretation of extended oximetry recordings in infants.
- Respiratory
- Sleep
- Measurement
- Technology
This is an Open Access article distributed in accordance with the Creative Commons Attribution Non Commercial (CC BY-NC 3.0) license, which permits others to distribute, remix, adapt, build upon this work non-commercially, and license their derivative works on different terms, provided the original work is properly cited and the use is non-commercial. See: http://creativecommons.org/licenses/by-nc/3.0/
Statistics from Altmetric.com
What is already known on this topic
-
Extended recording of pulse oximetry can provide important information about the health of an individual relatively non-invasively in a hospital environment.
-
SpO2 reference data, stratified by sleep-state in term infants aged 2 weeks–24 months, are currently not available for modern high temporal resolution pulse-oximeters.
-
Summary statistics, such as mean and medians, do not capture the overall distribution of extended SpO2 recordings.
What this study adds
-
This study provides reference SpO2 statistics, stratified by sleep-state, for healthy term infants aged 2 weeks–2 years, using a current generation pulse-oximeter.
-
Cumulative frequency reference-curves provide an intuitive visual tool for rapidly evaluating whether an individual's SpO2 distribution is within a healthy range.
-
Cumulative frequency plots complement summary statistics and visual inspection of raw data in the clinical interpretation of nocturnal SpO2 recordings.
Introduction
Modern pulse-oximeters non-invasively measure and record high temporal resolution arterial blood haemoglobin oxygen saturations (SpO2), making them a valuable clinical tool in a range of paediatric clinical applications. Published reference ranges have documented the normal ranges of summary measurements such as baseline SpO2, mean SpO2 and median SpO2 values,1–9 with more recent studies expanding reference statistics to include ranges, nadirs, 5th and 10th percentiles of SpO2 distributions and time below specific SpO2 levels.10 ,11 However, many of these studies used devices which are no longer available in clinical practice or present selected parameters specific to particular models and averaging time settings. Furthermore, with modern oximeters capable of recording individual data points for extended periods, it is highly desirable to develop normative measurements which quantify the overall SpO2 distribution. This would be of particular value in the titration of supplemental oxygen requirements in infants with chronic neonatal lung disease12–15 and screening for obstructive sleep apnoea.16
One method of presenting SpO2 data in a graphical, and therefore perhaps more readily interpretable manner, is the SpO2 cumulative frequency (CF) curve. These are produced by some commercial oximetry software, and reference values for healthy preterm infants have been presented by Harigopal et al17 and Ng et al.18 In this approach, the SpO2 CF curve was generated for each infant by calculating the proportion of the recording spent at or below each discrete SpO2 saturation level. CF reference-curves were then generated by calculating the 5th and 50th centiles at each SpO2 value for the study population. Thus, analogous to using a growth chart, by plotting the SpO2 CF curve for a subject of interest over the reference-curves, it can be easily observed whether the infant's SpO2 profile falls within the range expected for a healthy infant. This study thus aimed to present reference ranges for SpO2 summary statistics and CF reference-curves for healthy term infants from the neonatal period to 2 years of age. The impact of manual artefact removal and sleep-state stratification on CF reference-curves and summary statistics are also investigated.
Methods
Subjects and procedures
Complete details of the protocol have been described elsewhere.19–22 Recruitment was from antenatal clinics during the third trimester of an uneventful singleton pregnancy, with 34 healthy Caucasian infants (16 girls) enrolled following birth. The intention of the initial study design was to collect normative data on various cardiorespiratory parameters, including oxygen saturation. The sample size was selected to ensure statistical power to detect maturational changes in key summary variables such as number of SpO2 desaturation events, while being a feasible number in which detailed sleep studies could be performed. Infants were eligible if they were: born by normal vaginal delivery or planned caesarean section at term (38–42 weeks) with normal birth weight (10th–90th percentile),23 Apgar score >7 at 5 min and were from a non-smoking household. Exclusion criteria included congenital or anatomical abnormality; sudden infant death syndrome sibling; supplemental oxygen requirement >5 min following delivery; or a strong maternal family history of atopy.
This prospective cohort was studied with full overnight polysomnogram within the Queensland Paediatric Sleep Service at the Mater Children's Hospital in the neonatal period (day 5–20) and then at 3, 6, 12 and 24 months of age. Scheduled studies were conducted if the infant was well and free of inter-current illness (on physician examination). In the event of a viral respiratory illness, studies were rescheduled to at least 2 weeks after clinical resolution of the illness. A polysomnographic sleep-study was conducted using an EMBLA acquisition system (Embla N7000 system, Natus Medical Inc) and Somnologica software (Somnologica V.3.3.2 Build 1559). As part of this montage, arterial oxygen saturation was measured using a Masimo Radical (software-build 4.1, Masimo Corporation, Irvine, California, USA) pulse-oximeter with 2 s averaging and 1 Hz temporal resolution. All procedures were completed between March 2006 and July 2009, and were compliant with the Thoracic Society of Australia and New Zealand recommendations for paediatric sleep laboratories.24
Each study was manually scored by a trained, experienced scorer, with sleep-staging conducted using Anders criteria at the neonatal study25 and the AASM manual for scoring sleep for infants aged 3 months and over,26 as recommended by Grigg-Damberger et al.27 This study was approved by the Mater Health Services Human Research Ethics Committee (Number 952C).
Data analysis
The nocturnal SpO2 recording for each infant, at each of the study ages, was exported from Somnologica into the European Data Format (.edf) and then imported into MATLAB (Mathworks, Natick, Massachusetts, USA) for further analysis. To account for small analogue acquisition calibration errors (<0.5%) when digitally sampled at the polysomnogram system, SpO2 values were rounded to the nearest integer percentage value. The Masimo Radical oximeter has sophisticated artefact detection algorithms which mark artefactual periods by setting SpO2=0% and, consequently, samples of data less than 25% after rounding were removed from further analysis.
The SpO2 cumulative distribution function (CDF) describes the proportion of the recording spent at or below each integer SpO2 value, that is, for a recording of SpO2 samples S, and integer SpO2 values (x): 1
1
For each infant, at each of the five study points, a CF curve was generated using the method described by Harigopal et al.17 Reference CF reference-curves were then generated by identifying the minimum, 25th percentile, median, 75th percentile and maximum value across the study population at each discrete SpO2 value to generate CF reference-curves representing the expected range of values for healthy infants at the specified age. In addition, the mean, median, 5th and 10th percentiles of SpO2 values (SAT5 and SAT10) were calculated for each study.
Secondary analysis included the stratification of results according to the sleep-states of wake, non-rapid eye movement (REM) and REM (wake, quiet sleep and active sleep for infants at 2 weeks);27–29 the manual identification and removal of movement artefacts in the SpO2 channel (defined as changes in SpO2 corresponding to movement noted on video recording) which were not automatically detected; and comparison of CF reference-curves to those previously presented for healthy preterm children.17 Wilcoxon-Sign-Rank tests were used to compare summary statistics in sleep-state, age and artefact rejection comparisons. p Value<0.01 was considered statistically significant. In the event of a missing study for an infant at a particular age, that infant was excluded from statistical tests in relevant age comparisons.
Results
Of the 34 children enrolled, 31, 25, 27, 26 and 20 participants completed studies at 2 weeks, 3, 6, 12 and 24 months, respectively (see online data supplement 1.1, including figure S1). One study at 2 weeks had less than 60 min of artefact-free SpO2 data and was removed from analysis. Summary statistics of the SpO2 profiles calculated without manual artefact rejection for the infant population are presented in table 1. As expected, mean duration and percentage of study time of REM decreased with maturation, while non-REM percentage of study time increased. SAT5 was lower during wake than non-REM and REM at 2 weeks and 3 months (p<0.01) and SAT10 for the same comparison at 3 months (p<0.01). There was an increase in median values of SAT5 and SAT10 between 2 weeks and 3 months of age for pooled non-REM and REM stratifications (p<0.01). SAT5 and SAT10 increased during wake between 3 and 6 months (p<0.01). The Masimo Radical pulse-oximeter was generally effective in identifying artefact (82.5%, 66.3%, 80.1%, 93.3% and 90.0% of total manually scored artefacts in infants at 2 weeks, 3, 6, 12 and 24 months, respectively). Complete summary statistics for analysis with manual artefact rejection are presented in the online data supplement 1.2. Analysis with manual artefact rejection did not change the population median by >2% for any summary statistics for pooled sleep-states or in REM or non-REM, but during wake did result in a statistically significant increase of median SAT5 at 2 weeks, 3 and 12 months (p<0.01) and a notable increase in the lower bound of the range for SAT5 and SAT10 (up to 23%).
Participant characteristics and SpO2 summary statistics calculated without manual artefact removal
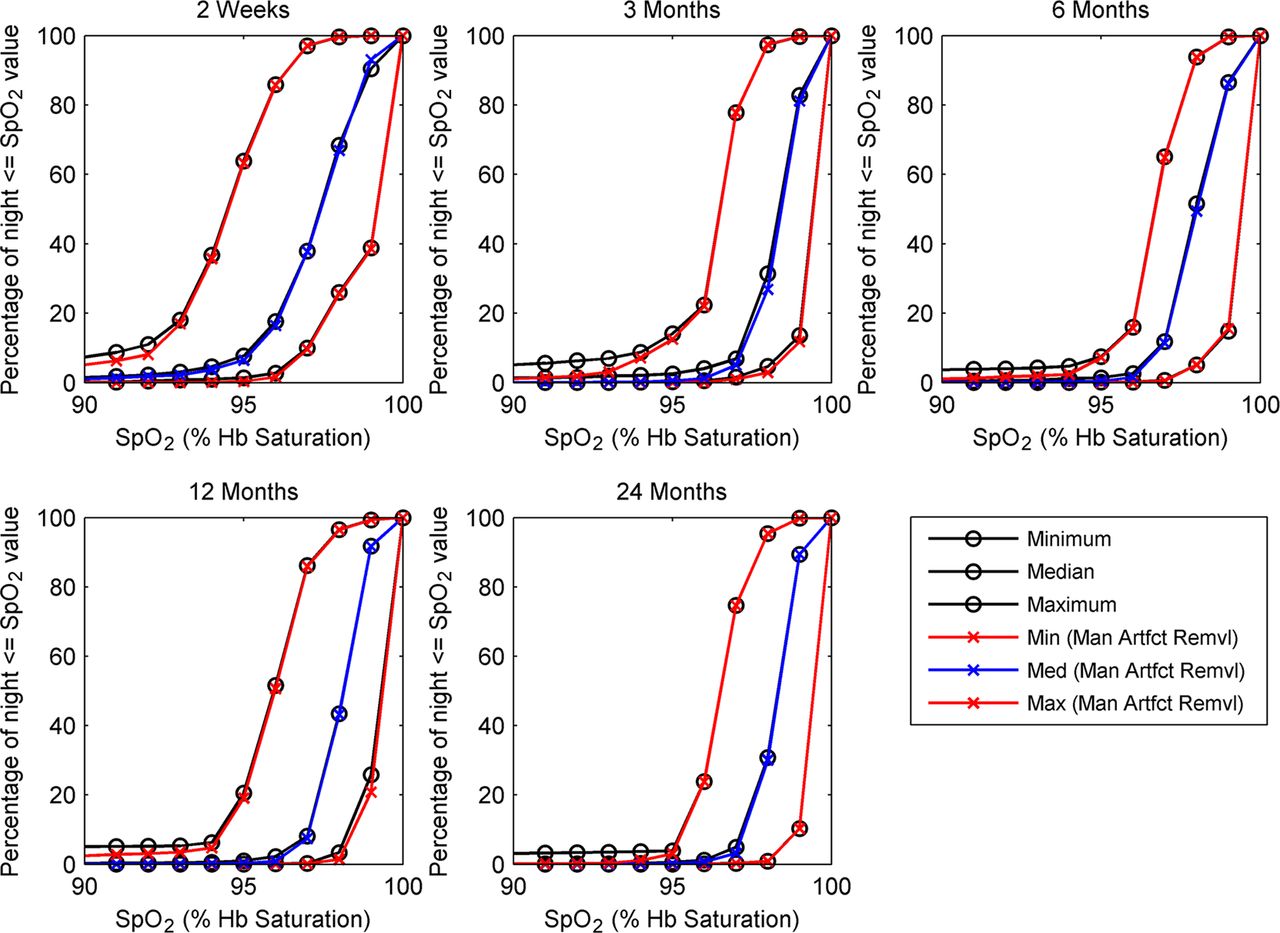
Figure 1 shows the population minimum, 25th, 50th and 75th percentiles and maximum SpO2 CF reference-curves generated for the study population at each of 2 weeks, 3, 6, 12 and 24 months of age. Plots are shown for the full nocturnal recording without manual artefact removal. The CF reference-curves shift right by 1% between 2 weeks and 3 months, where they remain stable up to 24 months. The same CF reference-curves overlaid with reference-curves generated using manual artefact removal are presented in figure 2. There is no qualitative change to median or minimum population curves, but the maximum curve shows a reduced percentage of the night spent below 94% saturation. Tabulated data for these SpO2 CDF nomograms and those generated with sleep-state stratifications are presented in online data supplement 1.3, while commonly used summary statistics derived from these (percentage of night with SpO2 below 92% and 95%) are tabulated in online data supplement 1.4.

Cumulative frequency (CF) reference-curves of SpO2 profiles for a population of healthy term infants aged 2 weeks, 3, 6, 12 and 24 months. CF reference-curves are derived from the nocturnal SpO2 recordings of 30, 25, 27, 26 and 20 infants at 2 weeks, 3, 6, 12 and 24 months of age, respectively, in a longitudinal follow-up study. Results are presented for the whole nocturnal recording, using CF plots calculated from oximetry data without manual artefact removal. The CF plot for an individual shows the percentage of a recording spent at, or below a particular SpO2 value, while the CF reference-curve shows the range of percentage time spent below a particular SpO2 value in the healthy term population. For example, it may be seen that in healthy infants at 2 weeks of age, between 0% and 60% of a recording may be spent with an SpO2 of 95% or less. Notably, the CF reference-curves shift right by 1%–2% between 2 weeks and 3 months, where they remain stable up to 24 months.

SpO2 cumulative frequency (CF) reference-curves for healthy infants aged 2 weeks–24 months, generated with and without manual artefact removal. CF reference-curves are shown for SpO2 data from the whole nocturnal recording. At SpO2 values greater than 95%, there is no discernible deviation between nomogram curves generated with and without manual artefact removal. At lower Spo2 values, the maximum curve for data without manual artefact removal remains higher than the respective nomogram curve with manual artefact removal, indicating that artefact manually removed tends to be at lower SpO2 values. Max (Man Artfct Remvl), population maximum reference-curve generated with manual artefact removal; Med (Man Artfct Remvl), population median reference-curve generated with manual artefact removal; Min (Man Artfct Remvl), population minimum reference-curve generated with manual artefact removal.
Figure 3 compares the CF reference-curves presented in figure 1 with those presented in literature for healthy preterm infants at the same corrected age of 2 weeks post-term.17 The CF reference-curves for the preterm infant group are shifted to the left relative to the healthy infant group (median curve shifted approximately 3%–4% SpO2).

SpO2 cumulative frequency (CF) reference-curves for healthy term infants and healthy preterm infants. CF reference-curves for healthy infants at 2 weeks, overlaid with the reference-curves presented by Harigopal et al17 for healthy preterm infants (median gestational age at birth of 33 weeks; median age at study of 2 weeks). The reference-curves for the preterm infant group are shifted to the left relative to the term infant group (median curve shifted approximately 3%–4% SpO2). Physiological differences in the oxy-haemoglobin dissociation curve, use of different pulse-oximeter models and the extent of manual artefact removal may account for these differences.
Discussion
The objective of this study was to present reference ranges of nocturnal SpO2 recordings from a prospective cohort of healthy term infants at 2 weeks, 3, 6, 12 and 24 months of age using both conventional summary statistics and CF reference-curves. To our knowledge, this is the first study to present reference ranges recorded using a Masimo Radical pulse-oximeter with 2 s averaging in a prospective cohort of healthy term infants from 2 weeks to 24 months. This study was conducted in a sleep-laboratory and, as such, secondary analyses investigated the impact of sleep-state and manual artefact identification on reference ranges.
The SpO2 summary statistics presented for entire nocturnal recordings are generally consistent with the literature despite the recognised variations in recorded SpO2 values between different oximeter makes and models.30 In particular, the population range of mean and median nocturnal SpO2 values was between 95% and 100% over the first 2 years.2 ,5 ,6 ,31 ,32 Median SAT5 was 95% at 2 weeks which supports existing studies that show healthy term neonates have nocturnal SAT5 values as low as 95%10 and these lower end SpO2 values tend to increase and stabilise over the first few months of life.31 These results provide important normative data using a current generation high temporal resolution pulse-oximeter. While this is the first study to present CF reference-curves for healthy term infants, these curves have previously been presented in literature for a cohort of healthy preterm infants.17 It was noted in the results that there was a left shift of 3%–4% in the median curve for preterm infants indicating that SpO2 values are lower in the preterm group. Physiological differences in the oxy-haemoglobin dissociation curve, use of different pulse-oximeter models30 and the extent of artefact removal may account for these differences.
Sleep-state stratification confirmed earlier work that there is no clinically significant difference (>2%) in summary measures of SpO2 between REM and non-REM sleep-states,1 and this was reflected in CF reference-curves (see online data supplement 1.3). Although we found that SAT5 and SAT10 were lower during wake than sleep at 2 weeks and 3 months, this may be related to the additional likelihood of movement artefact during wake which was not detected by the automatic algorithm. While results indicated that Masimo Radical's artefact identification was good, manual artefact removal during wakefulness resulted in an increase in summary statistics (particularly SAT5) and deviation in CDF's (observed as lower percentage of time spent below 90%). No difference was found in either SpO2 summary statistics or SpO2 CDF nomograms for pooled data, REM or non-REM stratifications following manual artefact rejection. These results suggest that clinical utility would not be limited by the inability to classify sleep-stage, although there would be benefit to manually excluding obvious movement artefacts during wake from analysis (see online data supplement 1.5 for further discussion).
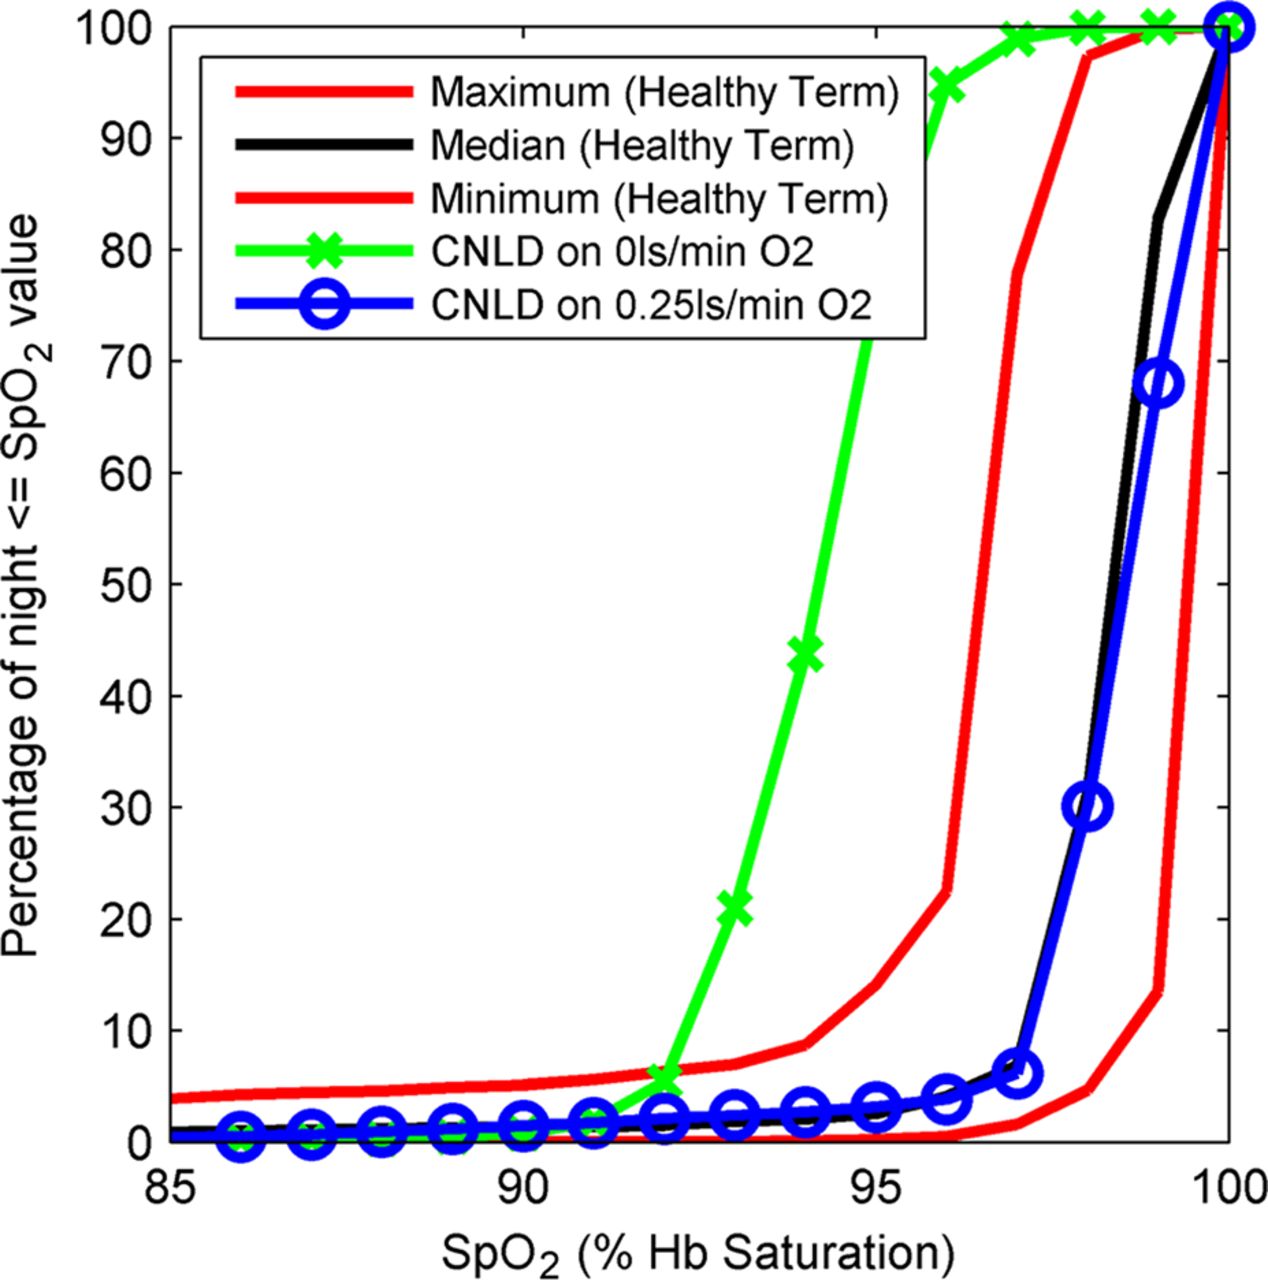
The CF reference-curve has previously been proposed as a useful clinical tool for interpreting extended SpO2 recordings due to its ability to present information about the SpO2 distribution in an intuitive graphical manner.17 ,18 Indeed, SpO2 CF curves for individuals can be produced with some commercial oximetry and polysomnogram software, and may be readily generated using standard spreadsheet software (see online data supplement 2 provides a brief tutorial). Yet, to date, CF reference-curves for healthy term infants have been lacking. This study thus provides important reference data to allow this method to be translated into wider clinical practice. To illustrate the potential clinical utility of CF reference-curves, figure 4 displays the CF curves for an infant with chronic neonatal lung disease at 3 months gestational corrected age during an oxygen titration study superimposed on the CF reference-curves for infants at 3 months. It can be observed that when the infant is in room air, the CF is shifted to the left of the normative range indicating that SpO2 values are lower than may be expected in healthy infants. However, when the same infant is placed in supplemental oxygen at 0.25 L/min, the CF curve is within the healthy range, indicating normal SpO2 distribution. The CF curve alone does not discriminate between a large number of short desaturations or a smaller number of longer desaturations and, as such, best clinical utility would be achieved by using CF curves to complement summary statistics and visual inspection of large time-scale trend graphs. As with all diagnostic tests, results need to be interpreted in the wider clinical context.
Effect of supplemental oxygen on an infant with chronic neonatal lung disease at 3 months corrected age during an oxygen titration study. Cumulative frequency (CF) plots for an infant with chronic neonatal lung disease at 3 months gestational corrected age, plotted over the SpO2 CF reference-curves for healthy infants at 3 months. It can be observed that when the infant is in room air, the CF plot is shifted to the left of the normative range indicating that SpO2 values are lower than may be expected in healthy infants. However, when treated with 0.25 L/min of supplemental oxygen, the CF plot is within the healthy range indicating normal SpO2 distribution.
There are a number of limitations in this study. First, participants were continuously supervised by an experienced sleep technologist to ensure that all sensors remained correctly attached, likely resulting in fewer artefacts than expected in a general clinical environment. While this provides the scientific advantage of improved data quality, it may limit generalisability to other clinical environments. Second, generalisability is also potentially restricted to the pulse-oximeter used in this study. However, it is a commercially available model and is commonly used in hospital settings. Finally, this was a resource-intensive sleep-laboratory based prospective cohort follow-up study, and consequently results may also be limited by a relatively small sample size. This may have particular impact on maximum and minimum CF reference-curves, and these should be interpreted as the maximum and minimum in this sample, rather than the expected limits for the wider population. Future work should expand these results by studying a larger sample in a more generalised clinical environment.
In conclusion, this paper presents reference ranges for healthy term infants aged from 2 weeks to 24 months of nocturnal SpO2 recordings using a Masimo Radical pulse-oximeter with 2 s averaging. The SpO2 CF reference-curves provide an intuitive visual tool for evaluating whether an individual infant's nocturnal SpO2 distribution falls within the range of healthy age-matched infants. This reference range is potentially applicable to extended oximetry studies conducted in a range of generalised care settings and may be a useful tool in monitoring and setting appropriate supplemental oxygen levels for infants with respiratory and other diseases.
Acknowledgments
The authors would like to thank the children and the families who participated in this study.
References
Supplementary materials
Supplementary Data
This web only file has been produced by the BMJ Publishing Group from an electronic file supplied by the author(s) and has not been edited for content.
Files in this Data Supplement:
- Data supplement 1 - Online supplement
- Data supplement 2 - Online Complete_SpO2_CF_ReferenceCurves
- Data supplement 3 - Online Generating_CFplot_Excel_Example
- Data supplement 4 - Online SpO2_Summary_Statistics
Footnotes
-
Contributors Conception and design: PIT, CD; Analysis and interpretation: PIT, CD, IH, MY, CP; Drafting the manuscript for important intellectual content: PIT, CD, IH.
-
Funding This research was funded by the Mater Children’s Hospital Golden Casket Research Fund.
-
Competing interests None.
-
Ethics approval The Mater Hospital Human Research Ethics Committee.
-
Patient consent Written, informed consent was provided by the parent/guardian of the children participating in this study.
-
Provenance and peer review Not commissioned; externally peer reviewed.
-
Data sharing statement The SpO2 cumulative frequency reference-curves presented in the manuscript are available in tabulated form in the online data supplement.