Article Text

Abstract
Objective Although dual-energy X-ray absorptiometry (DEXA) is the preferred method to estimate adiposity, body mass index (BMI) is often used as a proxy. However, the ability of BMI to measure adiposity change among youth is poorly evidenced. This study explored which metrics of BMI change have the highest correlations with different metrics of DEXA change.
Methods Data were from the Quebec Adipose and Lifestyle Investigation in Youth cohort, a prospective cohort of children (8–10 years at recruitment) from Québec, Canada (n=557). Height and weight were measured by trained nurses at baseline (2008) and follow-up (2010). Metrics of BMI change were raw (ΔBMIkg/m2), adjusted for median BMI (ΔBMIpercentage) and age-sex-adjusted with the Centers for Disease Control and Prevention growth curves expressed as centiles (ΔBMIcentile) or z-scores (ΔBMIz-score). Metrics of DEXA change were raw (total fat mass; ΔFMkg), per cent (ΔFMpercentage), height-adjusted (fat mass index; ΔFMI) and age-sex-adjusted z-scores (ΔFMz-score). Spearman's rank correlations were derived.
Results Correlations ranged from modest (0.60) to strong (0.86). ΔFMkg correlated most highly with ΔBMIkg/m2 (r = 0.86), ΔFMI with ΔBMIkg/m2 and ΔBMIpercentage (r = 0.83–0.84), ΔFMz-score with ΔBMIz-score (r = 0.78), and ΔFMpercentage with ΔBMIpercentage (r = 0.68). Correlations with ΔBMIcentile were consistently among the lowest.
Conclusions In 8–10-year-old children, absolute or per cent change in BMI is a good proxy for change in fat mass or FMI, and BMI z-score change is a good proxy for FM z-score change. However change in BMI centile and change in per cent fat mass perform less well and are not recommended.
This is an Open Access article distributed in accordance with the Creative Commons Attribution Non Commercial (CC BY-NC 4.0) license, which permits others to distribute, remix, adapt, build upon this work non-commercially, and license their derivative works on different terms, provided the original work is properly cited and the use is non-commercial. See: http://creativecommons.org/licenses/by-nc/4.0/
Statistics from Altmetric.com
What is already known on this topic?
-
Various body mass index (BMI) metrics are commonly used as proxies for dual-energy X-ray absorptiometry (DEXA) measured adiposity.
-
The ability of BMI metrics to measure adiposity change among children is not well known.
What this study adds?
-
Change in BMI and BMI percentage were the best proxies for change in fat mass or fat mass index; BMI centile change performed less well.
-
Change in per cent fat mass was only modestly correlated with change in BMI metrics, suggesting it is poor for assessing adiposity change.
-
Care is necessary when selecting a BMI metric as a proxy for DEXA; the metrics should not be used interchangeably.
Introduction
Excess adiposity in childhood is associated with several health risks1 ,2 and decreasing the prevalence of childhood obesity has become an important public health priority.3 Although ideally identified with dual-energy X-ray absorptiometry (DEXA), adiposity is usually assessed in clinical practice using body mass index (BMI) as a proxy.4 ,5 To account for its age dependence BMI is typically adjusted for age and sex and expressed as centiles or z-scores.6 ,7 Monitoring of BMI centiles derived from the Centers for Disease Control and Prevention (CDC) growth curves has been recommended to help identify youth with excess adiposity.8–10
BMI and adiposity change over time, due in part to normal growth, but it is unclear how well BMI change acts as a proxy for adiposity change. Cross-sectionally, BMI centiles and z-scores correlate well with DEXA-measured adiposity and better than other body composition measures,11 ,12 but their appropriateness to monitor change in adiposity has been questioned.13–15
There are two issues with inferring adiposity change: the first is imprecision, the extent to which an association between BMI change with DEXA-derived adiposity changes over time might be blurred by measurement error, while the second relates to bias, whether it's appropriate to assume that on average a child tracking along a given BMI centile will also maintain their position in the distribution of body fat. The correlation between BMI change and adiposity change is a simple summary statistic that addresses both issues. However the correlation will vary depending on precisely how the two measures are expressed—several different alternative forms, or metrics, have been proposed for each.
To the best of our knowledge only one previous study compared BMI changes with DEXA changes, based on the metrics of BMI centile and z-score and per cent body fat.13 However, the sample was small (n=54), included only obese children, and did not investigate other metrics of BMI or adiposity. Thus, data on the ability of different BMI metrics to measure adiposity change among youth is limited. Consequently, our objective was to assess the strength of association between BMI change metrics and DEXA change metrics in a large sample of children and adolescents, with two specific aims: to identify which metrics are most closely associated, and to see if they are associated strongly enough for BMI change to be a clinically useful proxy for adiposity change.
Methods
Subjects
Participants for this study were from the Quebec Adipose and Lifestyle Investigation in Youth cohort. Started in 2005, the Quebec Adipose and Lifestyle Investigation in Youth cohort is an ongoing cohort study designed to increase our understanding of the natural history of obesity and its cardiometabolic consequences.16 Children aged 8–10 years at study enrolment and with at least one obese biological parent were eligible to participate. They were followed up 2 years later when the children were aged 10–12 years. This analysis uses data from the baseline and follow-up.
Anthropometry
Height and weight were measured by trained nurses using a stadiometer (height) and electronic scale (weight) according to standardised protocols.17 ,18 Participants wore light indoor clothing and no shoes. Measurements were done in duplicate; if they differed by 0.5 cm or more, or by 0.2 kg or more, a third measurement was taken. The average of the two closest measurements was used for analysis.
BMI was computed as weight (kg)/(height (meters))2. The age-specific and sex-specific CDC reference curves were used to calculate BMI per cent, BMI centile and BMI z-score.6 Study results did not differ when using the reference curves from WHO. BMI percentage was defined as 100 loge (BMI/median BMI for age and sex).19 Four metrics of BMI change were used in the analyses: (1) change in BMI as a raw score, (ΔBMIkg/m2), (2) change in BMI per cent (ΔBMIpercentage), (3) change in BMI centile (ΔBMIcentile) and (4) change in BMI z-score (ΔBMIz-score).
Dual energy X-ray absorptiometry
There is no single measure of DEXA that is the ‘gold standard’ to estimate fat mass, thus we assessed the four commonly used DEXA measurements. Fat mass (FMkg) was measured in kilograms (kg) using DEXA (Prodigy Bone Densitometer System, DF+14664, GE Lunar Corporation, Madison, Wisconsin, USA).20 ,21 Fat mass percentage (FMpercentage) was defined as: 100×fat mass (kg)/(fat mass (kg)+bone mass (kg)+fat-free mass (kg)). An internal fat mass z-score (FMz-score) standardised for age and sex was created based on the power, mean, and the coefficient of variation (LMS) method22 using LMSchartmaker software (http://www.healthforallchildren.com/?product=lmschartmaker-light) as described in the statistical analysis section.22 ,23 Fat mass index (FMI) was defined as fat mass (kg)/(height (meters))2.24 Four metrics of DEXA change were used in the analyses: (1) change as a raw score (ΔFMkg), (2) change in percentage (ΔFMpercentage), (3) change in z-score (ΔFMz-score) and (4) change in FMI (ΔFMI).
Pubertal stage
Trained nurses assessed sexual maturation according to the Tanner stages of puberty.25 ,26 Test-retest reliability indicated excellent agreement (99%) between nurses and paediatricians.27
Statistical analysis
All analyses were performed with SAS V.9.2. As previously mentioned, the internal fat mass z-score was developed using the LMS method. Using non-linear regression, the three curves describing the age-varying distribution of data (median, variability and skewness) were modelled as cubic smoothing splines using penalised likelihood. The best fitting model was identified based on the smallest penalised deviance.22 Separate models were fitted by sex.
Correlations between BMI and DEXA change metrics were assessed using Spearman's rank correlations and were defined based on the literature.28 Differences in correlations were assessed with the Dawson and Trapp method.29 Because previous studies reported the within-child variability of BMI change metrics to be affected by weight status,14 ,15 we assessed whether these correlations varied according to whether the child was normal-weight or underweight, overweight, or obese.
The study was approved by the Centre Hospitalier Universitaire Sainte-Justine ethics committee, and informed consent and verbal assent were provided by the parents and children, respectively.
Results
Of the 630 participants with baseline data, 66 moved or were lost to follow-up (89.5% retention rate). The participants lost to follow-up had higher fat mass at baseline (13.4 kg vs 10.7 kg, p=0.02) but BMIs were not significantly different from our analytical sample (20.4 vs 19.4, p=0.16). We excluded an additional 7 participants who were missing a DEXA scan at either baseline (T1) or follow-up (T2), resulting in a final sample size of 557. The demographic, anthropometric and body composition data of participants at T1 and T2 are presented in table 1. BMIkg/m2, FMkg and FMpercentage increased from T1 to T2. BMIcentile and BMIz-score did not change, suggesting that growth was comparable with the reference. The correlations of BMI metrics with one another on the same occasion were very high (r>0.98 at T1 and r>0.92 at T2, data not shown), as were the correlations of DEXA metrics with one another (r>0.93 at T1, r>0.95 at T2, data not shown). The correlations between BMI metrics and DEXA metrics on the same occasion were also very high (r>0.81 at T1 and T2, data not shown).
Descriptive statistics of the sample (n=557)
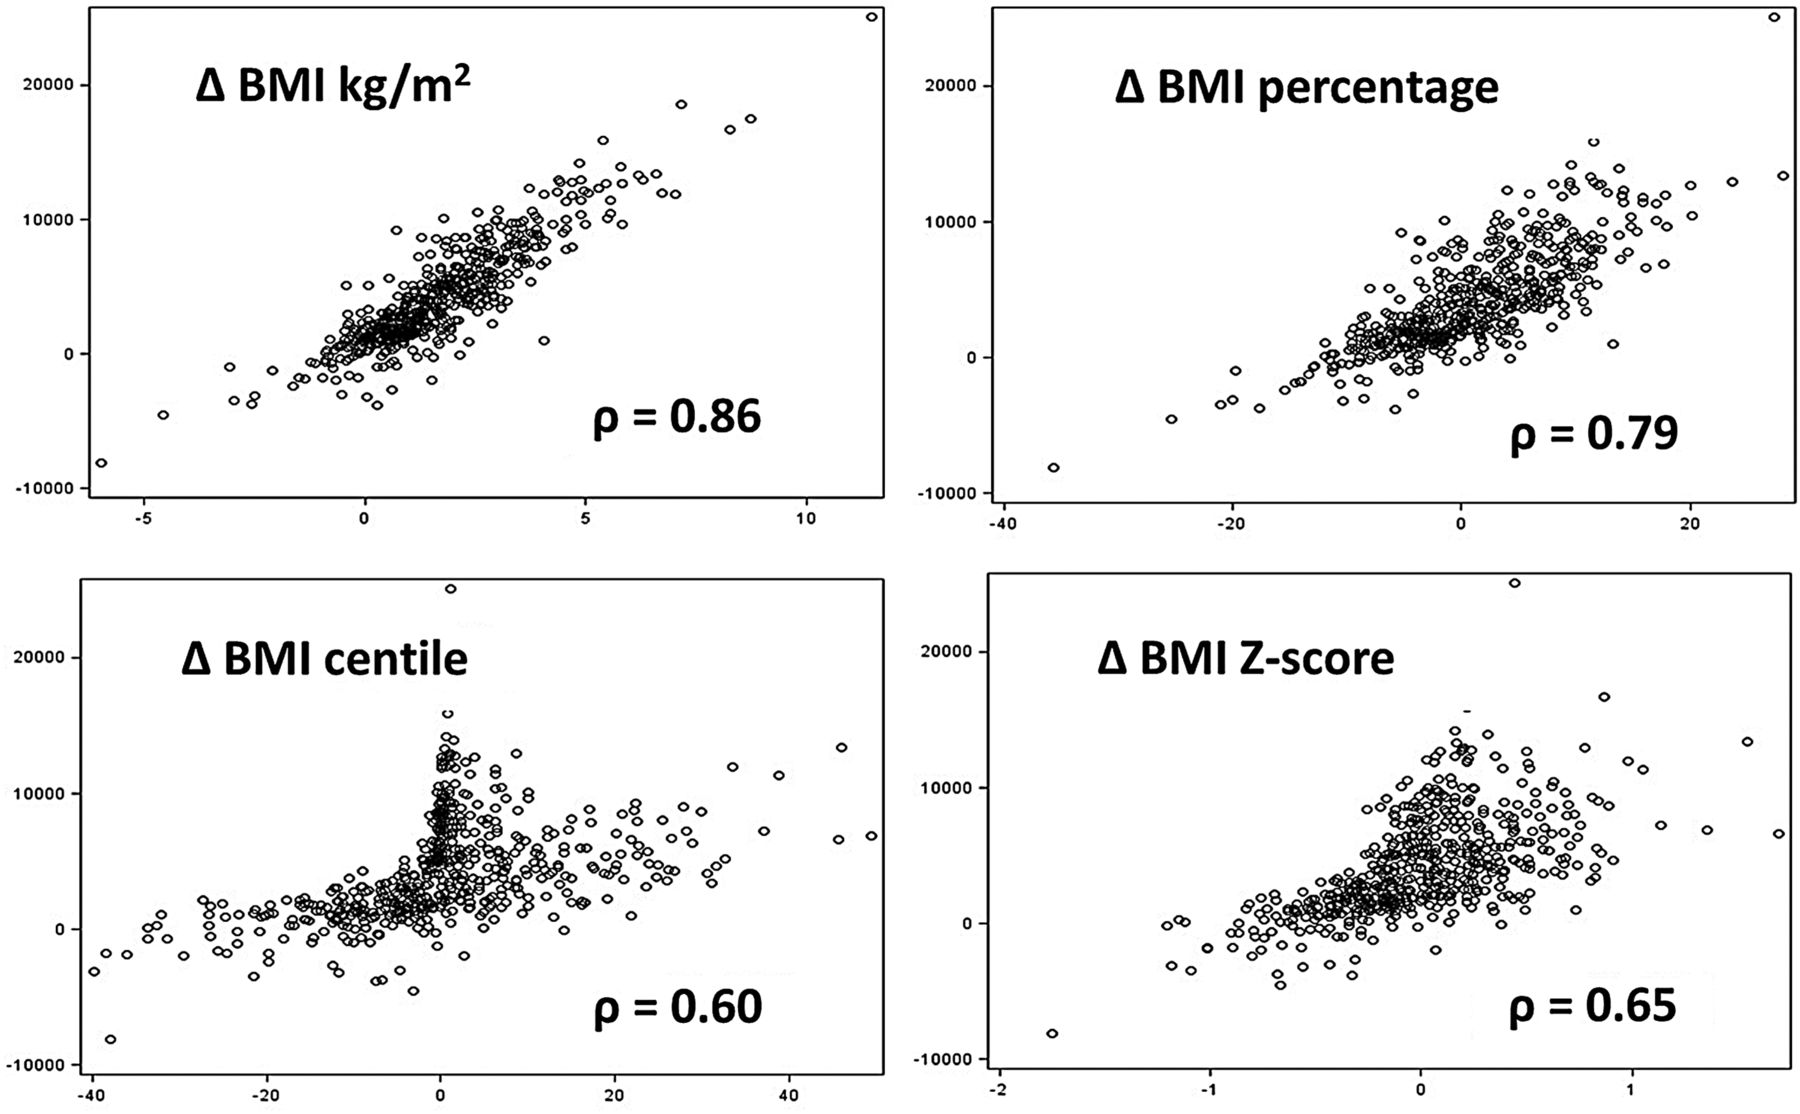
The correlations among BMI change metrics and DEXA change metrics, from T1 to T2, are shown in table 2. ΔBMIkg/m2 was very highly correlated with ΔBMIpercentage (r=0.97), but less so with ΔBMIcentile and ΔBMIz-score (r=0.80 and r=0.87, respectively). Correlations of ΔFMkg with ΔFMpercentage and ΔFMz-score were modest (r=0.67 and r=0.62, respectively), but very high for ΔFMI (r=0.90). Scatter plots between BMI change metrics and DEXA change metrics were similar for all metrics, thus only the relationships between ΔFMkg and the four BMI change metrics are shown (figure 1). ΔFMkg was linearly related to ΔBMIkg/m2 and BMIpercentage, but non-linearly to ΔBMIz-score and ΔBMIcentile. The relationship with ΔBMIz-score was markedly heteroscedastic, and the relationship with ΔBMIcentile revealed some inconsistencies, for example, some individuals in the upper tail of the BMI distribution (who had larger changes in FM) changed little in centile terms while those in the body of the BMI distribution had larger changes.
Spearman's correlations of body mass index (BMI) change metrics and dual-energy X-ray absorptiometry (DEXA) change metrics
Relationship between dual-energy X-ray absorptiometry-measured fat mass change (FM) (Y) and four body mass index (BMI) change metrics (X).
Correlations between the BMI change metrics and DEXA change metrics ranged from a low of r=0.60 to a high of r=0.86. Each BMI change metric with the highest correlation differed based on the DEXA change metric of comparison. Taking each DEXA change metric in turn, ΔFMkg correlated very highly with ΔBMIkg/m2 (r=0.86), ΔFMI with ΔBMIkg/m2 and ΔBMIpercentage (r=0.83–0.84), ΔFMz-score with ΔBMIz-score (r=0.78), and ΔFMpercentage with ΔBMIpercentage (r=0.68). These were all significantly higher than the correlations with other BMI change metrics (p<0.05). Among the BMI change metrics, ΔBMIcentile had the lowest correlations with ΔFMkg, ΔFMpercentage and ΔFMI. None of the four BMI change metrics were highly correlated with ΔFMpercentage. For comparison, height change was weakly correlated with DEXA change metrics (r<0.30, data not shown), while weight change was strongly correlated with ΔFMkg (r=0.75, data not shown) but only moderately with the other DEXA metrics (r<0.55, data not shown). The correlations were similar in girls and boys, and correlations were generally higher among prepubertal than pubertal participants (data not shown).
Results stratified by weight status were consistent with those for the full sample, with a few caveats (see supplemental online material, table 1). ΔBMIkg/m2 among non-overweight and non-obese participants had lower correlations with ΔFMI (r=0.76) than among overweight or obese participants (r>0.82 and 0.89, respectively).
Discussion
Our results indicate that the strength of association between BMI change and the corresponding adiposity change as measured by DEXA depends greatly on the metrics used. ΔBMIcentile has relatively modest correlations with ΔFMkg, ΔFMpercentage and ΔFMI compared with other BMI change metrics and as such is not recommended for longitudinal tracking. ΔFMkg and ΔFMI correlate best with ΔBMIkg/m2 and worst with ΔBMIz-score, while ΔFMz-score correlates best with ΔBMIz-score. In contrast ΔFMpercentage correlates modestly with all three, suggesting it may not be a good DEXA metric, adjusting as it does for weight and (indirectly) weight change.30
Considering the four measurement errors involved (BMI and before and after), the correlations of 0.8 or more for the optimal metric combinations are impressively high, and suggest that for the best metrics BMI change is a valid proxy for DEXA adiposity change.
It is important to recognise that the DEXA metrics do not all measure the same thing: FM measures body adipose tissue content, while the other DEXA measures adjust for body habitus aspects such as weight, height, age and sex. Thus it is not surprising that the correlations between metrics vary. There was a concern that including in the analyses children who differ materially in these respects—for example, younger versus older—may artificially inflate the correlations between ΔBMI metrics and ΔDEXA metrics and that a lower correlation between ΔBMIz-score metrics and ΔFM metrics indicated simply that these confounding factors have been adjusted for. However, partial correlations between ΔBMI metrics and ΔFM metrics while controlling for age and sex did not affect the results (data not shown).
In our study of 8–10-year-old children followed up over 2 years, ΔBMIkg/m2 or ΔBMIpercentage were the best proxies for ΔFMkg or ΔFMI measured by DEXA. The existing literature is sparse and largely restricted to investigating the within-subject variability of BMI change metrics over time. The literature is inconsistent, possibly reflecting differences due to variation in follow-up periods and age ranges.14 ,15
While previous studies have shown BMIcentile to have a higher correlation with fat mass than weight for height or skinfold thickness,11 ,12 our results strongly deprecate the use of ΔBMIcentile for longitudinal tracking of adiposity change among children and adolescents.8 ,9 The correlations between ΔBMIcentile and ΔFMkg, ΔFMpercentage and ΔFMI were significantly lower than those for the highest correlated BMI change metrics (see figure 1, where the relationship with FMkg is complex and non-linear). This is because the centile scale is bounded at 0% and 100%, and foreshortened in the tails. Thus an overweight—or more particularly obese—child with a centile in the upper 90s cannot change their centile very much over time—despite even large changes in raw BMI. Conversely a child away from the two tails of the distribution has much more leeway for their centile to change.
A simple example should make this clear. Suppose a boy initially aged 10 years has an increase in BMI over 2 years of 3.4 kg/m2 (ie, 1 SD more than the observed mean change—table 1). If he starts on the median (BMIz-score=0) his BMI increases from 16.6 kg/m2 to 20.0 kg/m2, a change of 0.78 in BMIz-score and 28 in BMIcentile (from the 50th to the 78th centile). Conversely if he starts on the 98th centile (BMIz-score=2) his BMI increases from 24.6 units to 28.0 units, a change of just 0.09 in BMIz-score and only 0.4 in BMIcentile. The BMIz-score change is 9 times larger, and the BMIcentile change 60 times larger, for the thinner child. Thus BMIz-score and BMIcentile are relatively insensitive to BMI changes occurring in the upper tail of the distribution, but the centile is particularly affected due to its bounded and foreshortened scale. The z-score scale by contrast is not bounded, but its upper tail is foreshortened due to the right skewness in the BMI distribution. This weakens its value for monitoring obese individuals over time.
Strengths and limitations
Our study assessed BMI change metrics with DEXA-measured adiposity change across the spectrum of adiposity in a large cohort of children and adolescents. However, we included an internal measure of variability (FMz-score) and results may not be generalisable to other study populations. This internal measure was included in order to be consistent with the literature,15 and to have a DEXA metric comparable with BMIz-score which is adjusted for age and sex. Although our significance testing revealed statistically significant differences between the highest and lowest correlations for all pairs of DEXA metrics and BMI metrics, they may not be substantial from a clinical point of view.
This sample comprised Caucasian children with a parental history of obesity. Although this sample may be generalisable to a large proportion of the Canadian population, additional research in other populations would be of interest. Due to the study design 40% of our sample was overweight or obese, and we were able to follow them up over 2 years and assess the correlations stratified by weight status. Our age range was narrow (8–10 years at baseline), and future studies should have a wider age range and longer follow-up. Because the aim of our study was to identify the BMI change metrics which would best correlate with DEXA change metrics, we used the CDC's BMI reference which has been recommended for longitudinal tracking.8 However, the CDC curves are known to be limited for use among youth beyond the 97th BMI centile.31 Thus studies assessing the ability of other growth curve references to monitor adiposity change are needed.
Conclusions
Accurately measuring adiposity change during childhood has important implications for proper clinical management and public health surveillance. Our results indicate that BMI change can be an effective proxy for DEXA adiposity change, but care is needed to choose the appropriate metrics for BMI and adiposity. In terms of change the strongest associations are for BMIkg/m2 with FMkg or FMI, and slightly less strongly for BMIz-score with FMz-score. For FMpercentage the correlations with all BMI metrics are only modest, and similarly BMIcentile performs consistently poorly.
Acknowledgments
Dr Marie Lambert passed away on 20 February 2012. Her leadership and devotion to the Quebec Adipose and Lifestyle Investigation in Youth (QUALITY) cohort will always be remembered and appreciated. The authors wish to especially thank Robert W Platt, for his statistical input. LK is supported through the Canadian Institutes of Health Research (CIHR) grant (MOP-67121) and a postdoctoral fellowship from the Fonds de recherche du Québec -Santé. TJC is funded by UK Medical Research Council research grant MR/J004839/1. GP holds a CIHR Applied Public Health Research Chair in Chronic Diseases Prevention. The authors thank the reviewers for their very helpful comments.
References
Supplementary materials
Supplementary Data
This web only file has been produced by the BMJ Publishing Group from an electronic file supplied by the author(s) and has not been edited for content.
Files in this Data Supplement:
- Data supplement 1 - Online supplement
Footnotes
-
Contributors All authors contributed to the design of the study and the interpretation of the results. LK performed the data analysis and drafted the paper. MH, AC, TJC and GP reviewed and edited the paper.
-
Competing interests None.
-
Patient consent Obtained.
-
Ethics approval The study was approved by the Centre Hospitalier Universitaire Sainte-Justine ethics committee..
-
Provenance and peer review Not commissioned; externally peer reviewed.