Article Text

Abstract
Background and objective The Zika virus outbreak has drawn attention to microcephaly, whose definition is based on head circumference measuring below a percentile or number of SDs below the mean. The objective of this analysis was to assess how differences in measurement precision might affect prevalence and trends of microcephaly.
Methods Data from all births in Uruguay during 2010–2015 were obtained from the Perinatal Information System. The prevalence of births with microcephaly was calculated based on head circumference measurement at birth applying the INTERGROWTH-21st standards for sex and gestational age, and compared by method of ascertaining gestational age.
Results Rounding and digit preference was observed: 74% of head circumference measurements were reported as a whole centimetre value. The prevalence of births varied substantially by the criterion used to define microcephaly (<3 SD, <2 SD, <3rd percentile for gestational age) and could be halved or doubled based on adding or subtracting a half-centimetre from all reported head circumference measurements. If 4 days were added to gestational age calculations, rather than using completed gestational weeks (without days) for gestational age reporting, the prevalence was 1.7–2 times higher.
Discussion Rounding in measurement of head circumference and reporting preferences of gestational age may have contributed to a lower prevalence of microcephaly than expected in this population. Differences in head circumference measurement protocols and gestational age dating have the potential to affect the prevalence of babies reported with microcephaly, and this limitation should be acknowledged when interpreting head circumference data collected for surveillance.
- microcephaly
- bias
- head circumference
- gestational age
- Zika virus infection
Statistics from Altmetric.com
What is already known on this topic?
Microcephaly, a clinical sign of possible brain abnormalities, is based on head circumference measurements at birth applying international growth standards for sex and gestational age.
The definitions used to estimate prevalence of microcephaly are either 2 or 3 SD below the average or the third percentile.
What this study adds?
In a population-based national database of deliveries, we found a high proportion of rounding and digit preference when reporting head circumference.
In addition, gestational age was preferentially reported based on completed gestational weeks, rather than the exact number of weeks and days from last menstrual period.
Both the findings—rounding in measurement of head circumference and reporting preferences for gestational age—contribute to uncertainty regarding the true prevalence of microcephaly in this population.
Introduction
Congenital Zika syndrome has been defined as specific clinical features that include decreased brain tissue with specific brain abnormalities (eg, intracranial calcifications, cerebral atrophy, abnormal cortical formation, corpus callosum abnormalities, cerebellar abnormalities, porencephaly, hydranencephaly, ventriculomegaly/hydrocephaly); eye abnormalities (eg, microphthalmia or anophthalmia, coloboma, cataract, intraocular calcifications, chorioretinal anomalies involving the macula excluding retinopathy of prematurity, optic nerve atrophy, pallor and other optic nerve abnormalities); congenital contractures, such as clubfoot or arthrogryposis and hypertonia restricting body movement soon after birth.1 2 The first sign that Zika virus infection during pregnancy was affecting fetal brain development was an increase in the number of children identified with microcephaly.
Severe cases of microcephaly are readily identifiable at birth; however, for less severe cases, the diagnosis relies on head circumference. The most widely accepted clinical definition for microcephaly based on head circumference varies; it is based on percentile or z-score for gestational age (usually 2 or 3 SDs below the mean for gestational age, or below the third percentile3), rather than an absolute or visible measure. Multiple definitions of microcephaly have been issued by groups such as the Pan-American Health Organization (PAHO), the Brazilian Ministry of Health and WHO. The Zika virus outbreak prompted researchers to develop definitions for microcephaly when gestational age or sex is not known.4 These multiple definitions make interpreting trends in prevalence of microcephaly4 particularly difficult, especially when detection of microcephaly may also be impacted by increased awareness generated by the Zika epidemic.5 6
Since the definition of microcephaly is primarily based on measurement rather than clinical signs or symptoms, appropriate measurement and standardisation of head circumference is key to defining the true prevalence of microcephaly. However, measurement of head circumference is not entirely straightforward and depends on the user. A measuring tape must be placed precisely at the widest possible circumference of the head (the broadest part of the forehead above the eyebrow, above the ears and at the most prominent part of the back of the head), and this can be difficult when the neonate is actively moving. In addition, small degrees of tightening of the measuring tape can affect the measurement. Results are therefore user dependent, which results in substantial variation. In addition, since head circumference percentiles are calculated based on gestational age, methods of estimating gestational age can also have an impact on the detection of microcephaly.7 We explored the impact of small changes in measurement and reported gestational age methodology on the reported prevalence of microcephaly using Latin American data.8
Methods
The Sistema Informatico Perinatal (SIP; Perinatal Information System) is a high-quality clinical database used in 20 countries in Latin America and the Caribbean.9 Begun in 1983, SIP is the product of a technical consensus among professionals in the region, and data are collected under the auspices of PAHO’s Latin American Center of Perinatology, Women’s Health and Reproductive Health (Centro Latinoamericano de Perinatologia, Salud de la Mujer y Reproductiva (CLAP/SMR)10). Data are collected clinically as part of routine care. They consist of a perinatal clinical record, delivery card, labour partogram and neonatal hospitalisation data. A copy of the form is provided in online supplementary appendix 1. In Uruguay, providers are reimbursed for care on completion of this form, so data are quite complete.
Supplemental material
Data description
On the CLAP form, the head circumference variable allows for recording as centimetres with one decimal place. The gestational age at delivery variable allows for recording weeks and days. Ultrasound and/or last menstrual period (LMP) can be noted; and if those are not available, clinical judgement can be used for determining gestational age. If an infant appears to be (based on birth weight and general appearance) <32 weeks’ gestation, head circumference is used; beyond 32 weeks, the Capurro method is used.11 Mode of delivery can be recorded as spontaneous, caesarean, forceps, vacuum or other.
The Uruguay dataset included 263 310 total births (2010–2015) and 261 330 live births. The analyses included all observations with head circumference measures (n=258 060, 99% of live births), and a sensitivity analysis was limited to plausible values, operationalised as those within 5 SD of the mean (n=255 919, 99% of those with head circumference measures). Results were similar if stillbirths were included (data not shown).
Statistical methods
The distribution of head circumference at birth was assessed by tabulation and graphically. Gestational age was calculated as completed weeks+days. Microcephaly was defined in three ways: <2 SD, <3 SD and <3rd percentile, based on INTERGROWTH-21st standards13 for sex and gestational age; with a normal distribution, 2 SD is <2.3% and 3 SD is <0.15%. Although INTERGROWTH standards have been criticised,12 it has been used for Zika cohorts,13 14 and no other standard was found that aimed to be internationally representative and contained the level of detail necessary. Kernel plots and smoothers were calculated overall and by gestational week. To assess the possible effects of rounding up or rounding down for head circumference and rounding down for gestational age to the last completed week, results were assessed adding and subtracting 0.5 cm from head circumference, and adding 4 days to the gestational age. Differences by mode of delivery (caesarean vs vaginal; other methods were not examined) and method of ascertaining gestational age (ultrasound, LMP and clinical estimate) were also examined. As early gestational ages are sometimes estimated using head circumference, we repeated the analysis with estimated gestational age removed. Chi-square tests were used to assess statistical variation. Analyses were conducted using SAS V.9.4 and the INTERGROWTH-21st application (https://intergrowth21.tghn.org/intergrowth-21st-applications/).
This analysis of de-identified health statistics data was not subject to human subjects review.
Results
The overall distribution of head circumference is seen in table 1 and figure 1. Strong digit preference was seen; 74% of head circumference measurements had a whole centimetre value, 25% had a half-centimetre value and 1% had any other digit. Exclusion of implausible values had little effect on the overall distribution.

Head circumference with normal and kernel smoothers, implausible values removed. Top, bin width=1, bottom, bin width=1.1.
Descriptive statistics, SIP Uruguay, all live births only
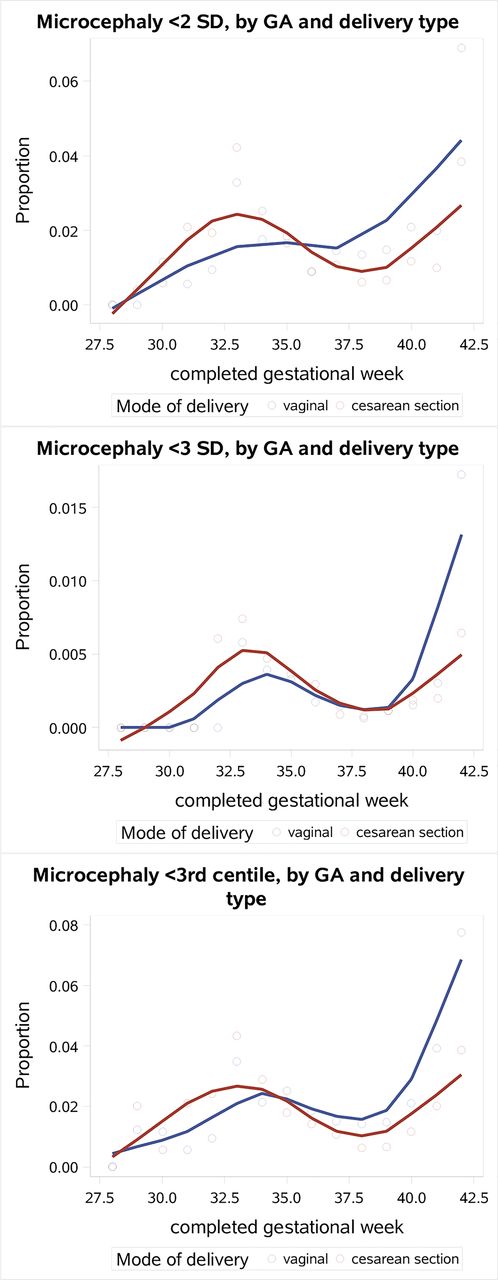
The prevalence of babies born with microcephaly varied with the definitional cut points (table 2). For <2 SD, only 1.33% of infants were defined as having microcephaly compared with an expected 2.5%. When using the cut point of <3rd percentile, 1.46% of the infants were defined as having microcephaly; when using <3 SD, 0.14% were defined as such, which is what would be expected. If head circumference measurements are all adjusted up or down by half a centimetre, these prevalences halved or doubled; if 4 days was added to gestational age, the prevalence was 1.7–2 times higher, depending on the criterion used. When examined by mode of delivery (figure 2), prevalence of microcephaly varied between vaginal birth versus caesarean section, and at later gestational ages, vaginal births resulted in higher prevalence of microcephaly.

Mode of delivery and prevalence of microcephaly, by gestational age (GA) (>28 weeks), implausible head circumference data removed (>5 SD from the mean, n=253 452).
Number and prevalence of babies with microcephaly by INTERGROWTH-21st standards, SIP, Uruguay
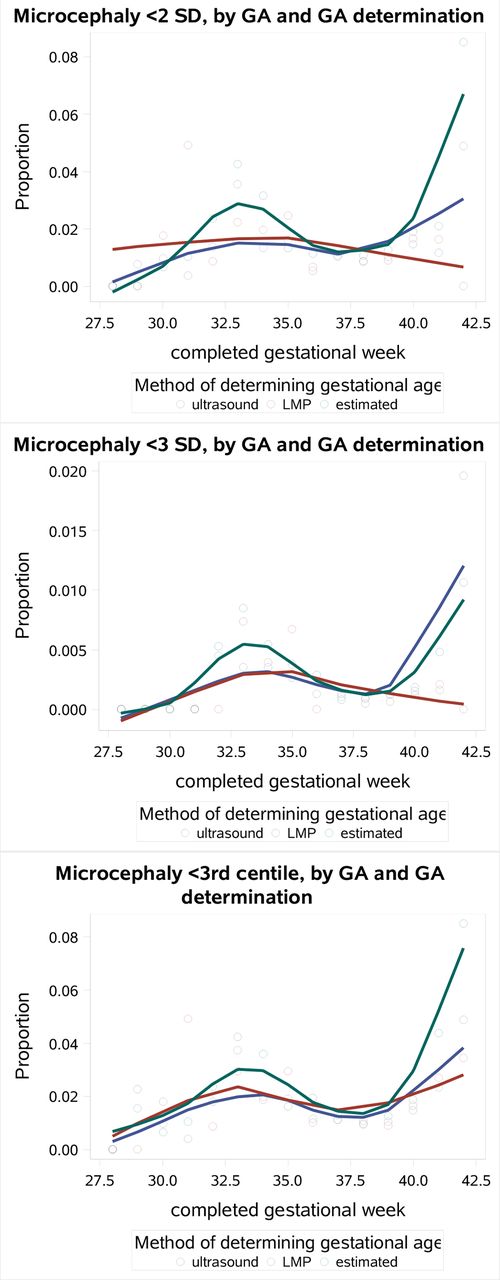
The prevalence of microcephaly did not increase when examined by method of ascertaining gestational age (figure 3), although gestational age based on ultrasound was associated with a more constant prevalence across gestational age (overall distribution of head circumference by gestational age, online supplementary figure 1). Almost all birth reports in the dataset with a clinical estimate of gestational age (97.8%) had only completed weeks reported (i.e., either missing data for the gestational days variable, or 0 gestational days); 87.5% of those with LMP-based dating had only completed weeks reported, and 91.2% of those with ultrasound-based dating had only completed weeks reported. Sensitivity results repeating analyses limited to live births with gestational ages based on LMP or ultrasound were similar to the main analysis and are provided in online supplementary appendix table 1.
Methods of ascertaining gestational age and prevalence of microcephaly, by gestational age, implausible data removed (limited to HC±5 SD (cm)) and GA >28 weeks. GA, gestational age; LMP, last menstrual period.
Discussion
In 6 years of birth cohort data from Uruguay, we found a lower prevalence of microcephaly than expected when defined using head circumference measurements and the cut points of <2 SD and <3rd percentile from the INTERGROWTH-21st standards. A high proportion of rounding and digit preference for measuring head circumference and gestational age contributes to uncertainty in the true prevalence of microcephaly. A half-centimetre reduction in all head circumference measurements would be sufficient to double the prevalence, which would be a closer approximation of the expected prevalence, although it is not known whether there was more upward rounding than downward rounding. The use of completed gestational weeks instead of exact weeks and days likely contributed to a lower than expected prevalence of microcephaly.
Other factors may contribute to the lower reported prevalence of microcephaly. Head moulding during birth (more likely to occur during vaginal births) may result in a smaller head circumference at birth until the moulding resolves, which can confound the ability to obtain the true head circumference immediately after birth.15 16 However, we did not observe a marked difference in prevalence of microcephaly between vaginal births compared with caesarean section. In terms of pregnancy dating, gestational age is most accurately determined by early ultrasound,17 while clinical estimates at birth (not based on ultrasound or LMP) are likely to be approximated or rounded.18 In this study, ultrasound-dated pregnancy was associated with more consistent prevalence of microcephaly meeting percentile criteria.
The Centers for Disease Control and Prevention (CDC) provided updated guidance for head circumference measurement early during the Zika epidemic.18 19 INTERGROWTH-21st standards are provided to the millimetre,20 but it is technically difficult to measure that precisely with measuring tapes. The standard INTERGROWTH-21st charts start at week 33 and day 0, with a later inclusion for very preterm babies, which start at week 24 and day 0 to week 32 and day 6. However, the low numbers at the early gestational weeks limit the ability to determine the shapes of the curves in these data. INTERGROWTH-21st standards are meant to represent ideal measurements in an ethnically and racially diverse but healthy population. INTERGROWTH and other international standards have been controversial.12 The bias created by comparison against this ideal would be a higher rather than lower prevalence of microcephaly; another interpretation is that the INTERGROWTH standards failed to capture half the cases of microcephaly in this dataset. No other standard was available that included South American populations and had the level of detail necessary for the analysis.
Population prevalence of microcephaly reported across countries is highly variable. In the era prior to the Zika virus outbreak in the Americas, population estimates of microcephaly were between 0.3 and 12 per 10 000, indicating that stricter definitions, or additional criteria, were being used in diagnosis.3 21–24 The Latin American Collaborative Study of Congenital Malformations examined baseline prevalence of microcephaly as reported within 10 South American countries in this surveillance system25; hospital-based prevalence was 4.4 per 10 000 births and population-based prevalence was 3.0 per 10 000. Twenty-nine per cent of these were perinatal deaths, and 57% were diagnosed as part of a syndrome or had multiple malformations,25 suggesting these were particularly severe cases. A study of microcephaly in Ribeirão Preto and São Luis, Brazil prior to the Zika epidemic (2010), found that between 2% and 4% of children had head circumference measurements that were <2 SD, and 0.5%–0.9% had head circumference <3 SD (by various standards).21 Comparing the routinely collected data (the Brazilian Live Birth Information System) to these numbers (measured by trained personnel supervised by a research team) suggested that microcephaly was substantially under-reported, perhaps 90% of the time. Vaginal delivery was also associated with a higher prevalence of microcephaly in that study.
These results indicate that time trends in prevalence of microcephaly may be difficult to interpret. Changes in prevalence of microcephaly, even with no underlying population shifts, could be produced by greater attention to measurement, better dating of pregnancy or changes in clinical practice leading to differing use of ultrasound. Recent reports in Brazil indicate criteria for microcephaly have shifted over time, and suspected cases of microcephaly relied on screening criteria that had very low specificity, suggesting an overestimate of the actual number of cases.26 Surveillance systems may be designed to maximise either sensitivity or specificity, but changes in emphasis towards one or the other will produce unreliable trend data.
Some researchers have suggested using disproportionate microcephaly (head circumference relative to weight)7 or head circumference: femur ratios27 as more nuanced and perhaps better indicators of Zika-related outcomes. Given the data source, the extent to which we can draw clinically relevant conclusions is limited, but it seems likely that any meaningful assessment will require more than a single measurement, which can at best serve as a screening tool. A recent simulation study suggests that cut-off-based definitions have very poor positive predictive values.28 The CDC has provided guidelines recommending a comprehensive physical examination, age-appropriate vision screening, developmental monitoring, hearing screening and neuroimaging when head circumference measurement suggests microcephaly, which may assist in defining the clinical case definitions for Zika-related or other severe birth defects.29 Our results using routinely collected surveillance data show how variability in head circumference measurements and gestational dating may influence the prevalence of microcephaly. This variability needs to be considered when interpreting prevalence of microcephaly to assess whether changes in prevalence are real or an artefact of measurement. For monitoring populations, more precise measurement may be needed for trends to be interpretable.
Acknowledgments
The authors would like to acknowledge John Nahabedian and Dr. Cynthia Moore for helpful suggestions on an earlier draft.
References
Footnotes
Contributors EWH performed data analysis and drafted the manuscript. PMB conceived the paper, assisted with study design and secured funding. MLC and SG assisted with study design and interpretation. GT facilitated data access and assisted with study design and interpretation. VT assisted with study design, interpretation and securing of funding. All authors contributed to manuscript development and edited for critical content, and have approved the final version.
Funding This study was funded by Vysnova Partners (SC-2017-3034-TU).
Disclaimer The findings and conclusions of this report are those of the authors and do not necessarily represent the official position of the Centers for Disease Control and Prevention.
Competing interests None declared.
Patient consent for publication Not required.
Provenance and peer review Not commissioned; internally peer reviewed.
Data availability statement Data may be obtained from a third party and are not publicly available.